| Param | Original file | Final file |
|---|---|---|
| Filename | modeM0/AS1A10_121T02_9000004378_30441cztM0_level2.evt | modeM0/AS1A10_121T02_9000004378_30441cztM0_level2_quad_clean.evt |
| Size (bytes) | 526,775,040 | 85,944,960 |
| Size | 502.4 MB | 82.0 MB |
| Events in quadrant A | 3,288,342 | 556,886 |
| Events in quadrant B | 4,996,840 | 556,320 |
| Events in quadrant C | 3,752,979 | 543,840 |
| Events in quadrant D | 3,516,805 | 534,317 |
| Mode M0 | |||
|---|---|---|---|
| Quadrant | BADHDUFLAG | Total packets | Discarded packets |
| A | 0 | 13638 | 1 |
| B | 0 | 18565 | 1 |
| C | 0 | 15233 | 1 |
| D | 0 | 14616 | 2 |
| Mode SS | |||
|---|---|---|---|
| Quadrant | BADHDUFLAG | Total packets | Discarded packets |
| A | 0 | 120 | 0 |
| B | 0 | 120 | 0 |
| C | 0 | 120 | 0 |
| D | 0 | 120 | 0 |
| Mode M9 | |||
|---|---|---|---|
| Quadrant | BADHDUFLAG | Total packets | Discarded packets |
| A | 0 | 13 | 0 |
| B | 0 | 13 | 0 |
| C | 0 | 13 | 0 |
| D | 0 | 13 | 0 |
| Quadrant | Total seconds | Saturated seconds | Saturation percentage |
|---|---|---|---|
| A | 5886 | 99 | 1.681957% |
| B | 5887 | 154 | 2.615933% |
| C | 5887 | 196 | 3.329370% |
| D | 5886 | 100 | 1.698947% |
Noise dominated data is calculated using 1-second bins in cleaned event files. If a bin has >2000 counts, and if more than 50% of those come from <1% of pixels, then it is considered to be noise-dominated and hence unusable.
| Quadrant | # 1 sec bins | Bins with >0 counts | Bins with >2000 counts | High rate bins dominated by noise | Noise dominated (total time) | Noise dominated (detector-on time) | Marked lightcurve |
|---|---|---|---|---|---|---|---|
| A | 7201 | 5886 | 2 | 2 | 0.03% | 0.03% | 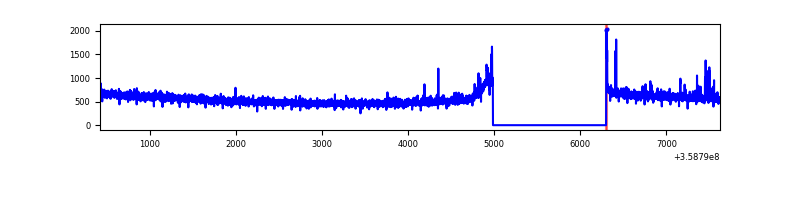 |
| B | 7202 | 5887 | 2 | 2 | 0.03% | 0.03% | 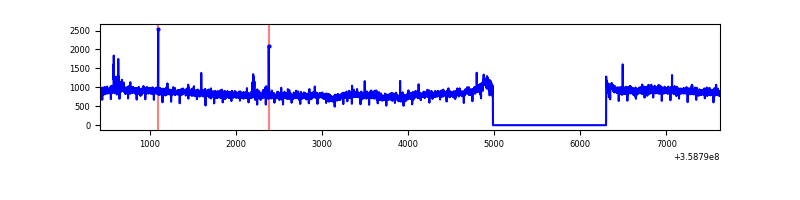 |
| C | 7202 | 5887 | 20 | 20 | 0.28% | 0.34% | 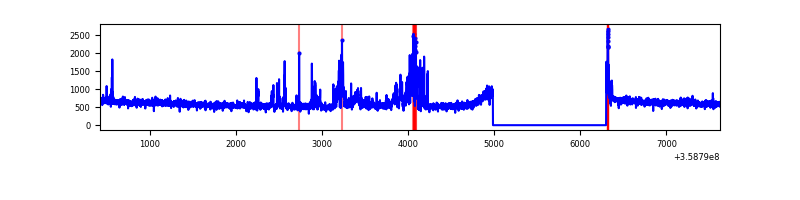 |
| D | 7201 | 5886 | 27 | 27 | 0.37% | 0.46% | 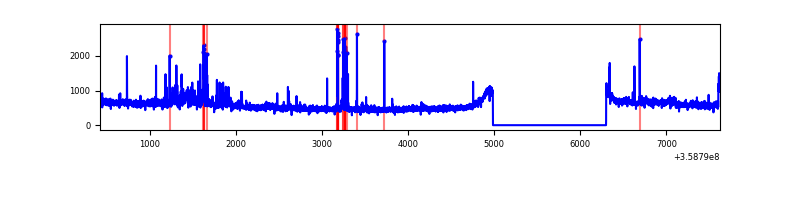 |
Top three noisy pixels from each quadrant. If the there are fewer than three noisy pixels in the level2.evt file, extra rows are filled as -1
| Pixel properties | Quadrant properties | ||||||
|---|---|---|---|---|---|---|---|
| Quadrant | DetID | PixID | Counts | Sigma | Mean | Median | Sigma |
| A | 0 | 13 | 44192 | 263.28 | 835 | 822 | 164.7 |
| A | 8 | 192 | 11868 | 67.06 | 835 | 822 | 164.7 |
| A | 13 | 254 | 10236 | 57.15 | 835 | 822 | 164.7 |
| B | 6 | 159 | 1715746 | 11159.38 | 825 | 808 | 153.7 |
| B | 12 | 111 | 17720 | 110.05 | 825 | 808 | 153.7 |
| B | 0 | 229 | 17567 | 109.05 | 825 | 808 | 153.7 |
| C | 3 | 233 | 420418 | 2252.35 | 811 | 820 | 186.3 |
| C | 14 | 238 | 132584 | 707.29 | 811 | 820 | 186.3 |
| C | 15 | 159 | 20281 | 104.46 | 811 | 820 | 186.3 |
| D | 8 | 195 | 158309 | 821.63 | 821 | 804 | 191.7 |
| D | 7 | 238 | 80311 | 414.75 | 821 | 804 | 191.7 |
| D | 13 | 249 | 57684 | 296.72 | 821 | 804 | 191.7 |
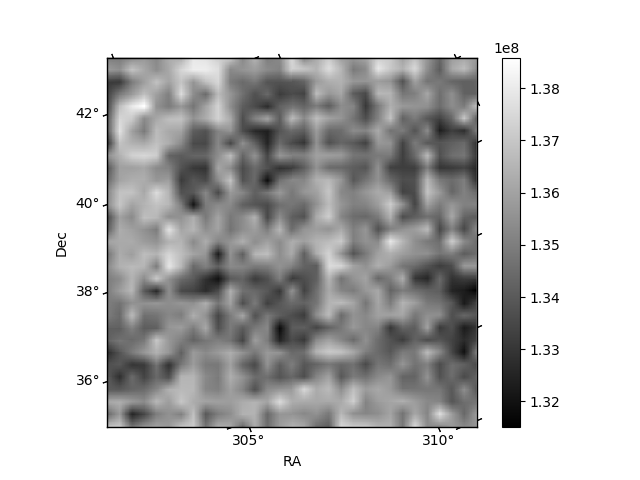
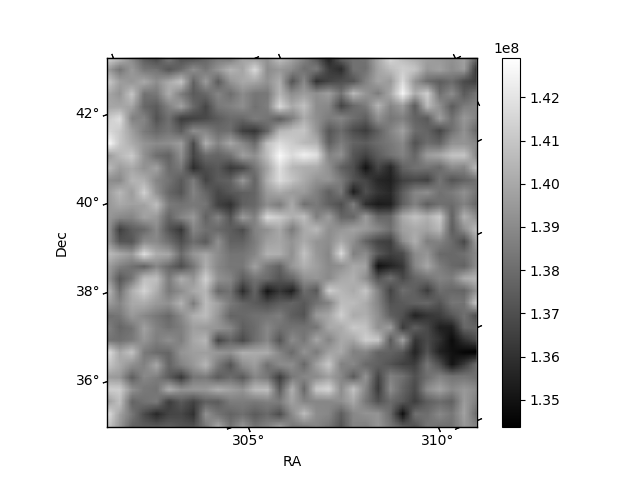
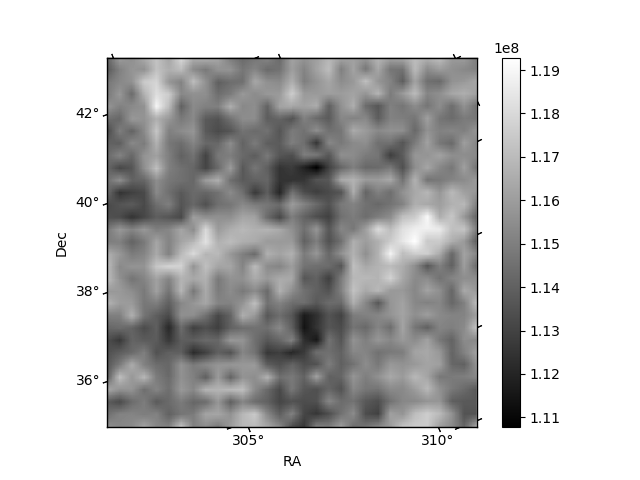
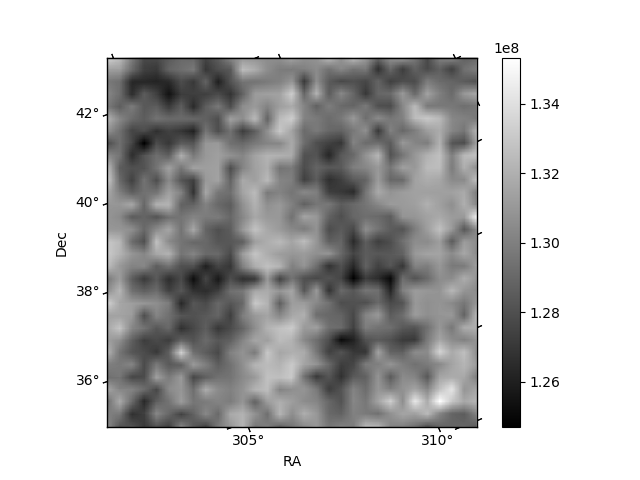
Histogram calculated using DETX and DETY for each event in the final _common_clean file
| Quadrant A |  |
 |
Quadrant B |
|---|---|---|---|
| Quadrant D |  |
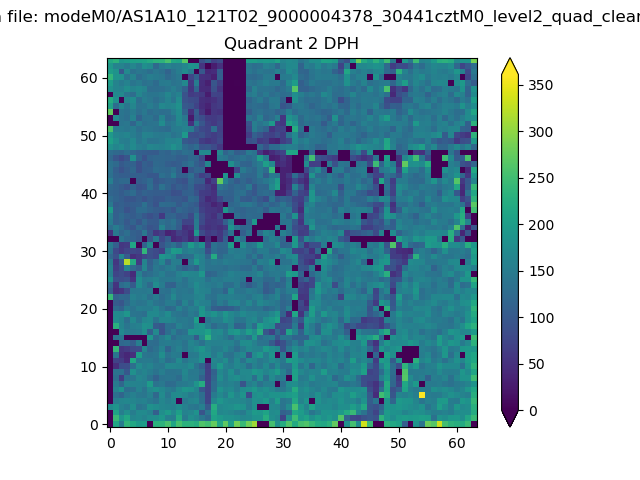 |
Quadrant C |
| Plot type | Count rate plots | Images |
|---|---|---|
| Comparison with Poisson distribution Blue bars denote a histogram of data divided into 1 sec bins. Red curve is a Poisson curve with rate = median count rate of data. |
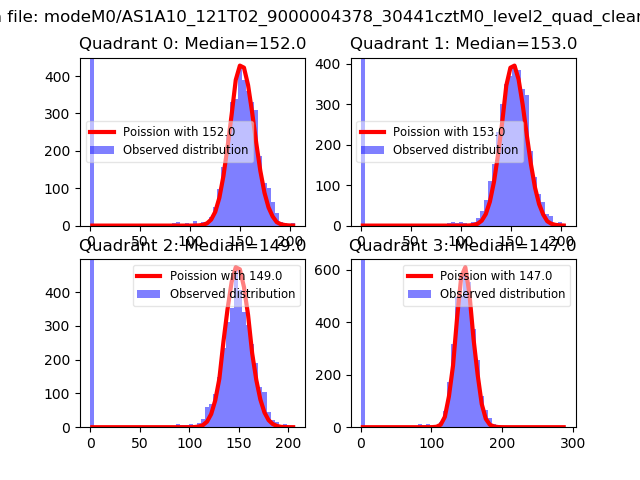 |
 |
| Quadrant-wise count rates Data is divided into 100 sec bins |
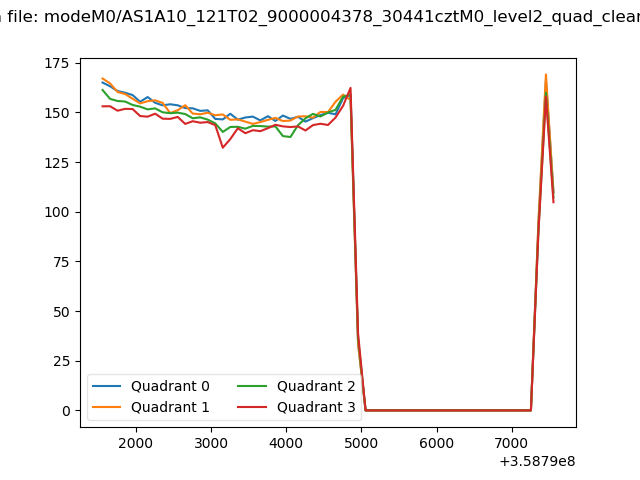 |
|
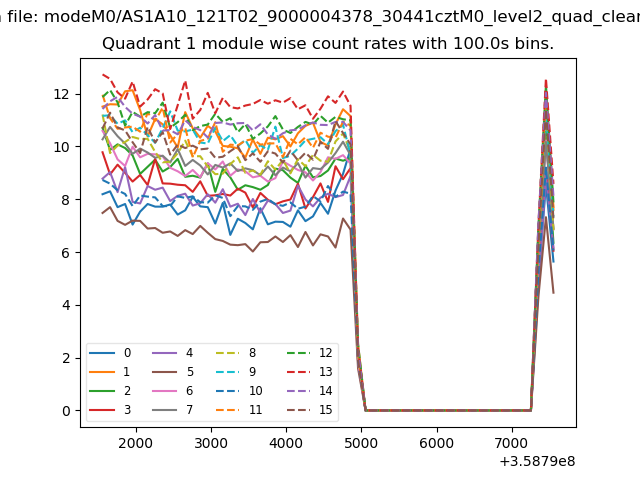
| Module-wise count rates for Quadrant A Data is divided into 100 sec bins |
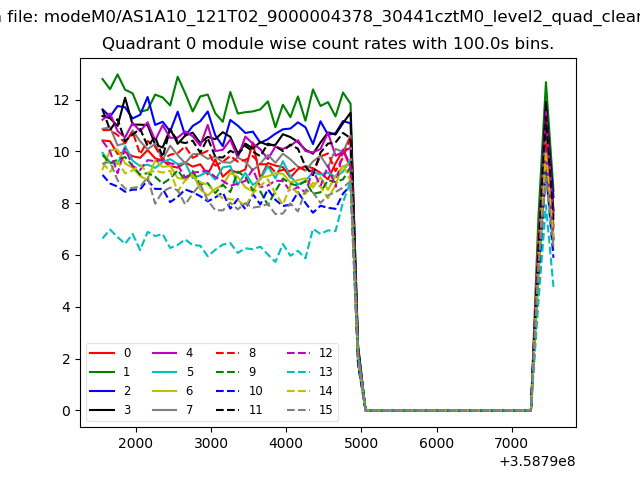 |
 |
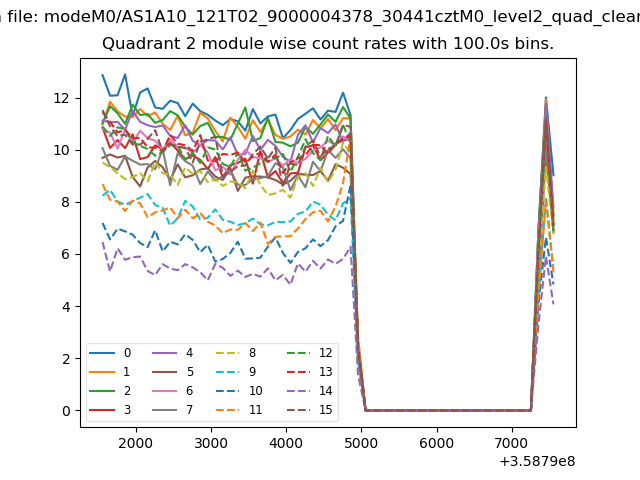
| Module-wise count rates for Quadrant B Data is divided into 100 sec bins |
 |
 |
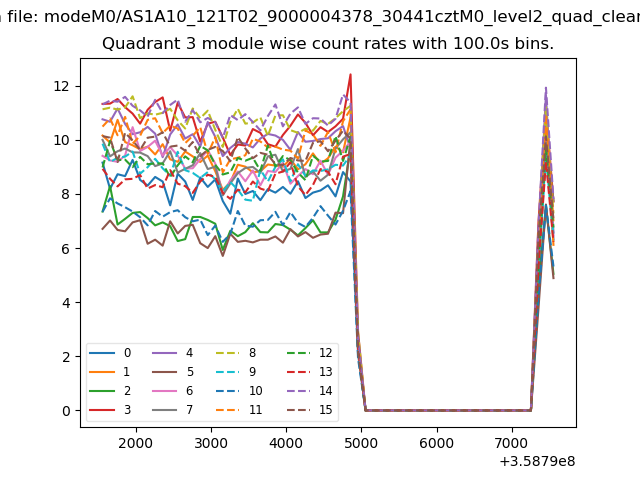
| Module-wise count rates for Quadrant C Data is divided into 100 sec bins |
 |
 |
| Module-wise count rates for Quadrant D Data is divided into 100 sec bins |
 |
 |
| Parameter | Plot |
|---|---|
| CZT HV Monitor | 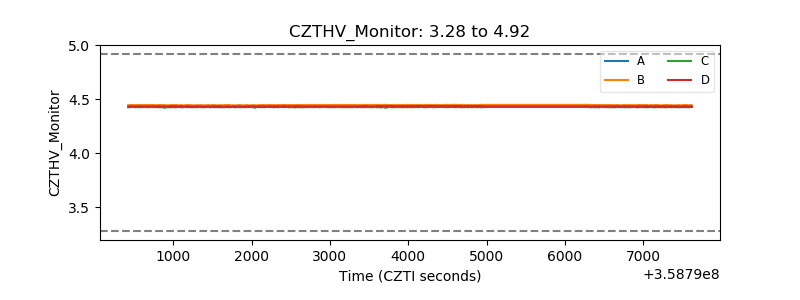 |
| D_VDD | 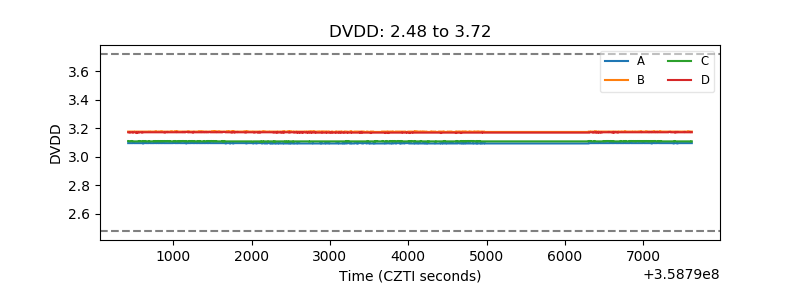 |
| Temperature 1 | 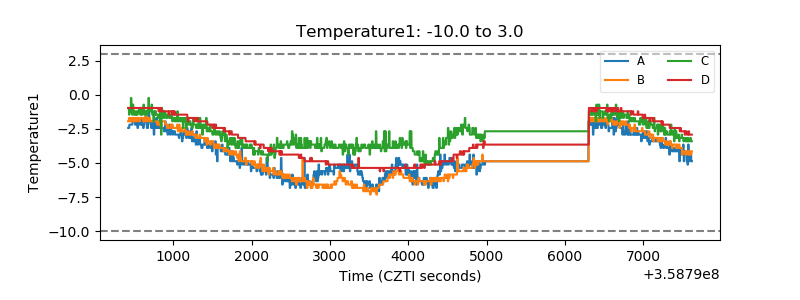 |
| Veto HV Monitor | 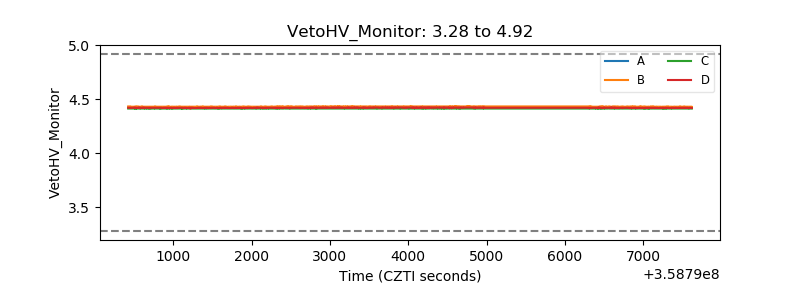 |
| Veto LLD |  |
| Alpha Counter | 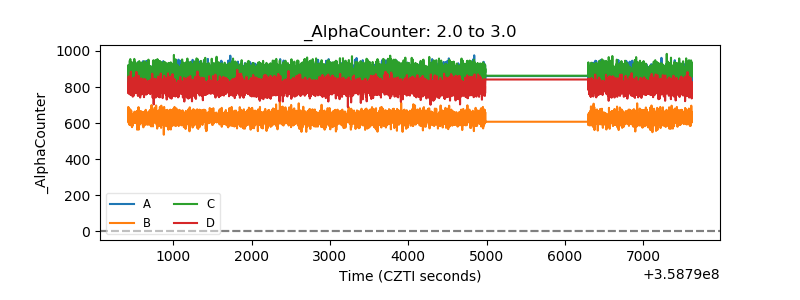 |
| _CPM_Rate | 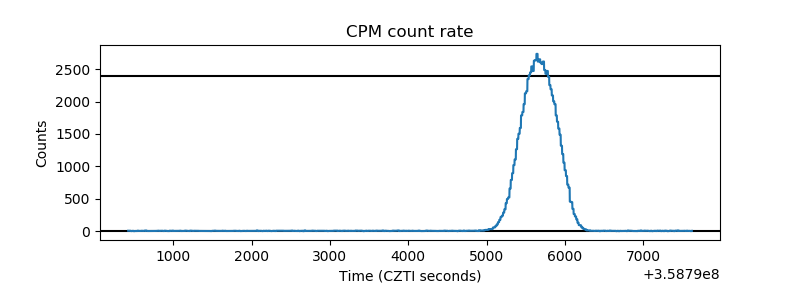 |
| CZT Counter | 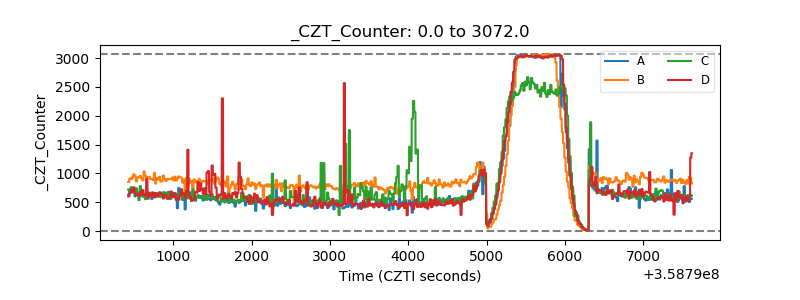 |
| +2.5 Volts monitor |  |
| +5 Volts monitor | 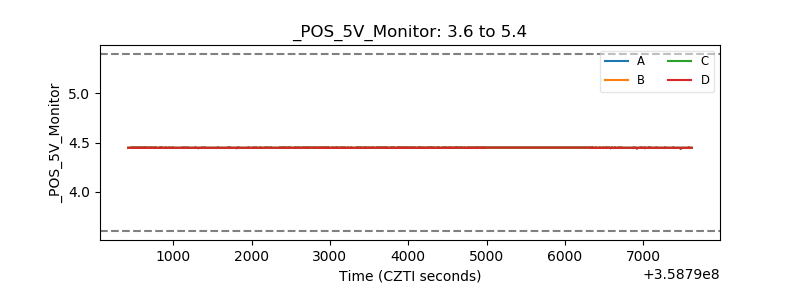 |
| _ROLL_ROT | 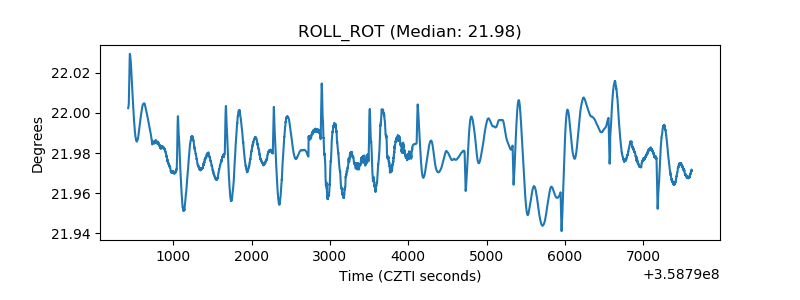 |
| _Roll_DEC | 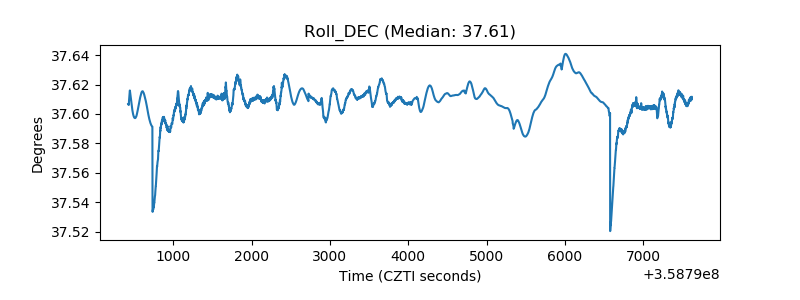 |
| _Roll_RA |  |
| Veto Counter | 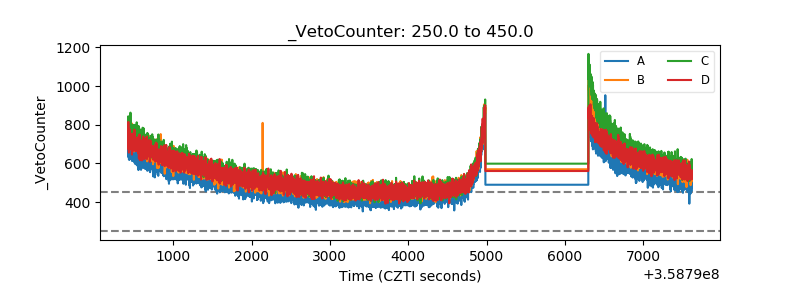 |