| Param | Original file | Final file |
|---|---|---|
| Filename | modeM0/AS1A10_121T02_9000004378_30442cztM0_level2.evt | modeM0/AS1A10_121T02_9000004378_30442cztM0_level2_quad_clean.evt |
| Size (bytes) | 563,469,120 | 98,262,720 |
| Size | 537.4 MB | 93.7 MB |
| Events in quadrant A | 3,495,199 | 642,371 |
| Events in quadrant B | 5,244,924 | 645,261 |
| Events in quadrant C | 3,669,222 | 634,215 |
| Events in quadrant D | 4,233,426 | 619,101 |
| Mode M0 | |||
|---|---|---|---|
| Quadrant | BADHDUFLAG | Total packets | Discarded packets |
| A | 0 | 14373 | 2 |
| B | 0 | 19579 | 2 |
| C | 0 | 15059 | 2 |
| D | 0 | 16840 | 2 |
| Mode SS | |||
|---|---|---|---|
| Quadrant | BADHDUFLAG | Total packets | Discarded packets |
| A | 0 | 128 | 0 |
| B | 0 | 128 | 0 |
| C | 0 | 128 | 0 |
| D | 0 | 128 | 0 |
| Mode M9 | |||
|---|---|---|---|
| Quadrant | BADHDUFLAG | Total packets | Discarded packets |
| A | 0 | 12 | 0 |
| B | 0 | 12 | 0 |
| C | 0 | 12 | 0 |
| D | 0 | 12 | 0 |
| Quadrant | Total seconds | Saturated seconds | Saturation percentage |
|---|---|---|---|
| A | 6227 | 94 | 1.509555% |
| B | 6226 | 148 | 2.377128% |
| C | 6227 | 244 | 3.918420% |
| D | 6227 | 357 | 5.733098% |
Noise dominated data is calculated using 1-second bins in cleaned event files. If a bin has >2000 counts, and if more than 50% of those come from <1% of pixels, then it is considered to be noise-dominated and hence unusable.
| Quadrant | # 1 sec bins | Bins with >0 counts | Bins with >2000 counts | High rate bins dominated by noise | Noise dominated (total time) | Noise dominated (detector-on time) | Marked lightcurve |
|---|---|---|---|---|---|---|---|
| A | 7497 | 6227 | 9 | 9 | 0.12% | 0.14% | 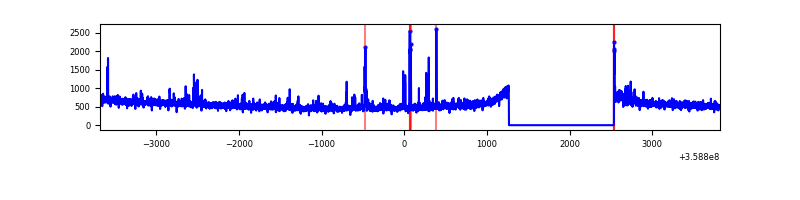 |
| B | 7496 | 6226 | 0 | 0 | 0.00% | 0.00% | 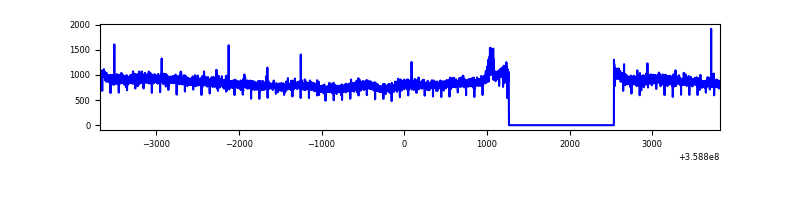 |
| C | 7497 | 6227 | 42 | 42 | 0.56% | 0.67% | 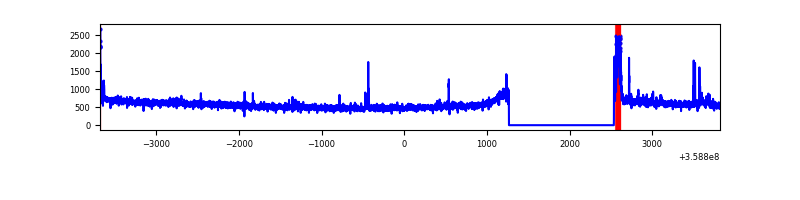 |
| D | 7497 | 6227 | 207 | 207 | 2.76% | 3.32% | 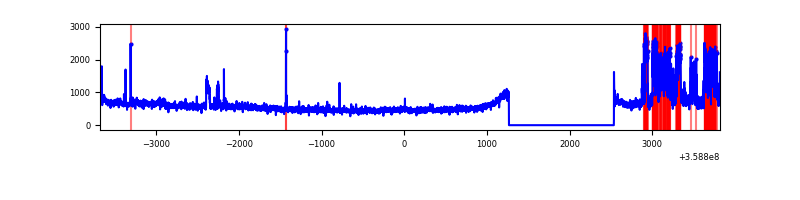 |
Top three noisy pixels from each quadrant. If the there are fewer than three noisy pixels in the level2.evt file, extra rows are filled as -1
| Pixel properties | Quadrant properties | ||||||
|---|---|---|---|---|---|---|---|
| Quadrant | DetID | PixID | Counts | Sigma | Mean | Median | Sigma |
| A | 0 | 13 | 160416 | 930.6 | 860 | 844 | 171.5 |
| A | 13 | 254 | 11146 | 60.08 | 860 | 844 | 171.5 |
| A | 8 | 192 | 10257 | 54.9 | 860 | 844 | 171.5 |
| B | 6 | 159 | 1823342 | 11310.93 | 853 | 835 | 161.1 |
| B | 15 | 33 | 30823 | 186.11 | 853 | 835 | 161.1 |
| B | 0 | 229 | 28378 | 170.94 | 853 | 835 | 161.1 |
| C | 14 | 238 | 136304 | 705.48 | 835 | 845 | 192.0 |
| C | 3 | 233 | 129288 | 668.94 | 835 | 845 | 192.0 |
| C | 0 | 10 | 119536 | 618.15 | 835 | 845 | 192.0 |
| D | 13 | 104 | 448133 | 2053.1 | 831 | 818 | 217.9 |
| D | 13 | 249 | 297701 | 1362.64 | 831 | 818 | 217.9 |
| D | 8 | 195 | 211908 | 968.87 | 831 | 818 | 217.9 |
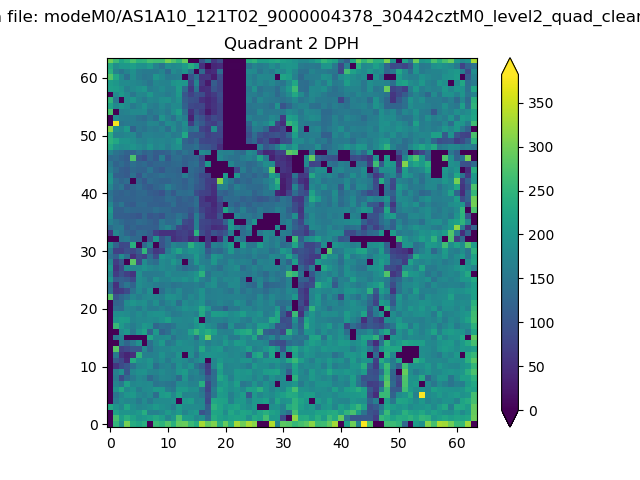
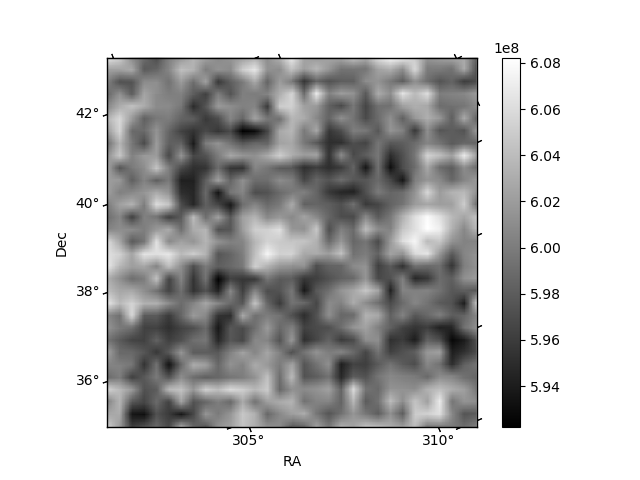
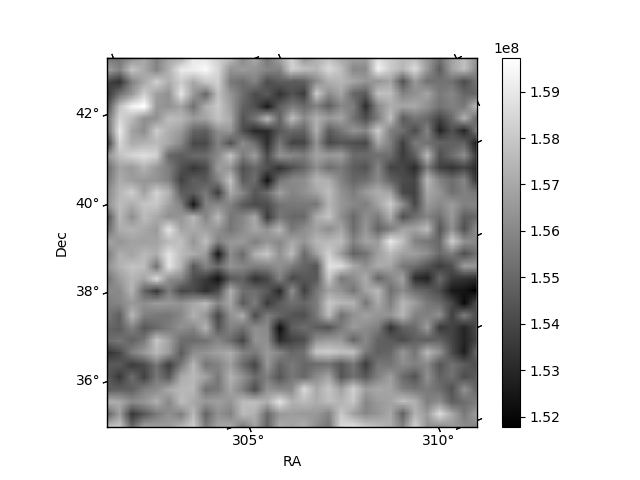
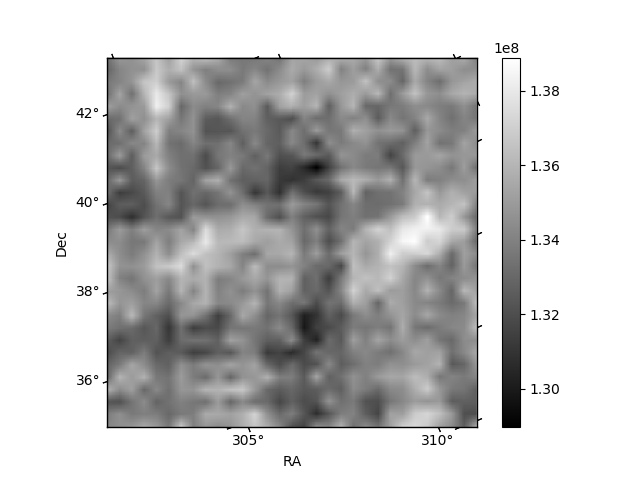
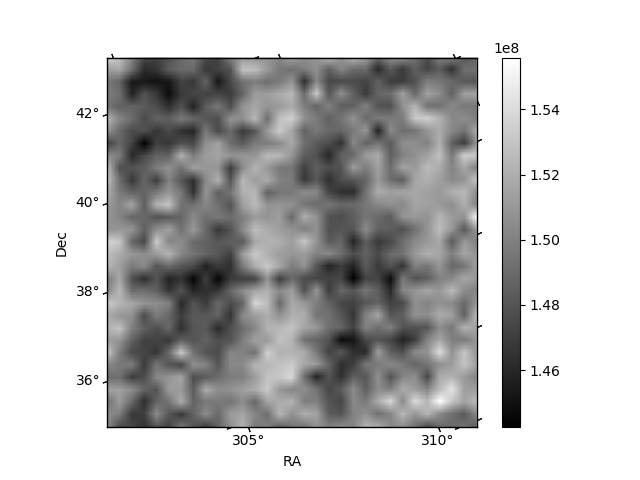
Histogram calculated using DETX and DETY for each event in the final _common_clean file
| Quadrant A | 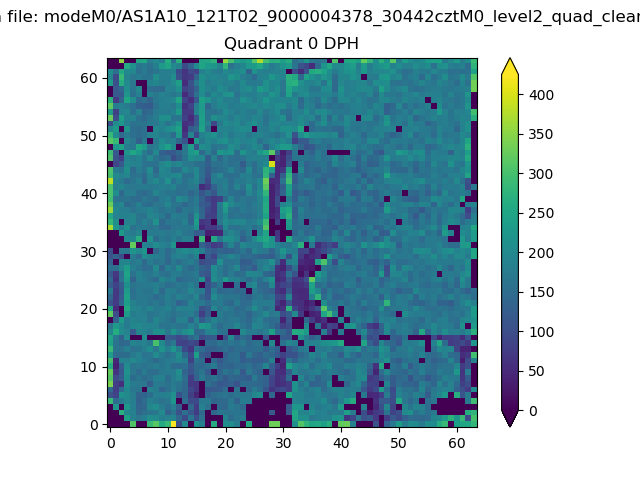 |
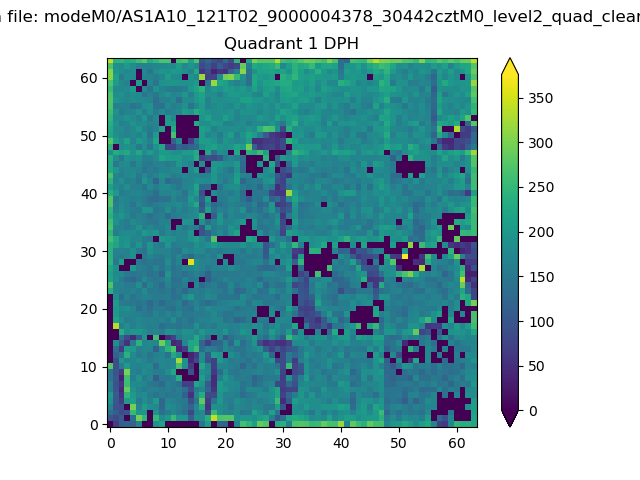 |
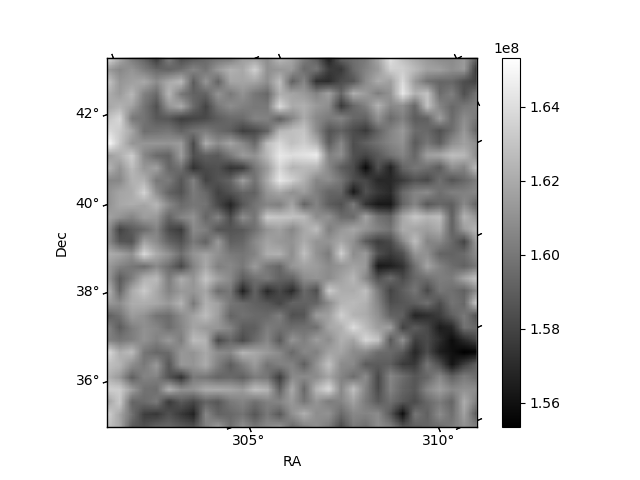
Quadrant B |
|---|---|---|---|
| Quadrant D | 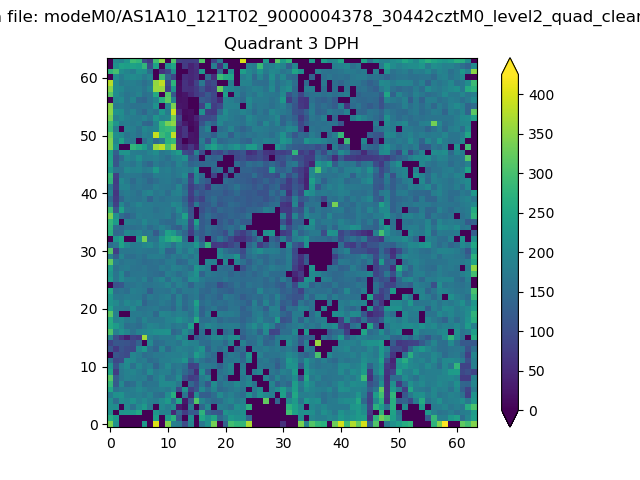 |
 |
Quadrant C |
| Plot type | Count rate plots | Images |
|---|---|---|
| Comparison with Poisson distribution Blue bars denote a histogram of data divided into 1 sec bins. Red curve is a Poisson curve with rate = median count rate of data. |
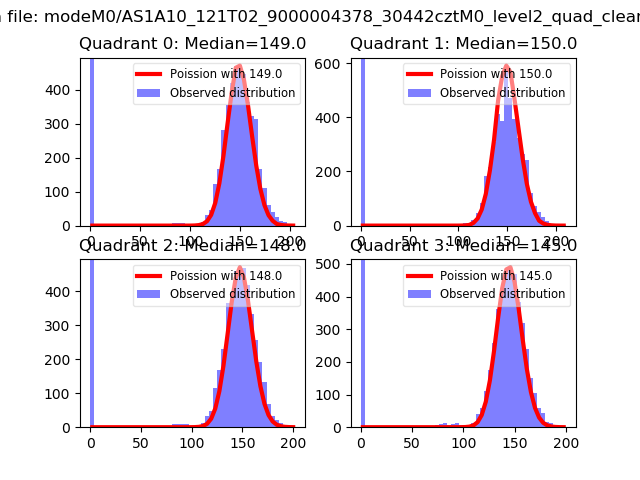 |
 |
| Quadrant-wise count rates Data is divided into 100 sec bins |
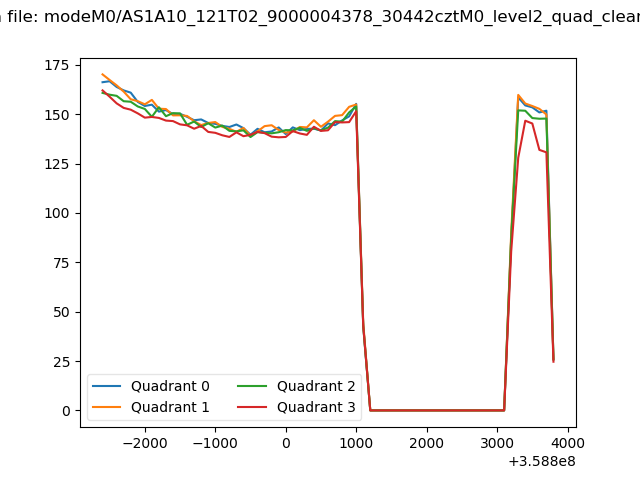 |
|
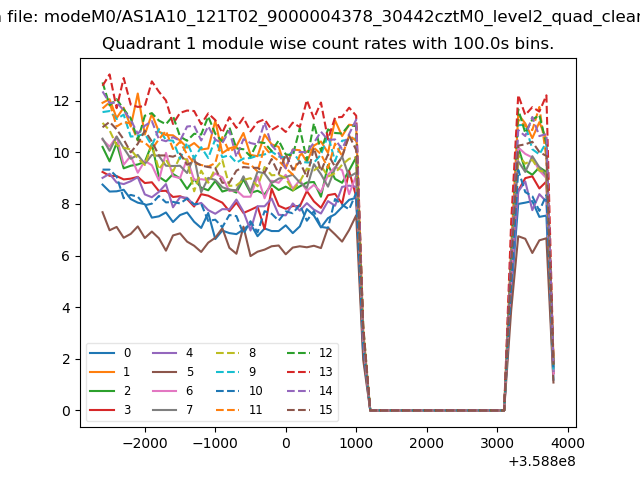
| Module-wise count rates for Quadrant A Data is divided into 100 sec bins |
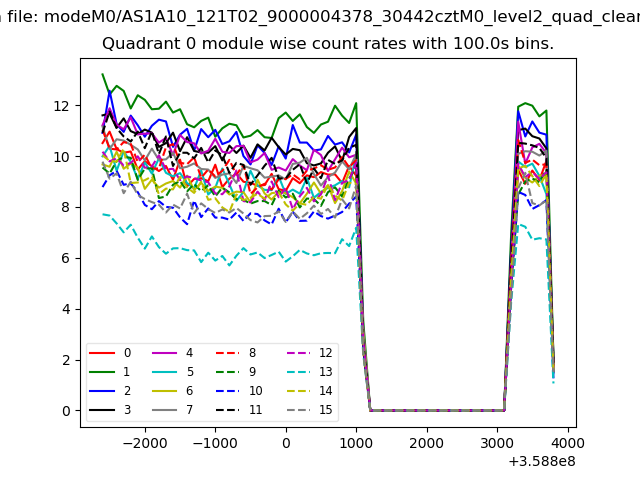 |
 |
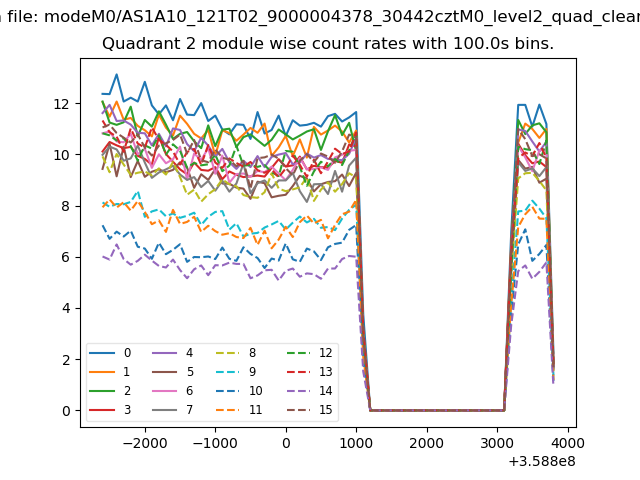
| Module-wise count rates for Quadrant B Data is divided into 100 sec bins |
 |
 |
| Module-wise count rates for Quadrant C Data is divided into 100 sec bins |
 |
 |
| Module-wise count rates for Quadrant D Data is divided into 100 sec bins |
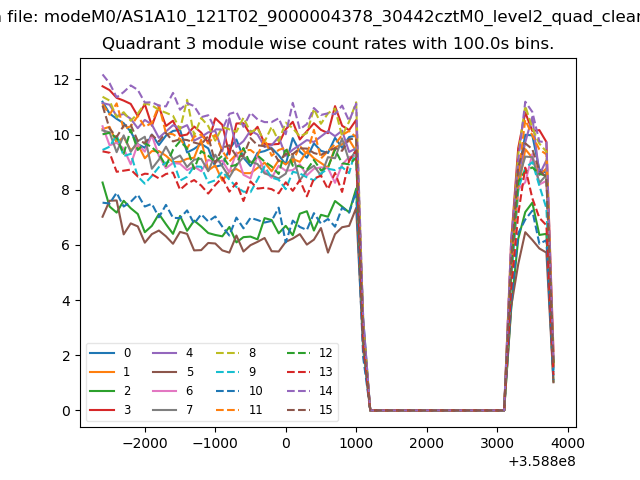 |
 |
| Parameter | Plot |
|---|---|
| CZT HV Monitor | 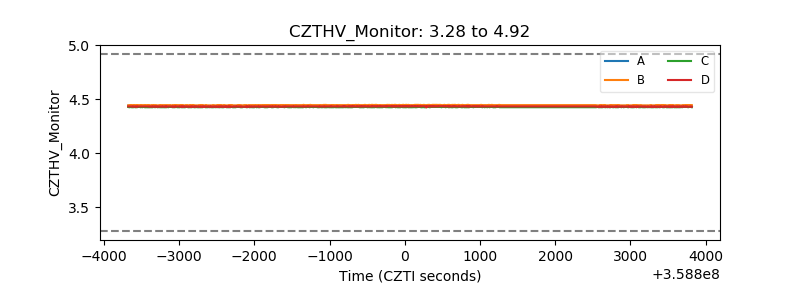 |
| D_VDD | 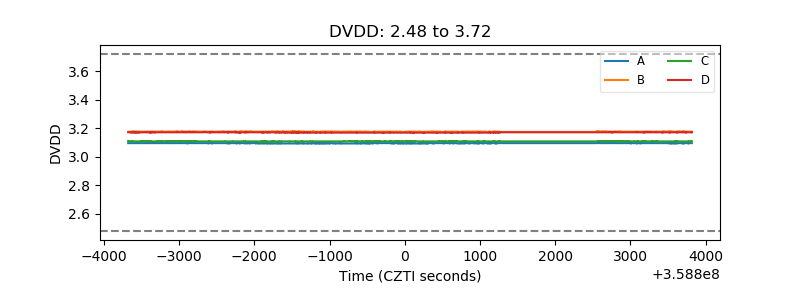 |
| Temperature 1 | 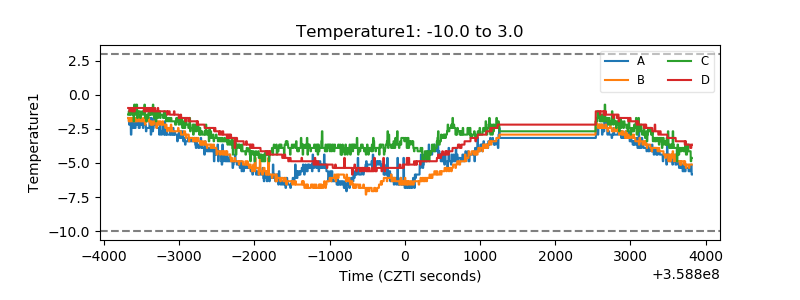 |
| Veto HV Monitor |  |
| Veto LLD | 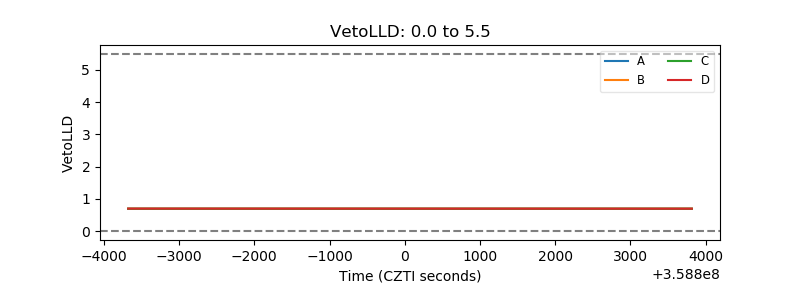 |
| Alpha Counter | 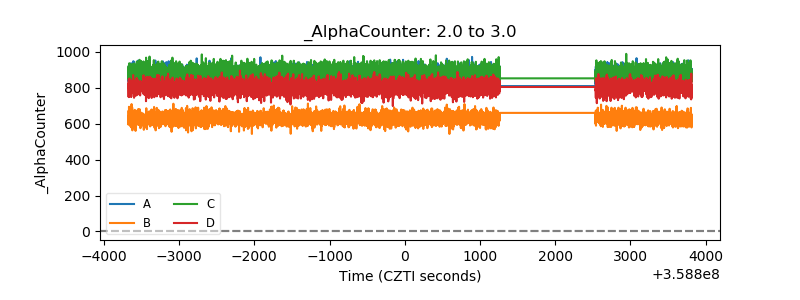 |
| _CPM_Rate | 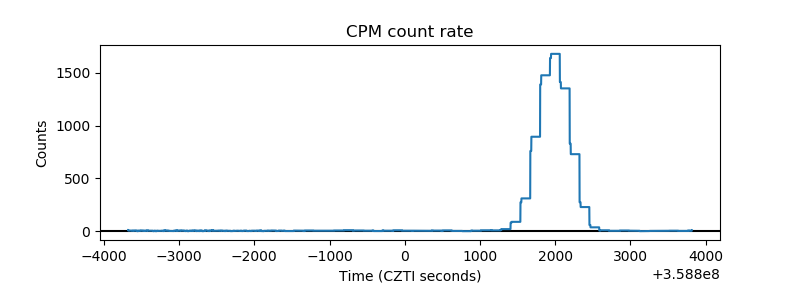 |
| CZT Counter | 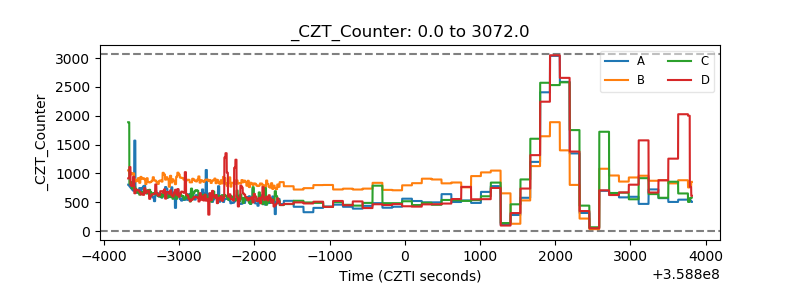 |
| +2.5 Volts monitor |  |
| +5 Volts monitor |  |
| _ROLL_ROT | 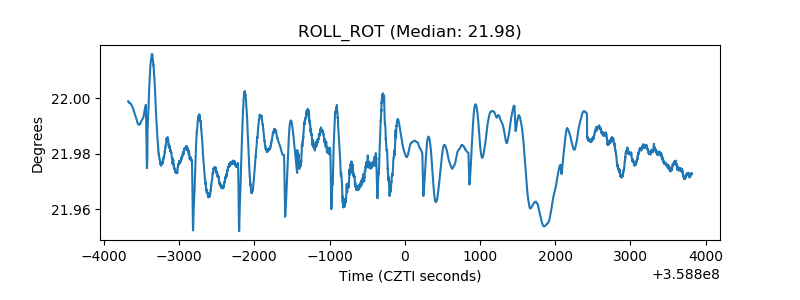 |
| _Roll_DEC | 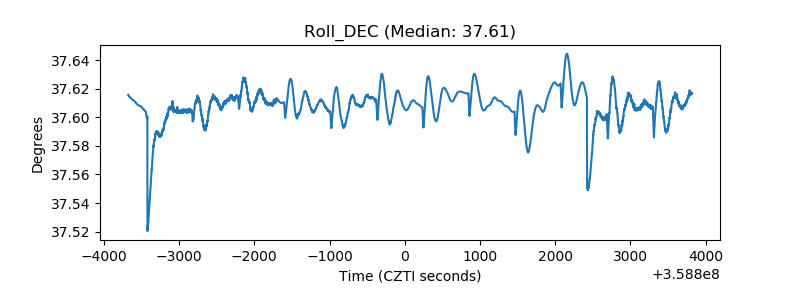 |
| _Roll_RA | 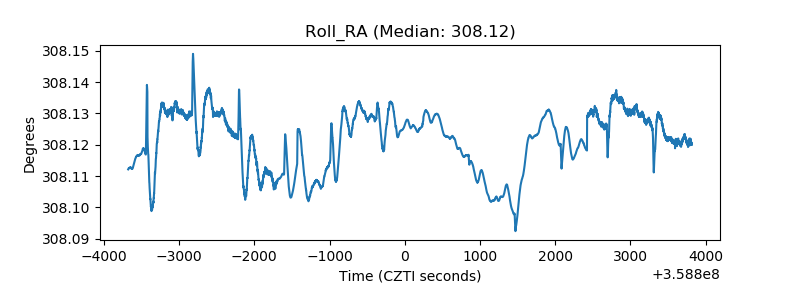 |
| Veto Counter | 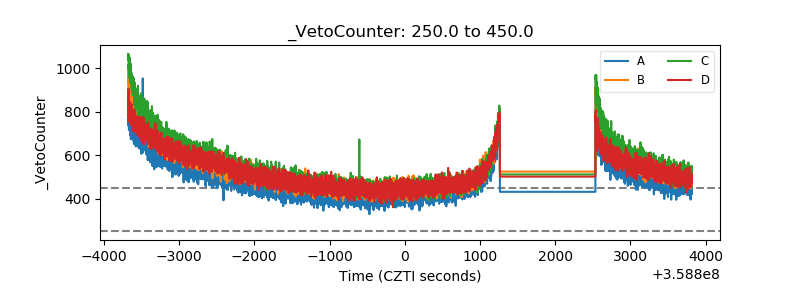 |