| Param | Original file | Final file |
|---|---|---|
| Filename | modeM0/AS1A10_121T02_9000004378_30443cztM0_level2.evt | modeM0/AS1A10_121T02_9000004378_30443cztM0_level2_quad_clean.evt |
| Size (bytes) | 649,154,880 | 99,478,080 |
| Size | 619.1 MB | 94.9 MB |
| Events in quadrant A | 3,353,319 | 668,164 |
| Events in quadrant B | 5,296,188 | 669,821 |
| Events in quadrant C | 3,787,768 | 658,744 |
| Events in quadrant D | 6,783,927 | 563,432 |
| Mode M0 | |||
|---|---|---|---|
| Quadrant | BADHDUFLAG | Total packets | Discarded packets |
| A | 0 | 14016 | 2 |
| B | 0 | 19984 | 2 |
| C | 0 | 15375 | 2 |
| D | 0 | 24615 | 6 |
| Mode SS | |||
|---|---|---|---|
| Quadrant | BADHDUFLAG | Total packets | Discarded packets |
| A | 0 | 132 | 0 |
| B | 0 | 132 | 0 |
| C | 0 | 132 | 0 |
| D | 0 | 132 | 0 |
| Mode M9 | |||
|---|---|---|---|
| Quadrant | BADHDUFLAG | Total packets | Discarded packets |
| A | 0 | 19 | 0 |
| B | 0 | 20 | 0 |
| C | 0 | 20 | 0 |
| D | 0 | 20 | 0 |
| Quadrant | Total seconds | Saturated seconds | Saturation percentage |
|---|---|---|---|
| A | 6478 | 94 | 1.451065% |
| B | 6478 | 144 | 2.222908% |
| C | 6478 | 314 | 4.847175% |
| D | 6477 | 1516 | 23.405898% |
Noise dominated data is calculated using 1-second bins in cleaned event files. If a bin has >2000 counts, and if more than 50% of those come from <1% of pixels, then it is considered to be noise-dominated and hence unusable.
| Quadrant | # 1 sec bins | Bins with >0 counts | Bins with >2000 counts | High rate bins dominated by noise | Noise dominated (total time) | Noise dominated (detector-on time) | Marked lightcurve |
|---|---|---|---|---|---|---|---|
| A | 7568 | 6478 | 7 | 7 | 0.09% | 0.11% | 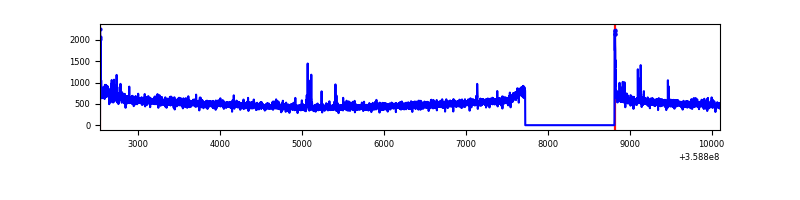 |
| B | 7568 | 6478 | 0 | 0 | 0.00% | 0.00% | 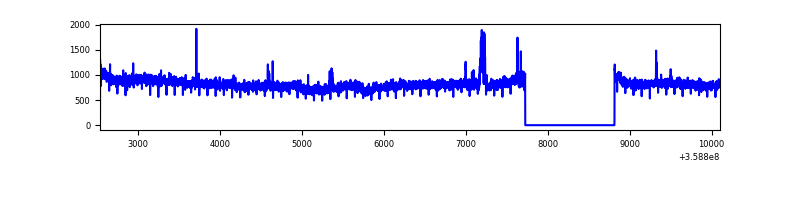 |
| C | 7568 | 6478 | 105 | 105 | 1.39% | 1.62% | 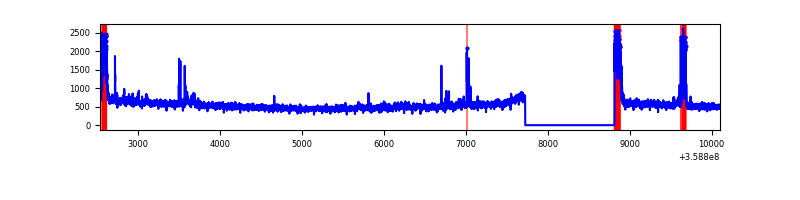 |
| D | 7566 | 6476 | 1220 | 1220 | 16.12% | 18.84% | 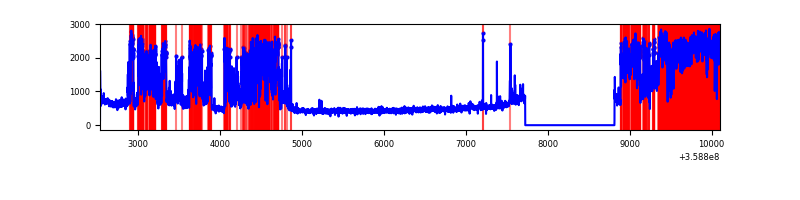 |
Top three noisy pixels from each quadrant. If the there are fewer than three noisy pixels in the level2.evt file, extra rows are filled as -1
| Pixel properties | Quadrant properties | ||||||
|---|---|---|---|---|---|---|---|
| Quadrant | DetID | PixID | Counts | Sigma | Mean | Median | Sigma |
| A | 0 | 13 | 75869 | 448.29 | 840 | 824 | 167.4 |
| A | 8 | 192 | 24214 | 139.72 | 840 | 824 | 167.4 |
| A | 13 | 254 | 11770 | 65.39 | 840 | 824 | 167.4 |
| B | 6 | 159 | 1895865 | 11970.35 | 836 | 817 | 158.3 |
| B | 15 | 33 | 45426 | 281.78 | 836 | 817 | 158.3 |
| B | 0 | 229 | 41551 | 257.3 | 836 | 817 | 158.3 |
| C | 0 | 10 | 257415 | 1365.81 | 809 | 815 | 187.9 |
| C | 14 | 238 | 131880 | 697.62 | 809 | 815 | 187.9 |
| C | 3 | 233 | 120888 | 639.12 | 809 | 815 | 187.9 |
| D | 13 | 104 | 3379666 | 17757.41 | 740 | 727 | 190.3 |
| D | 13 | 249 | 300623 | 1576.05 | 740 | 727 | 190.3 |
| D | 8 | 195 | 146606 | 766.64 | 740 | 727 | 190.3 |
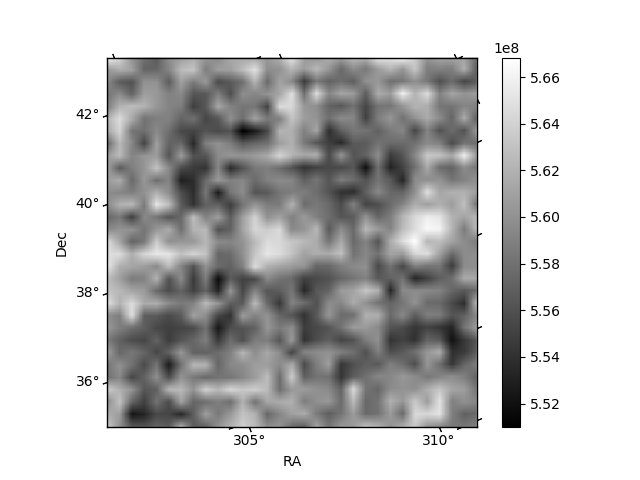
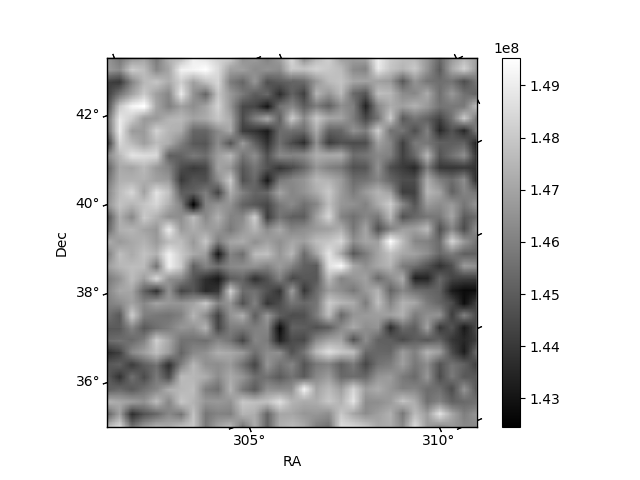
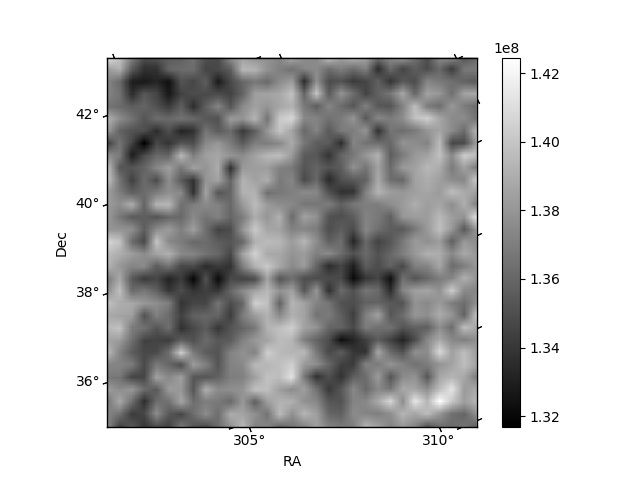
Histogram calculated using DETX and DETY for each event in the final _common_clean file
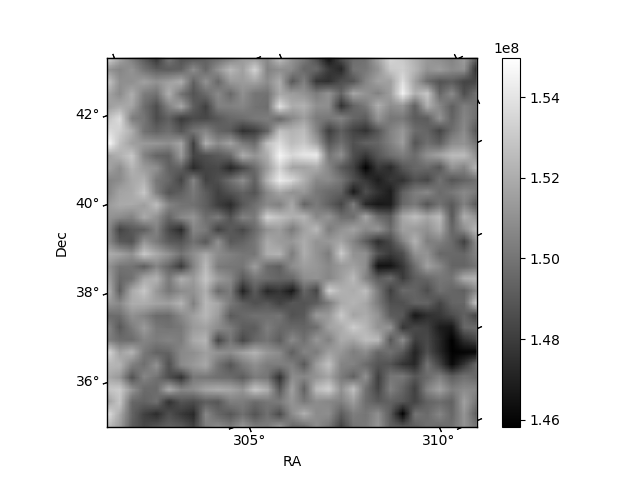
| Quadrant A | 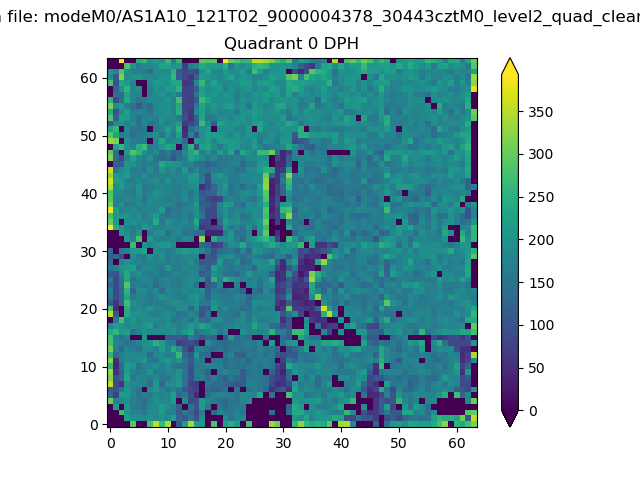 |
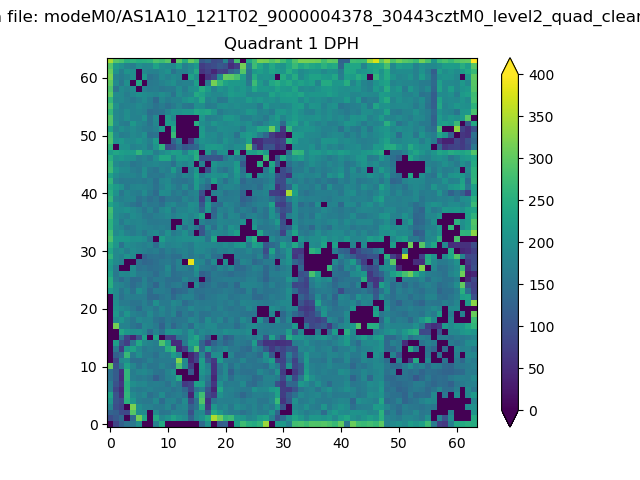 |
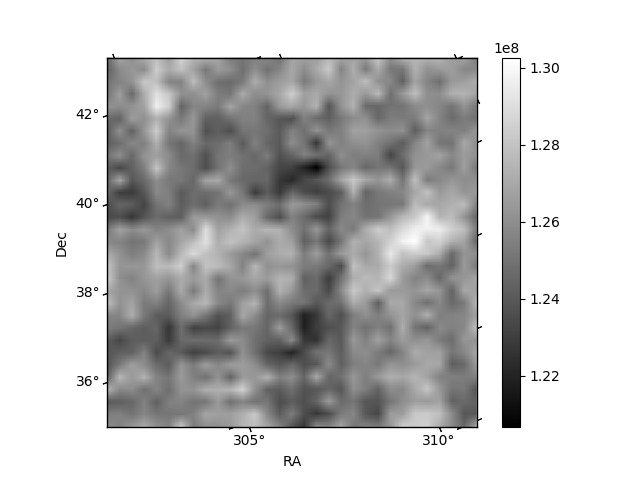
Quadrant B |
|---|---|---|---|
| Quadrant D |  |
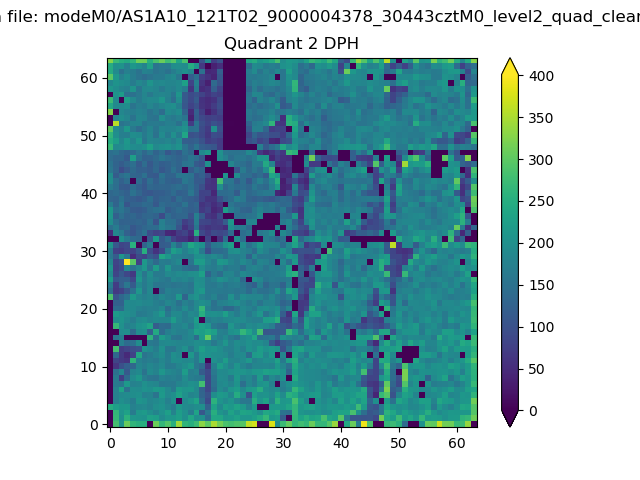 |
Quadrant C |
| Plot type | Count rate plots | Images |
|---|---|---|
| Comparison with Poisson distribution Blue bars denote a histogram of data divided into 1 sec bins. Red curve is a Poisson curve with rate = median count rate of data. |
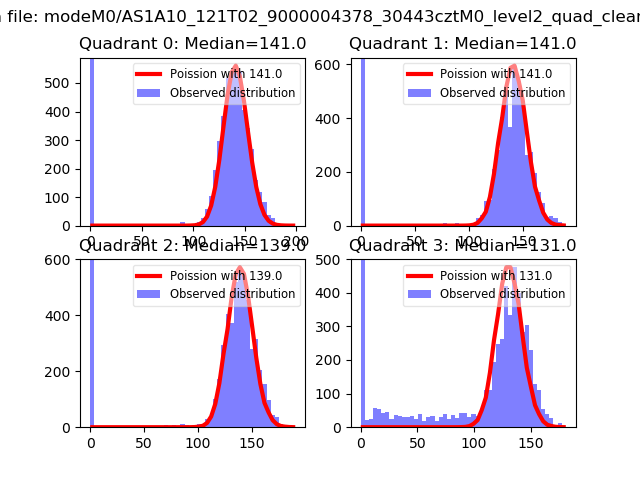 |
 |
| Quadrant-wise count rates Data is divided into 100 sec bins |
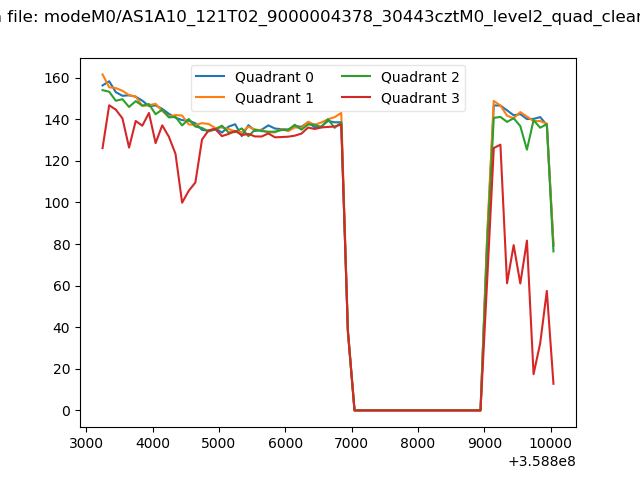 |
|
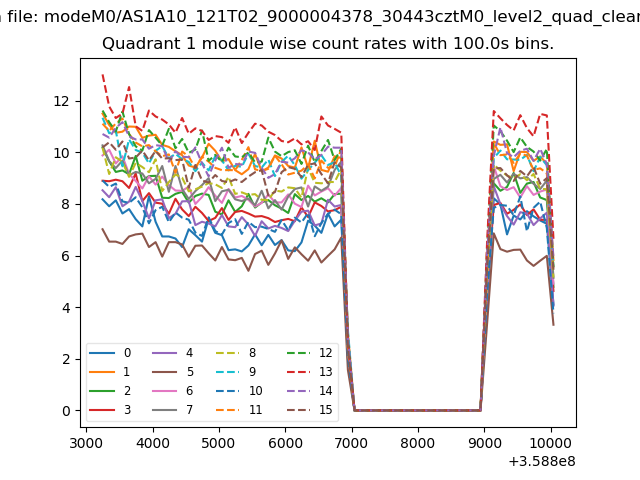
| Module-wise count rates for Quadrant A Data is divided into 100 sec bins |
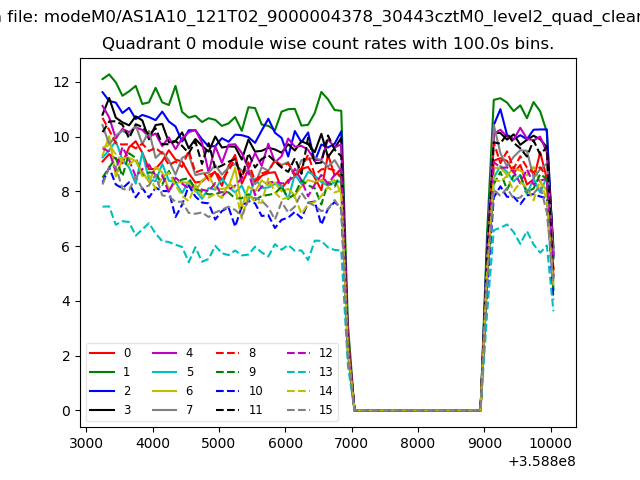 |
 |
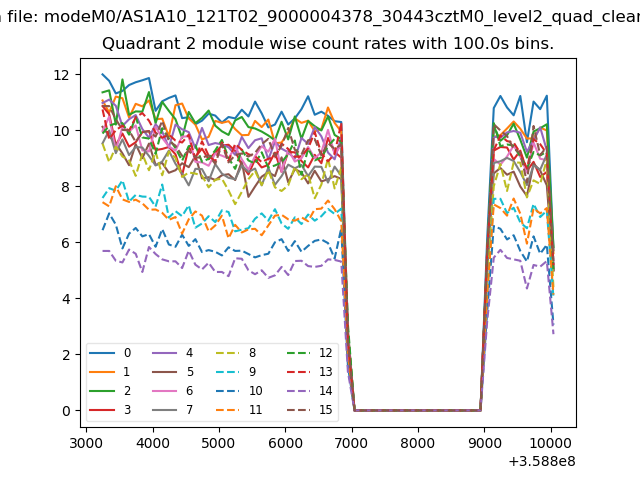
| Module-wise count rates for Quadrant B Data is divided into 100 sec bins |
 |
 |
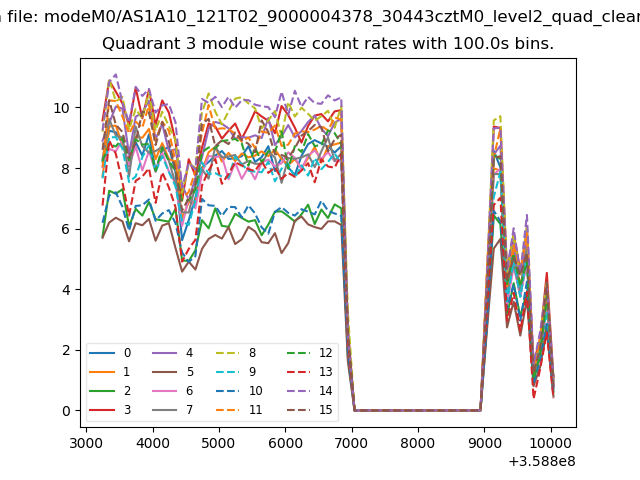
| Module-wise count rates for Quadrant C Data is divided into 100 sec bins |
 |
 |
| Module-wise count rates for Quadrant D Data is divided into 100 sec bins |
 |
 |
| Parameter | Plot |
|---|---|
| CZT HV Monitor |  |
| D_VDD | 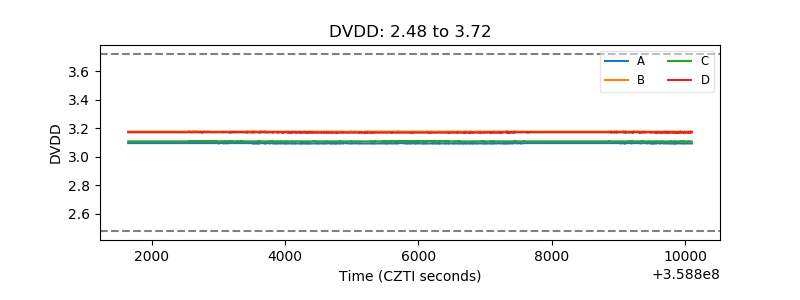 |
| Temperature 1 | 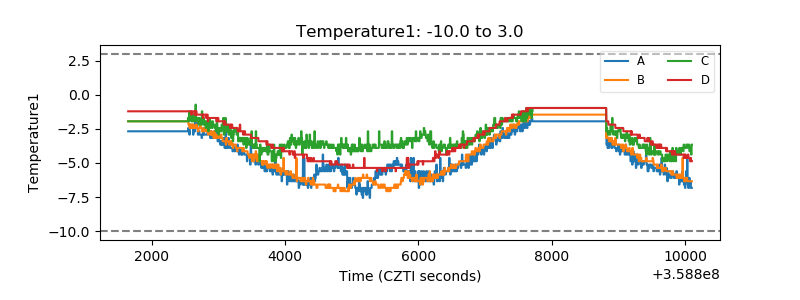 |
| Veto HV Monitor | 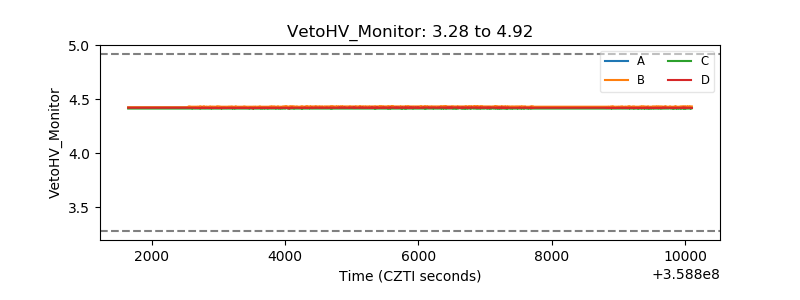 |
| Veto LLD | 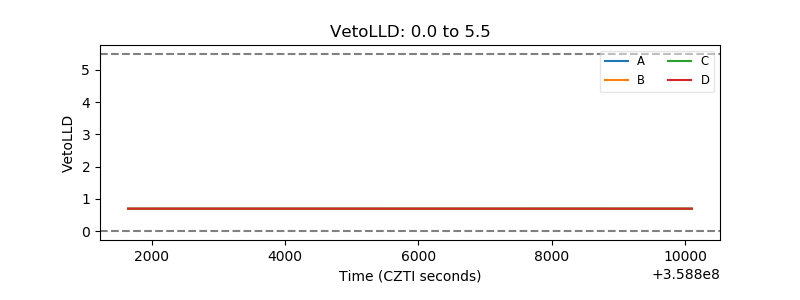 |
| Alpha Counter | 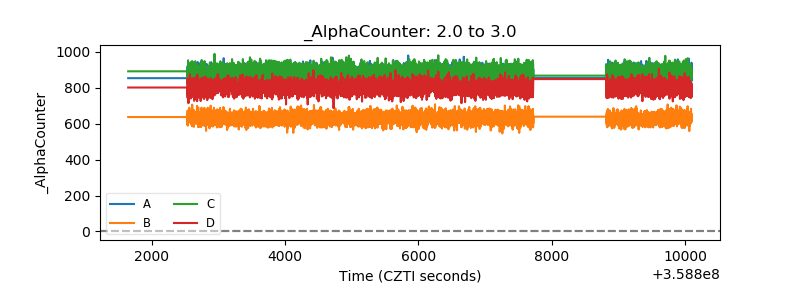 |
| _CPM_Rate | 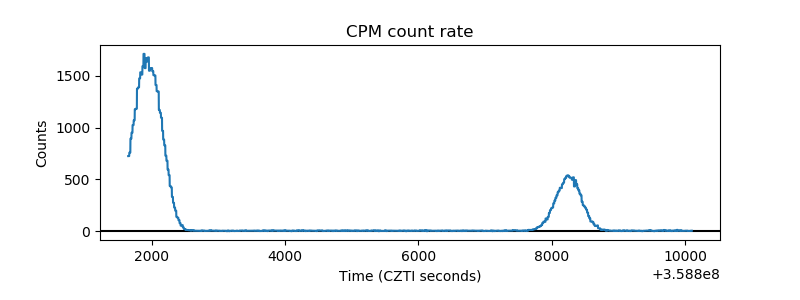 |
| CZT Counter | 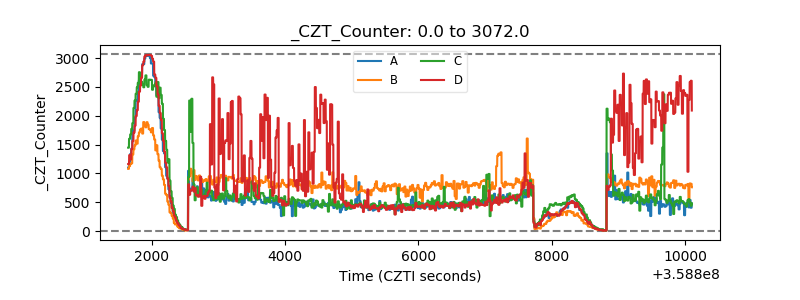 |
| +2.5 Volts monitor |  |
| +5 Volts monitor | 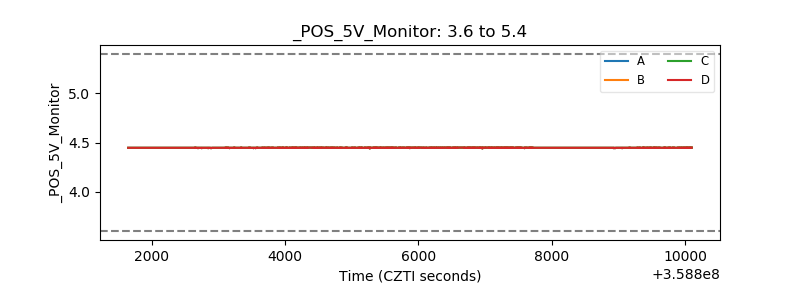 |
| _ROLL_ROT | 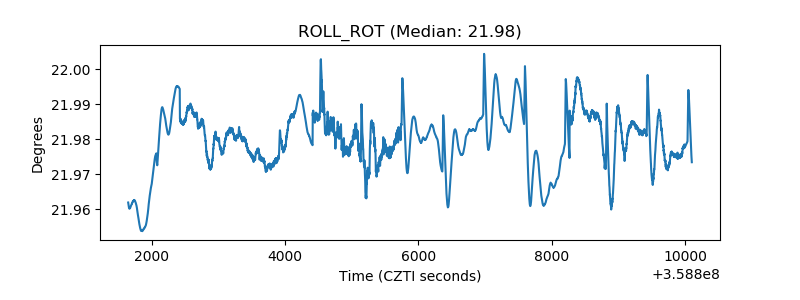 |
| _Roll_DEC | 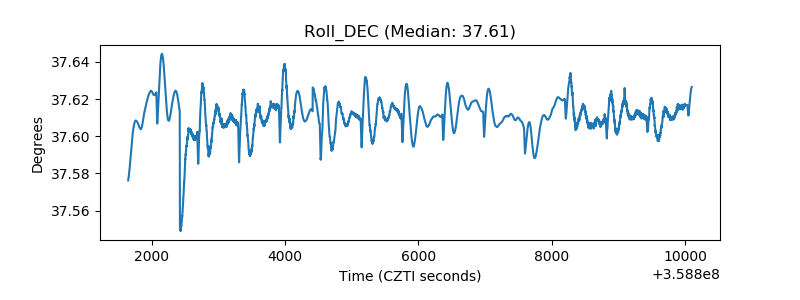 |
| _Roll_RA | 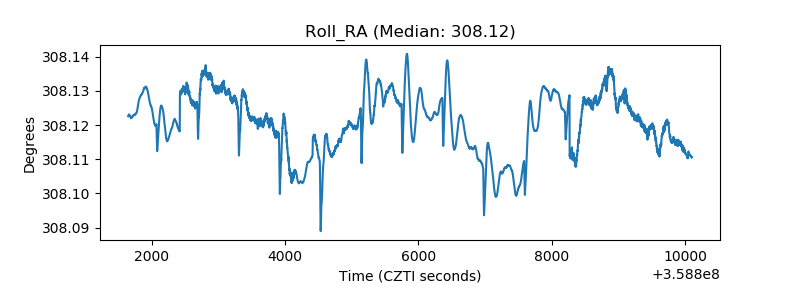 |
| Veto Counter | 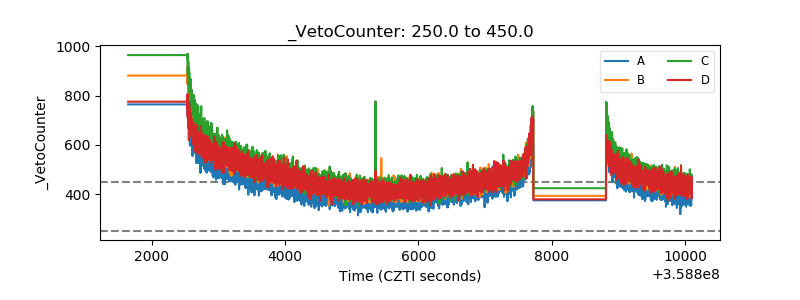 |