| Param | Original file | Final file |
|---|---|---|
| Filename | modeM0/AS1A10_121T02_9000004378_30444cztM0_level2.evt | modeM0/AS1A10_121T02_9000004378_30444cztM0_level2_quad_clean.evt |
| Size (bytes) | 637,943,040 | 100,825,920 |
| Size | 608.4 MB | 96.2 MB |
| Events in quadrant A | 3,381,437 | 685,010 |
| Events in quadrant B | 5,423,717 | 689,378 |
| Events in quadrant C | 3,561,629 | 672,464 |
| Events in quadrant D | 6,494,198 | 533,447 |
| Mode M0 | |||
|---|---|---|---|
| Quadrant | BADHDUFLAG | Total packets | Discarded packets |
| A | 0 | 14426 | 1 |
| B | 0 | 20856 | 1 |
| C | 0 | 14870 | 1 |
| D | 0 | 23927 | 1 |
| Mode SS | |||
|---|---|---|---|
| Quadrant | BADHDUFLAG | Total packets | Discarded packets |
| A | 0 | 138 | 0 |
| B | 0 | 138 | 0 |
| C | 0 | 138 | 0 |
| D | 0 | 138 | 0 |
| Mode M9 | |||
|---|---|---|---|
| Quadrant | BADHDUFLAG | Total packets | Discarded packets |
| A | 0 | 7 | 0 |
| B | 0 | 7 | 0 |
| C | 0 | 7 | 0 |
| D | 0 | 7 | 0 |
| Quadrant | Total seconds | Saturated seconds | Saturation percentage |
|---|---|---|---|
| A | 6778 | 56 | 0.826202% |
| B | 6778 | 142 | 2.095013% |
| C | 6778 | 185 | 2.729419% |
| D | 6778 | 1570 | 23.163175% |
Noise dominated data is calculated using 1-second bins in cleaned event files. If a bin has >2000 counts, and if more than 50% of those come from <1% of pixels, then it is considered to be noise-dominated and hence unusable.
| Quadrant | # 1 sec bins | Bins with >0 counts | Bins with >2000 counts | High rate bins dominated by noise | Noise dominated (total time) | Noise dominated (detector-on time) | Marked lightcurve |
|---|---|---|---|---|---|---|---|
| A | 7477 | 6777 | 3 | 3 | 0.04% | 0.04% | 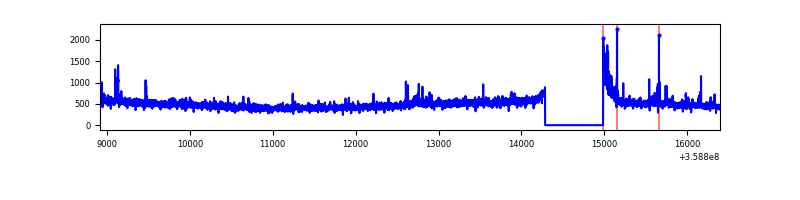 |
| B | 7477 | 6777 | 12 | 12 | 0.16% | 0.18% | 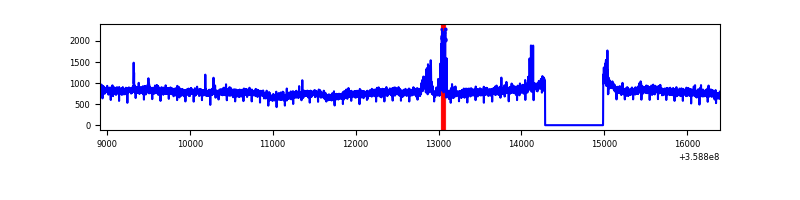 |
| C | 7477 | 6777 | 33 | 33 | 0.44% | 0.49% | 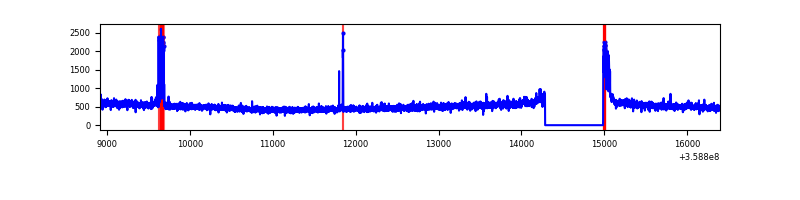 |
| D | 7477 | 6777 | 1296 | 1296 | 17.33% | 19.12% | 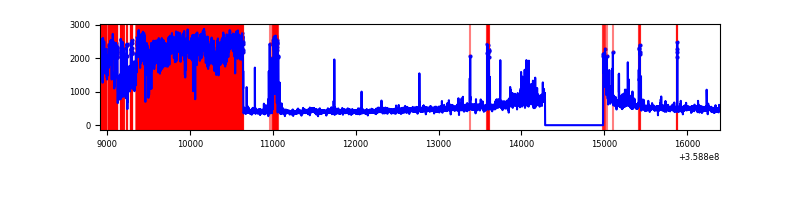 |
Top three noisy pixels from each quadrant. If the there are fewer than three noisy pixels in the level2.evt file, extra rows are filled as -1
| Pixel properties | Quadrant properties | ||||||
|---|---|---|---|---|---|---|---|
| Quadrant | DetID | PixID | Counts | Sigma | Mean | Median | Sigma |
| A | 4 | 2 | 64828 | 380.59 | 837 | 822 | 168.2 |
| A | 0 | 13 | 54239 | 317.63 | 837 | 822 | 168.2 |
| A | 14 | 239 | 23561 | 135.21 | 837 | 822 | 168.2 |
| B | 6 | 159 | 1966956 | 12441.54 | 832 | 811 | 158.0 |
| B | 15 | 33 | 90017 | 564.49 | 832 | 811 | 158.0 |
| B | 0 | 229 | 58197 | 363.13 | 832 | 811 | 158.0 |
| C | 14 | 238 | 130930 | 686.18 | 809 | 816 | 189.6 |
| C | 0 | 10 | 87500 | 457.14 | 809 | 816 | 189.6 |
| C | 3 | 233 | 85644 | 447.36 | 809 | 816 | 189.6 |
| D | 13 | 104 | 3420833 | 18353.12 | 696 | 683 | 186.4 |
| D | 8 | 195 | 148940 | 795.57 | 696 | 683 | 186.4 |
| D | 2 | 250 | 125169 | 668.01 | 696 | 683 | 186.4 |
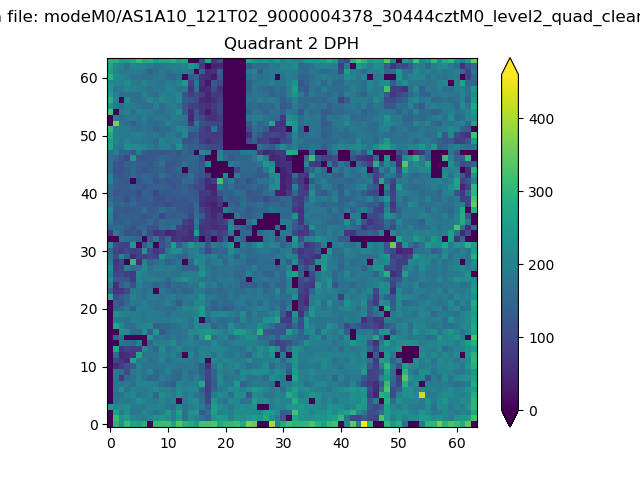
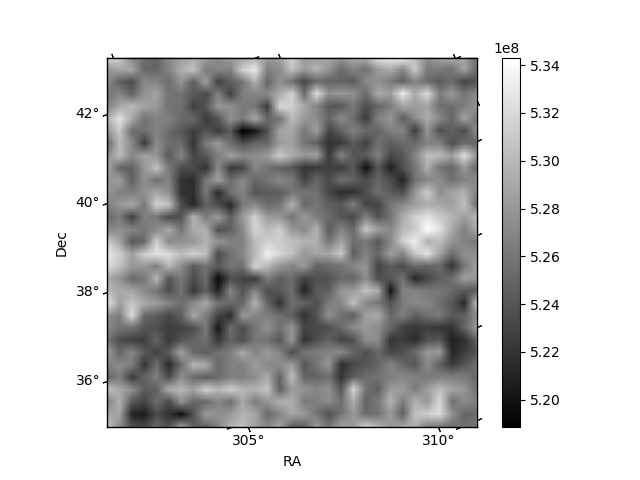
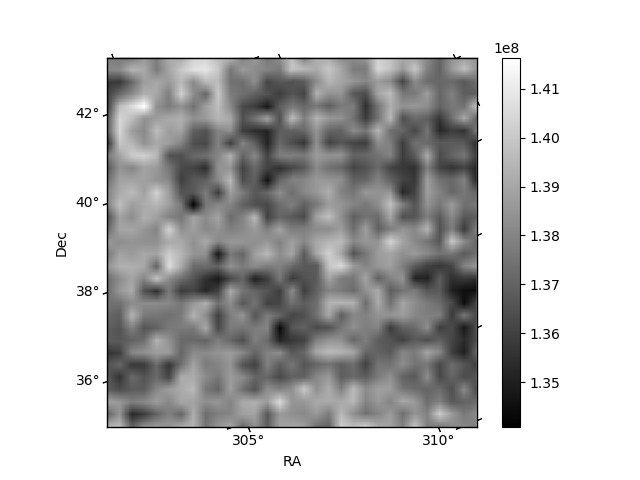
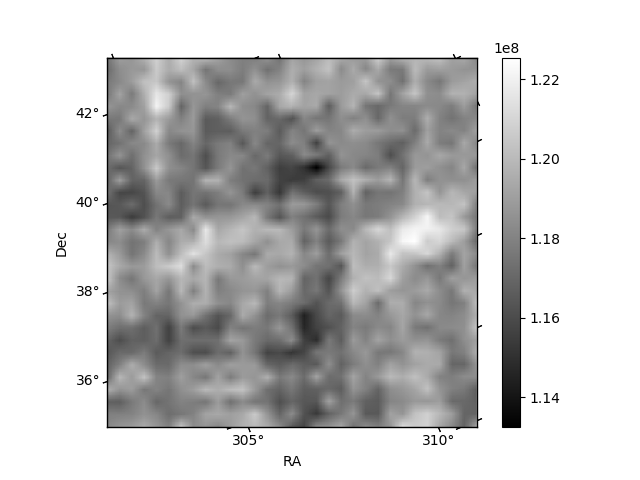
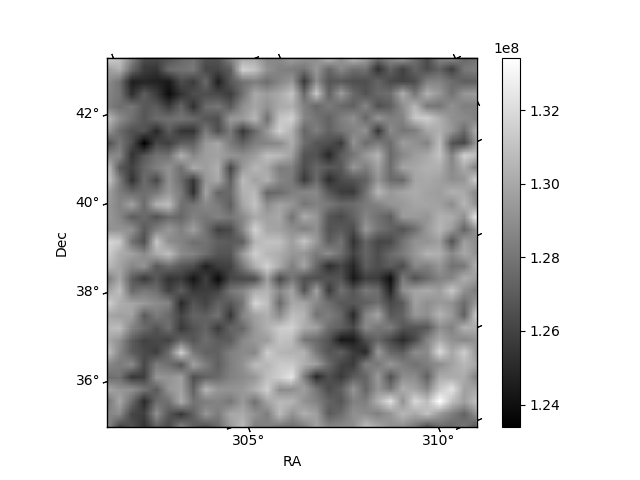
Histogram calculated using DETX and DETY for each event in the final _common_clean file
| Quadrant A | 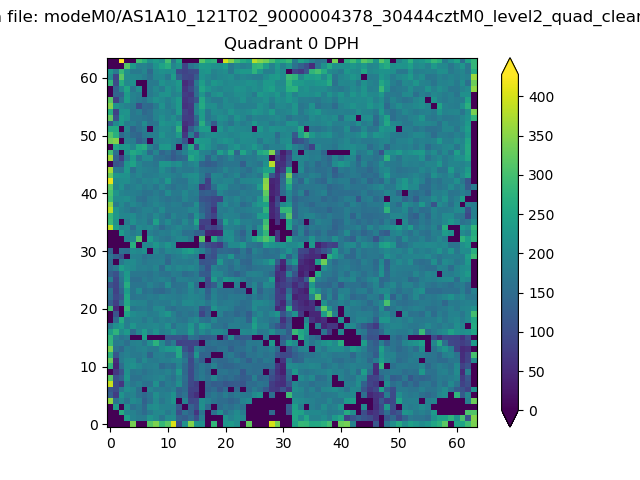 |
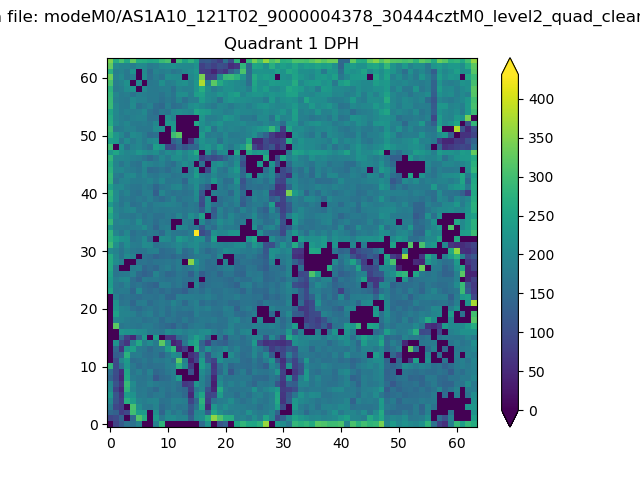 |
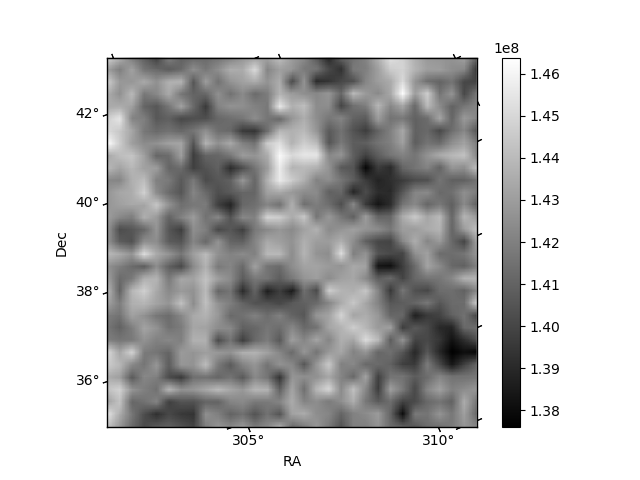
Quadrant B |
|---|---|---|---|
| Quadrant D | 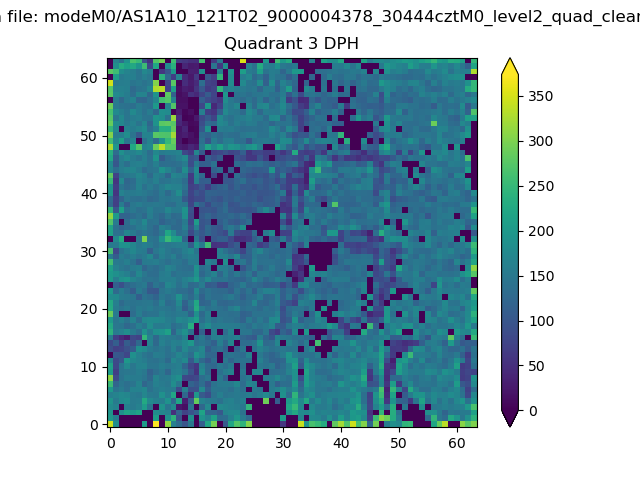 |
 |
Quadrant C |
| Plot type | Count rate plots | Images |
|---|---|---|
| Comparison with Poisson distribution Blue bars denote a histogram of data divided into 1 sec bins. Red curve is a Poisson curve with rate = median count rate of data. |
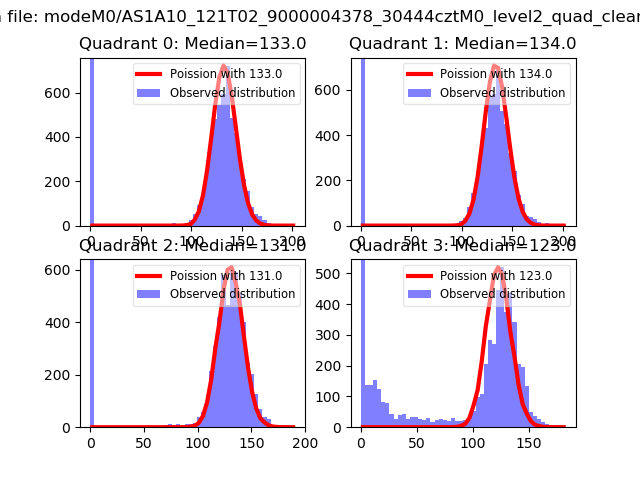 |
 |
| Quadrant-wise count rates Data is divided into 100 sec bins |
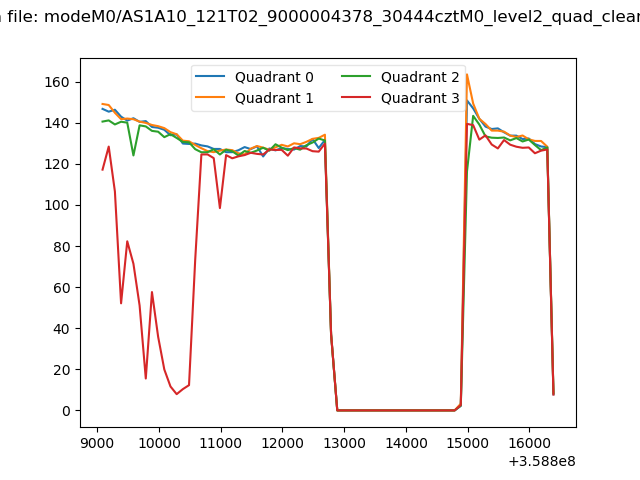 |
|
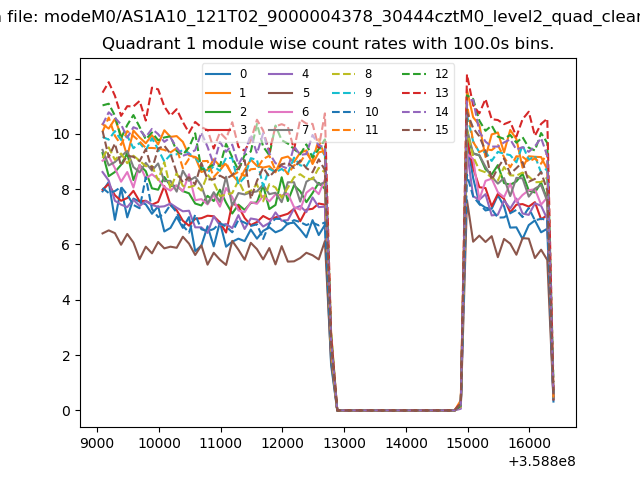
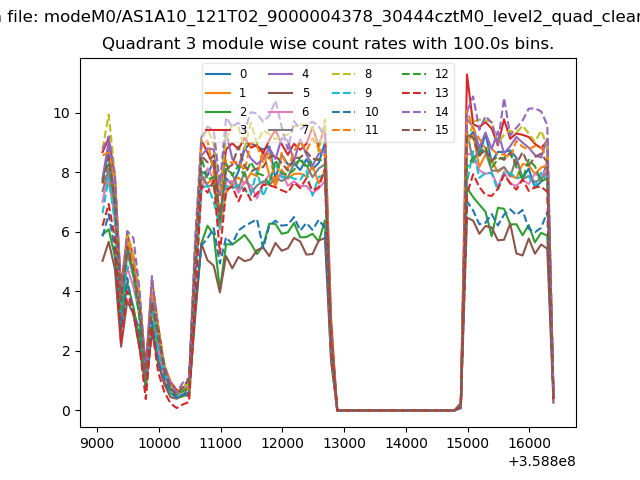
| Module-wise count rates for Quadrant A Data is divided into 100 sec bins |
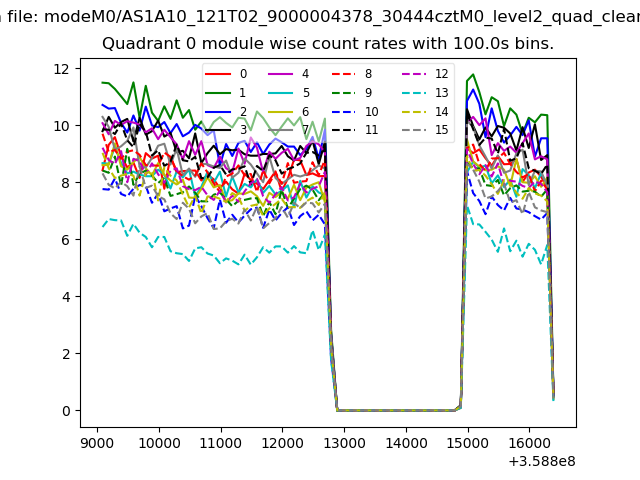 |
 |
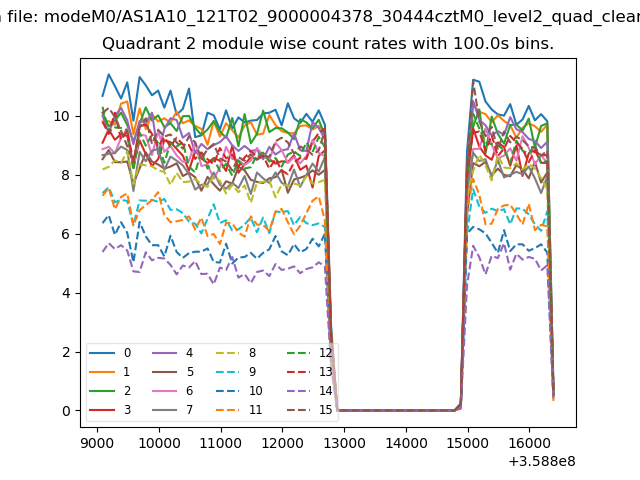
| Module-wise count rates for Quadrant B Data is divided into 100 sec bins |
 |
 |
| Module-wise count rates for Quadrant C Data is divided into 100 sec bins |
 |
 |
| Module-wise count rates for Quadrant D Data is divided into 100 sec bins |
 |
 |
| Parameter | Plot |
|---|---|
| CZT HV Monitor | 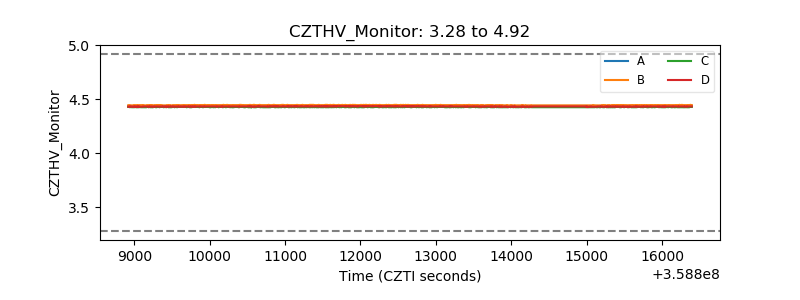 |
| D_VDD | 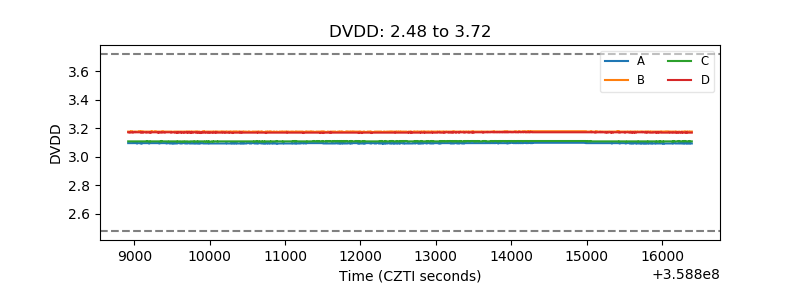 |
| Temperature 1 |  |
| Veto HV Monitor |  |
| Veto LLD | 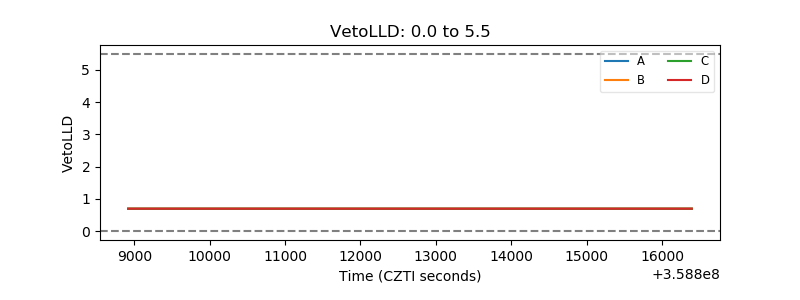 |
| Alpha Counter | 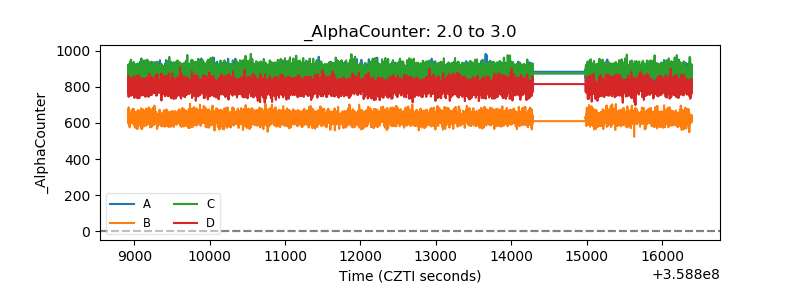 |
| _CPM_Rate | 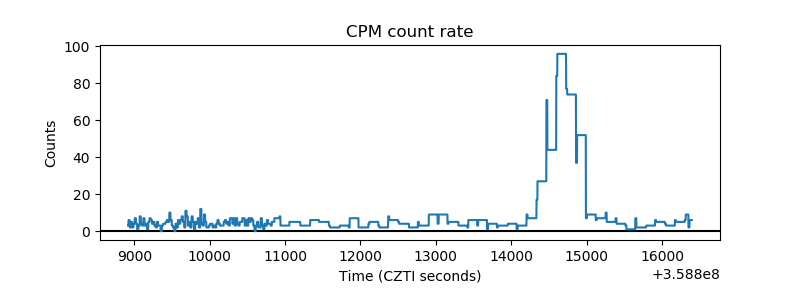 |
| CZT Counter | 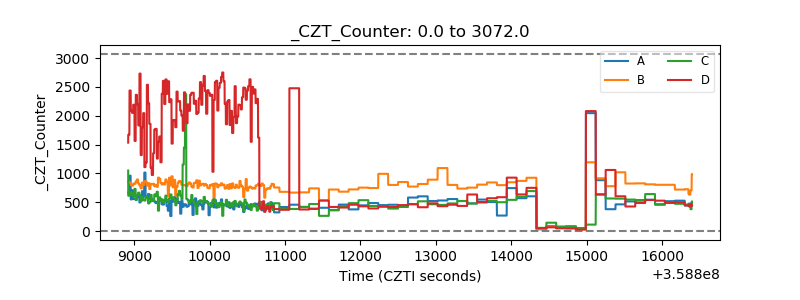 |
| +2.5 Volts monitor |  |
| +5 Volts monitor |  |
| _ROLL_ROT | 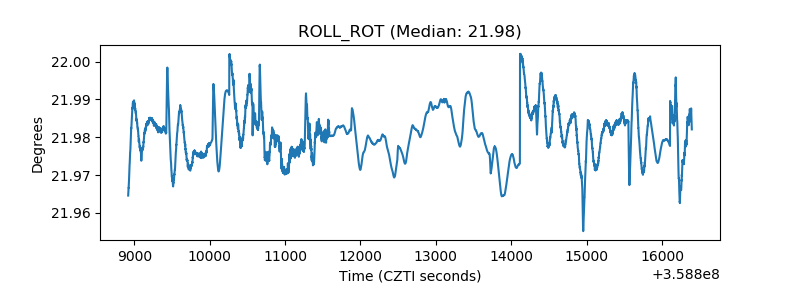 |
| _Roll_DEC | 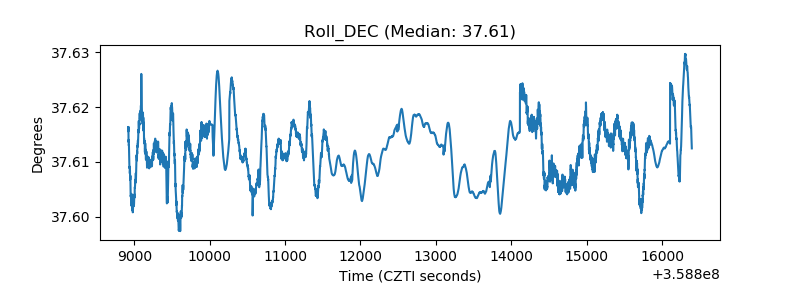 |
| _Roll_RA | 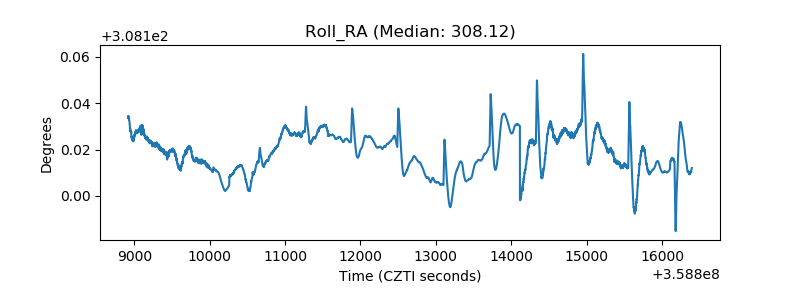 |
| Veto Counter | 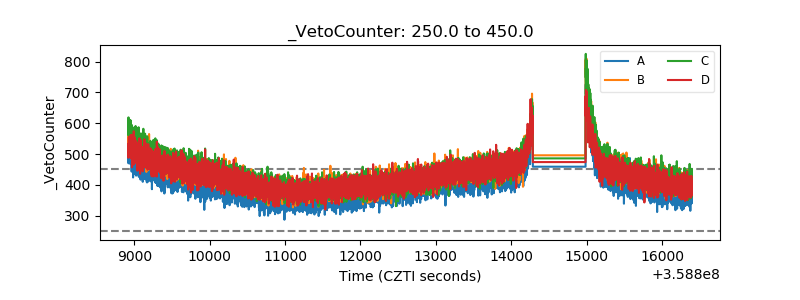 |