| Param | Original file | Final file |
|---|---|---|
| Filename | modeM0/AS1A10_121T02_9000004378_30445cztM0_level2.evt | modeM0/AS1A10_121T02_9000004378_30445cztM0_level2_quad_clean.evt |
| Size (bytes) | 723,317,760 | 104,777,280 |
| Size | 689.8 MB | 99.9 MB |
| Events in quadrant A | 4,662,297 | 664,675 |
| Events in quadrant B | 5,936,209 | 688,519 |
| Events in quadrant C | 3,982,635 | 672,997 |
| Events in quadrant D | 6,819,803 | 626,933 |
| Mode M0 | |||
|---|---|---|---|
| Quadrant | BADHDUFLAG | Total packets | Discarded packets |
| A | 0 | 18673 | 2 |
| B | 0 | 22979 | 2 |
| C | 0 | 16688 | 2 |
| D | 0 | 25455 | 2 |
| Mode SS | |||
|---|---|---|---|
| Quadrant | BADHDUFLAG | Total packets | Discarded packets |
| A | 0 | 154 | 0 |
| B | 0 | 154 | 0 |
| C | 0 | 154 | 0 |
| D | 0 | 154 | 0 |
| Mode M9 | |||
|---|---|---|---|
| Quadrant | BADHDUFLAG | Total packets | Discarded packets |
| A | 0 | 10 | 0 |
| B | 0 | 10 | 0 |
| C | 0 | 10 | 0 |
| D | 0 | 10 | 0 |
| Quadrant | Total seconds | Saturated seconds | Saturation percentage |
|---|---|---|---|
| A | 7461 | 347 | 4.650851% |
| B | 7462 | 248 | 3.323506% |
| C | 7462 | 264 | 3.537925% |
| D | 7462 | 1253 | 16.791745% |
Noise dominated data is calculated using 1-second bins in cleaned event files. If a bin has >2000 counts, and if more than 50% of those come from <1% of pixels, then it is considered to be noise-dominated and hence unusable.
| Quadrant | # 1 sec bins | Bins with >0 counts | Bins with >2000 counts | High rate bins dominated by noise | Noise dominated (total time) | Noise dominated (detector-on time) | Marked lightcurve |
|---|---|---|---|---|---|---|---|
| A | 8475 | 7460 | 297 | 297 | 3.50% | 3.98% | 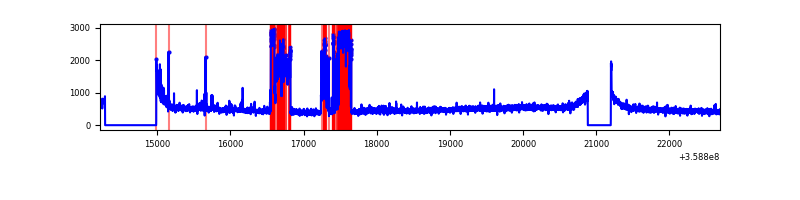 |
| B | 8476 | 7461 | 2 | 2 | 0.02% | 0.03% | 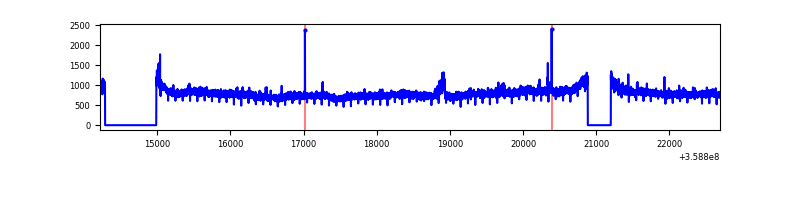 |
| C | 8476 | 7461 | 12 | 12 | 0.14% | 0.16% | 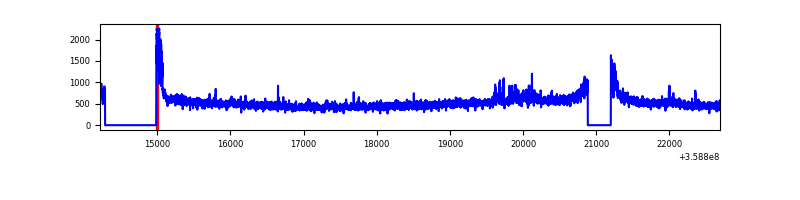 |
| D | 8476 | 7461 | 1030 | 1030 | 12.15% | 13.81% | 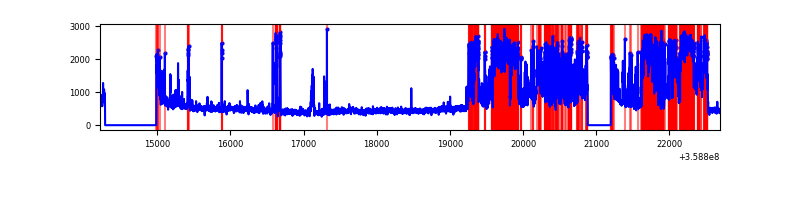 |
Top three noisy pixels from each quadrant. If the there are fewer than three noisy pixels in the level2.evt file, extra rows are filled as -1
| Pixel properties | Quadrant properties | ||||||
|---|---|---|---|---|---|---|---|
| Quadrant | DetID | PixID | Counts | Sigma | Mean | Median | Sigma |
| A | 0 | 13 | 1041261 | 5619.08 | 914 | 895 | 185.1 |
| A | 4 | 2 | 68370 | 364.43 | 914 | 895 | 185.1 |
| A | 8 | 192 | 22266 | 115.42 | 914 | 895 | 185.1 |
| B | 6 | 159 | 2211957 | 12441.2 | 921 | 897 | 177.7 |
| B | 0 | 229 | 40600 | 223.4 | 921 | 897 | 177.7 |
| B | 15 | 33 | 30838 | 168.47 | 921 | 897 | 177.7 |
| C | 3 | 233 | 219705 | 1032.91 | 895 | 901 | 211.8 |
| C | 14 | 238 | 147056 | 689.95 | 895 | 901 | 211.8 |
| C | 0 | 10 | 100763 | 471.42 | 895 | 901 | 211.8 |
| D | 13 | 104 | 3007230 | 13951.89 | 824 | 806 | 215.5 |
| D | 8 | 195 | 211064 | 975.74 | 824 | 806 | 215.5 |
| D | 13 | 249 | 199818 | 923.55 | 824 | 806 | 215.5 |
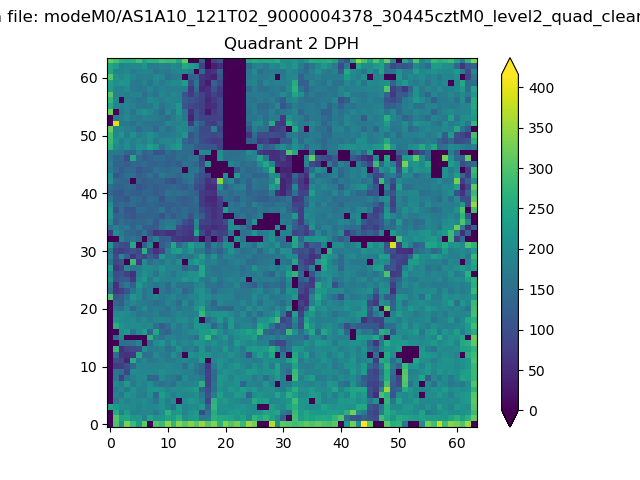
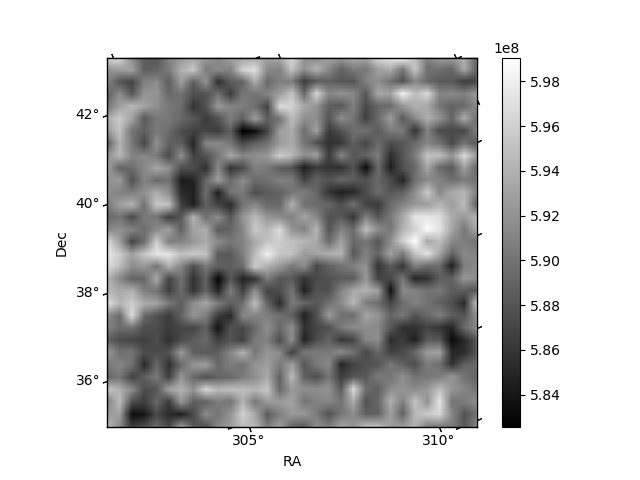
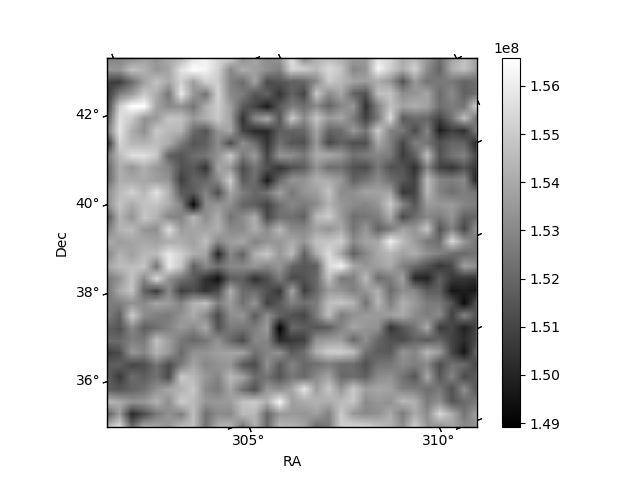
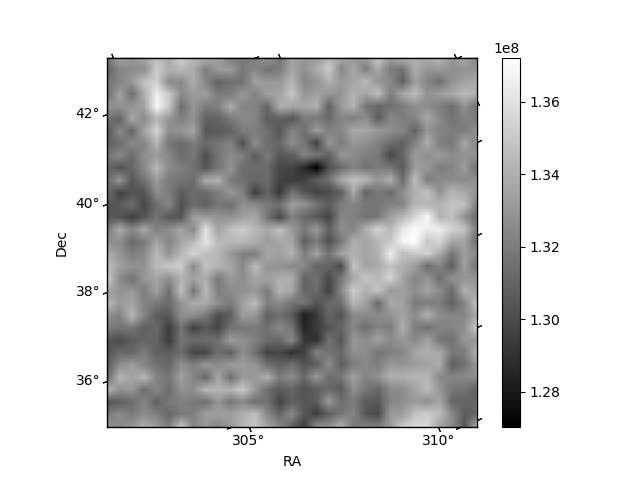
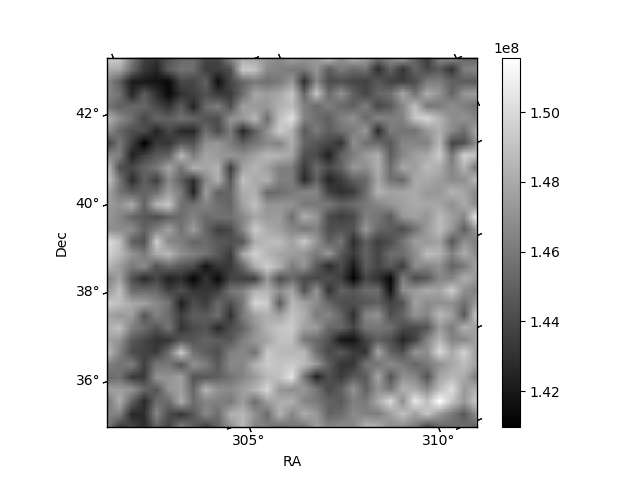
Histogram calculated using DETX and DETY for each event in the final _common_clean file
| Quadrant A | 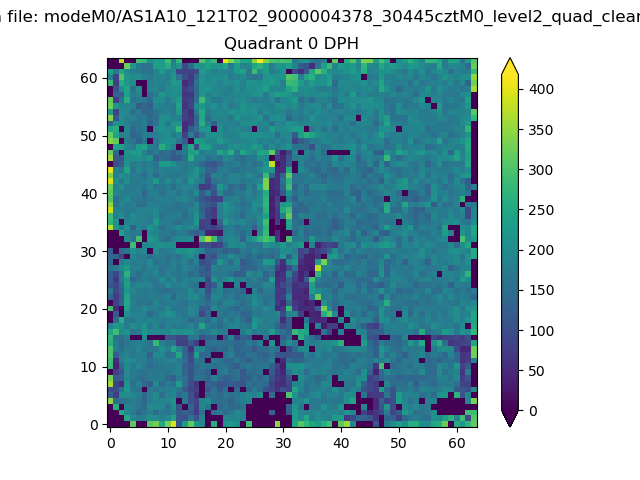 |
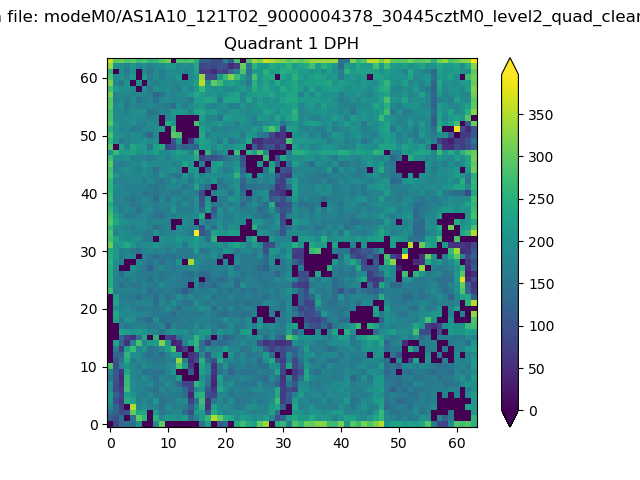 |
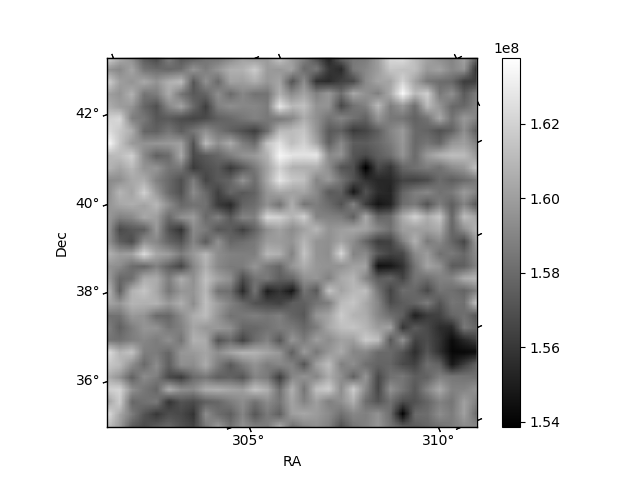
Quadrant B |
|---|---|---|---|
| Quadrant D | 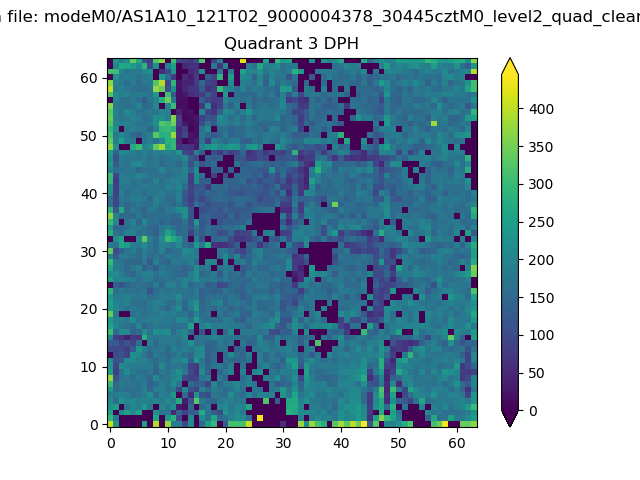 |
 |
Quadrant C |
| Plot type | Count rate plots | Images |
|---|---|---|
| Comparison with Poisson distribution Blue bars denote a histogram of data divided into 1 sec bins. Red curve is a Poisson curve with rate = median count rate of data. |
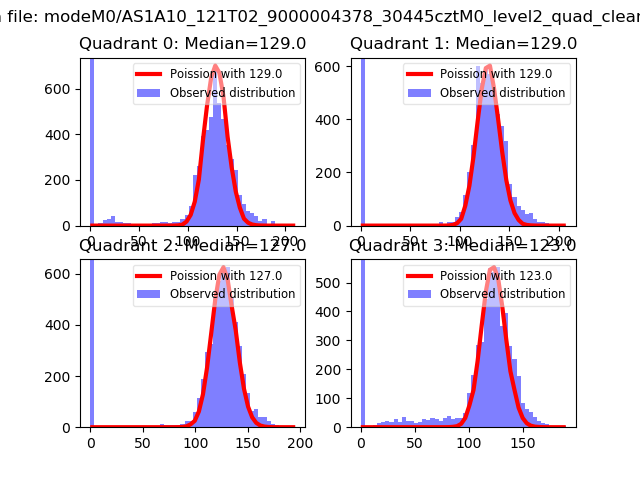 |
 |
| Quadrant-wise count rates Data is divided into 100 sec bins |
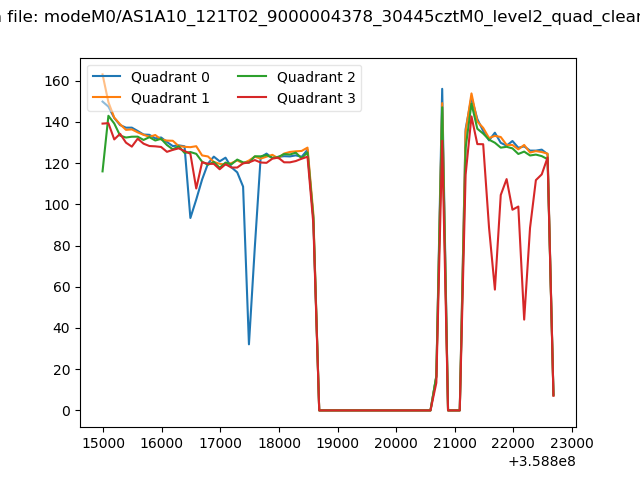 |
|
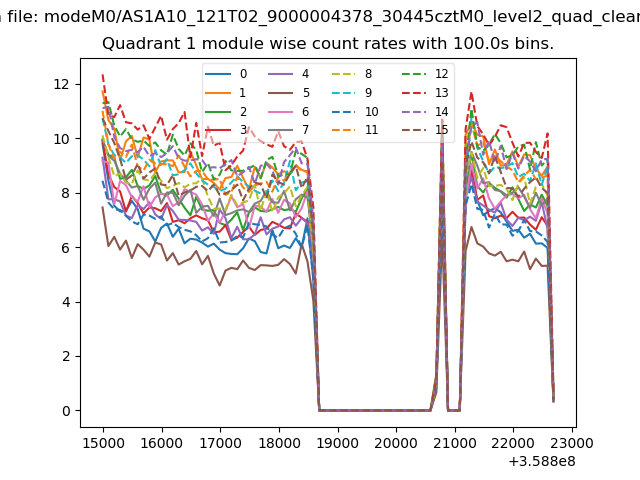
| Module-wise count rates for Quadrant A Data is divided into 100 sec bins |
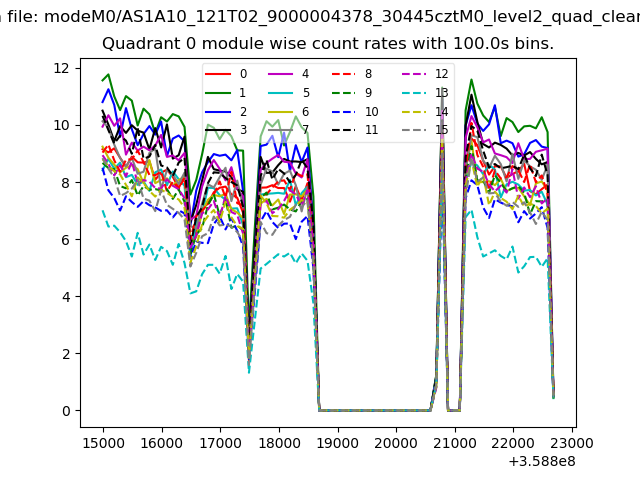 |
 |
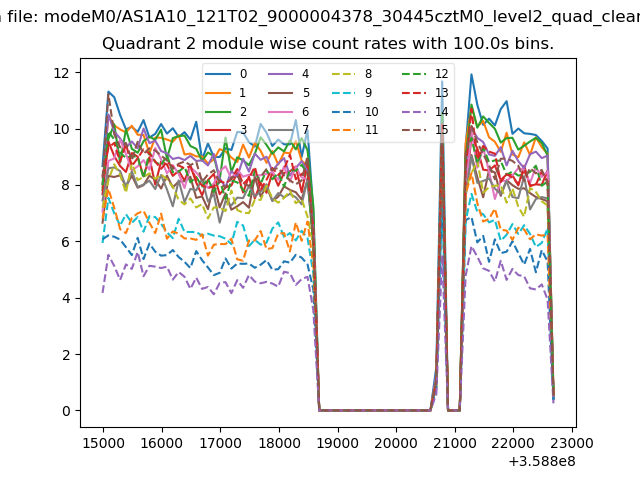
| Module-wise count rates for Quadrant B Data is divided into 100 sec bins |
 |
 |
| Module-wise count rates for Quadrant C Data is divided into 100 sec bins |
 |
 |
| Module-wise count rates for Quadrant D Data is divided into 100 sec bins |
 |
 |
| Parameter | Plot |
|---|---|
| CZT HV Monitor | 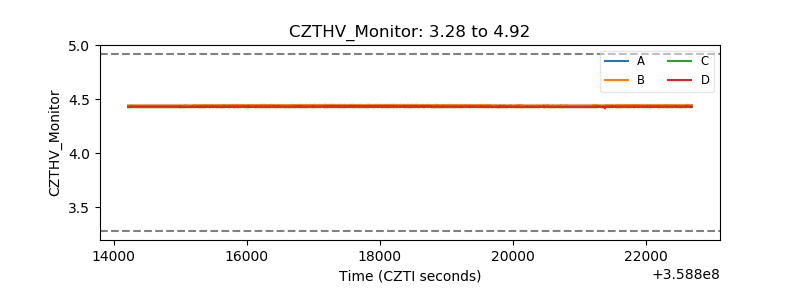 |
| D_VDD | 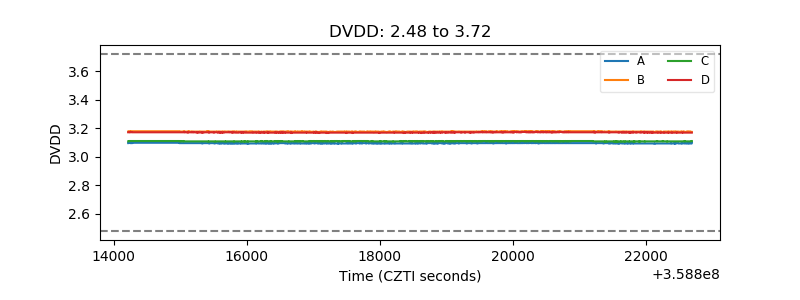 |
| Temperature 1 | 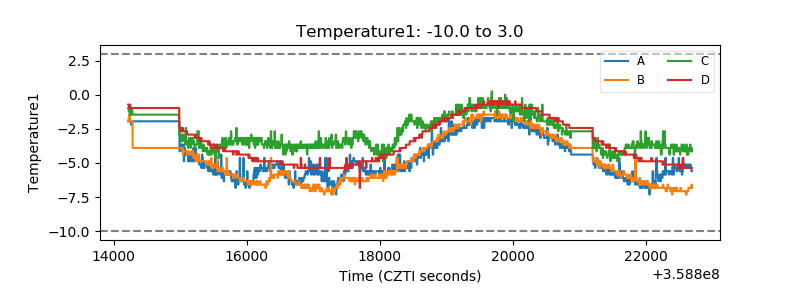 |
| Veto HV Monitor | 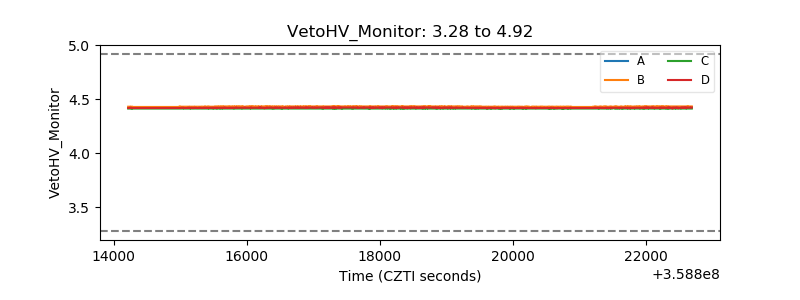 |
| Veto LLD | 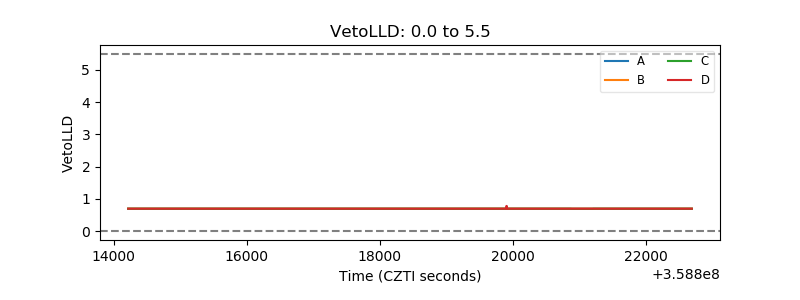 |
| Alpha Counter |  |
| _CPM_Rate | 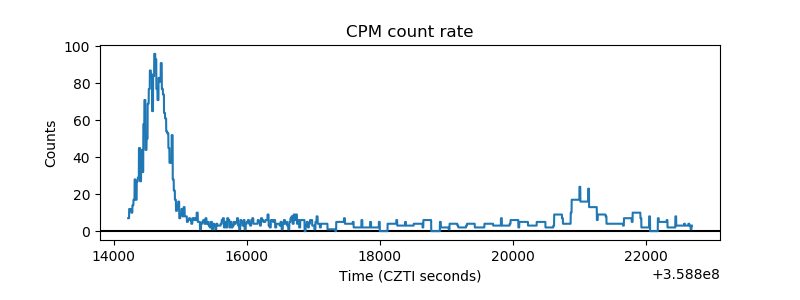 |
| CZT Counter | 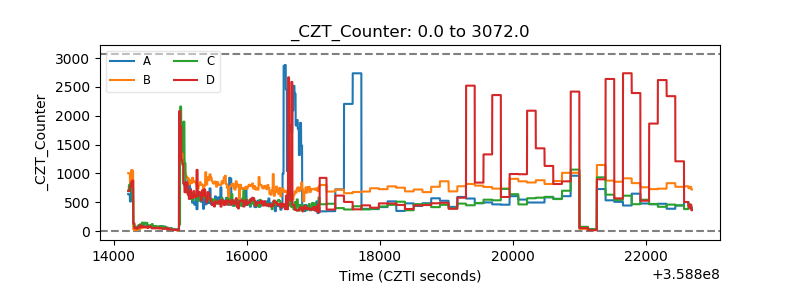 |
| +2.5 Volts monitor |  |
| +5 Volts monitor | 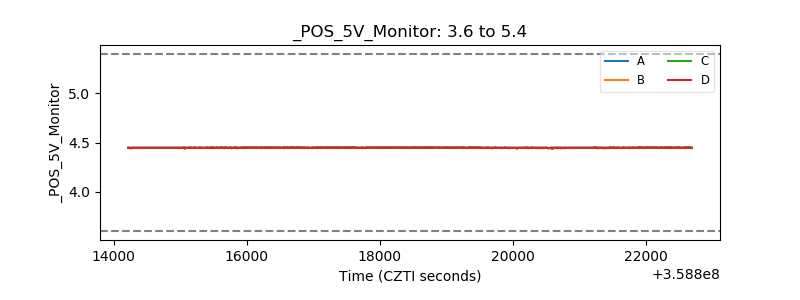 |
| _ROLL_ROT | 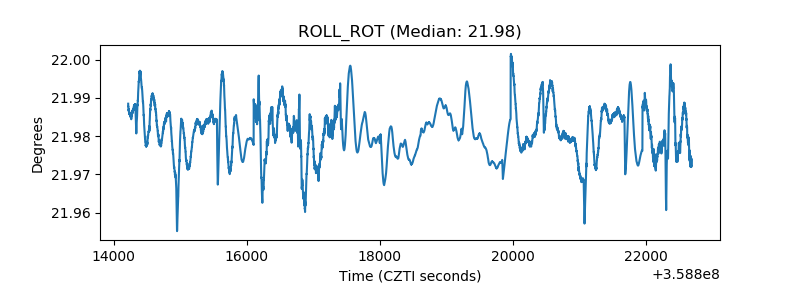 |
| _Roll_DEC | 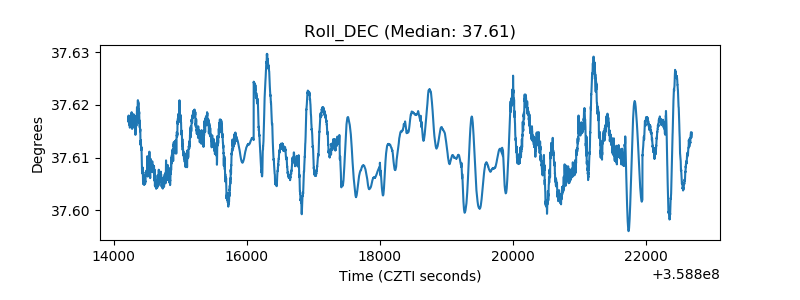 |
| _Roll_RA | 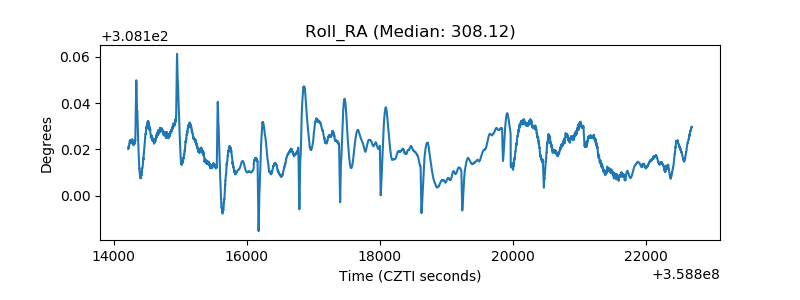 |
| Veto Counter | 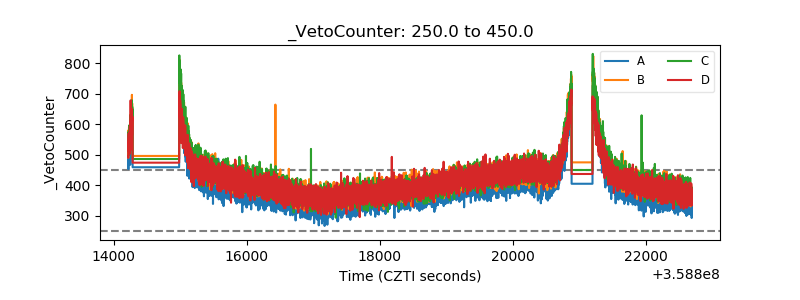 |