| Param | Original file | Final file |
|---|---|---|
| Filename | modeM0/AS1A10_121T02_9000004378_30446cztM0_level2.evt | modeM0/AS1A10_121T02_9000004378_30446cztM0_level2_quad_clean.evt |
| Size (bytes) | 831,375,360 | 107,510,400 |
| Size | 792.9 MB | 102.5 MB |
| Events in quadrant A | 3,856,437 | 726,484 |
| Events in quadrant B | 6,180,219 | 724,119 |
| Events in quadrant C | 4,400,057 | 709,340 |
| Events in quadrant D | 10,213,805 | 552,128 |
| Mode M0 | |||
|---|---|---|---|
| Quadrant | BADHDUFLAG | Total packets | Discarded packets |
| A | 0 | 16765 | 2 |
| B | 0 | 24004 | 2 |
| C | 0 | 18181 | 2 |
| D | 0 | 35906 | 3 |
| Mode SS | |||
|---|---|---|---|
| Quadrant | BADHDUFLAG | Total packets | Discarded packets |
| A | 0 | 162 | 0 |
| B | 0 | 162 | 0 |
| C | 0 | 162 | 0 |
| D | 0 | 162 | 0 |
| Mode M9 | |||
|---|---|---|---|
| Quadrant | BADHDUFLAG | Total packets | Discarded packets |
| A | 0 | 5 | 0 |
| B | 0 | 5 | 0 |
| C | 0 | 5 | 0 |
| D | 0 | 5 | 0 |
| Quadrant | Total seconds | Saturated seconds | Saturation percentage |
|---|---|---|---|
| A | 7801 | 113 | 1.448532% |
| B | 7802 | 291 | 3.729813% |
| C | 7802 | 262 | 3.358113% |
| D | 7801 | 2967 | 38.033585% |
Noise dominated data is calculated using 1-second bins in cleaned event files. If a bin has >2000 counts, and if more than 50% of those come from <1% of pixels, then it is considered to be noise-dominated and hence unusable.
| Quadrant | # 1 sec bins | Bins with >0 counts | Bins with >2000 counts | High rate bins dominated by noise | Noise dominated (total time) | Noise dominated (detector-on time) | Marked lightcurve |
|---|---|---|---|---|---|---|---|
| A | 8366 | 7801 | 0 | 0 | 0.00% | 0.00% | 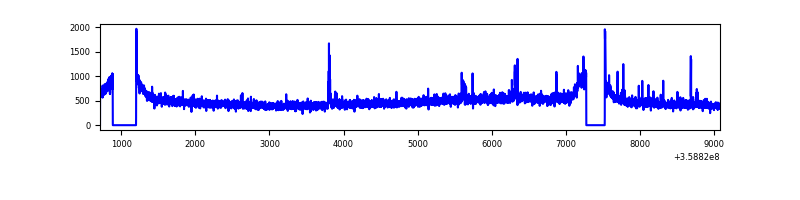 |
| B | 8367 | 7802 | 0 | 0 | 0.00% | 0.00% | 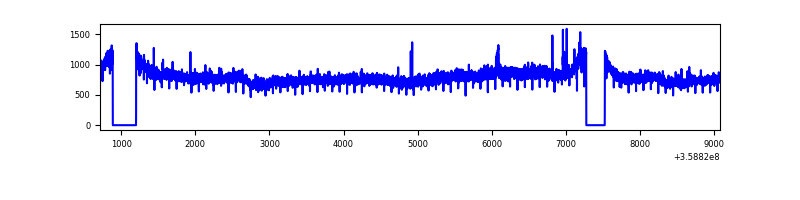 |
| C | 8367 | 7803 | 0 | 0 | 0.00% | 0.00% | 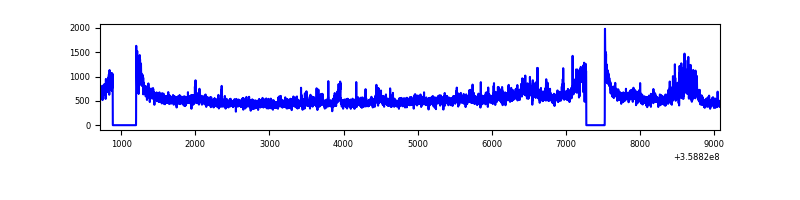 |
| D | 8366 | 7802 | 2615 | 2615 | 31.26% | 33.52% | 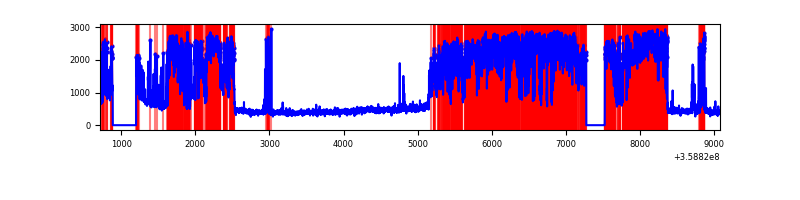 |
Top three noisy pixels from each quadrant. If the there are fewer than three noisy pixels in the level2.evt file, extra rows are filled as -1
| Pixel properties | Quadrant properties | ||||||
|---|---|---|---|---|---|---|---|
| Quadrant | DetID | PixID | Counts | Sigma | Mean | Median | Sigma |
| A | 14 | 239 | 41096 | 204.14 | 969 | 948 | 196.7 |
| A | 12 | 96 | 30841 | 151.99 | 969 | 948 | 196.7 |
| A | 8 | 192 | 25200 | 123.31 | 969 | 948 | 196.7 |
| B | 6 | 159 | 2298222 | 12204.38 | 961 | 935 | 188.2 |
| B | 0 | 229 | 60764 | 317.84 | 961 | 935 | 188.2 |
| B | 0 | 214 | 31684 | 163.35 | 961 | 935 | 188.2 |
| C | 3 | 233 | 564133 | 2525.75 | 936 | 938 | 223.0 |
| C | 14 | 238 | 149283 | 665.28 | 936 | 938 | 223.0 |
| C | 0 | 10 | 25903 | 111.96 | 936 | 938 | 223.0 |
| D | 13 | 104 | 7025847 | 37176.9 | 735 | 720 | 189.0 |
| D | 8 | 195 | 184866 | 974.5 | 735 | 720 | 189.0 |
| D | 12 | 227 | 60727 | 317.56 | 735 | 720 | 189.0 |
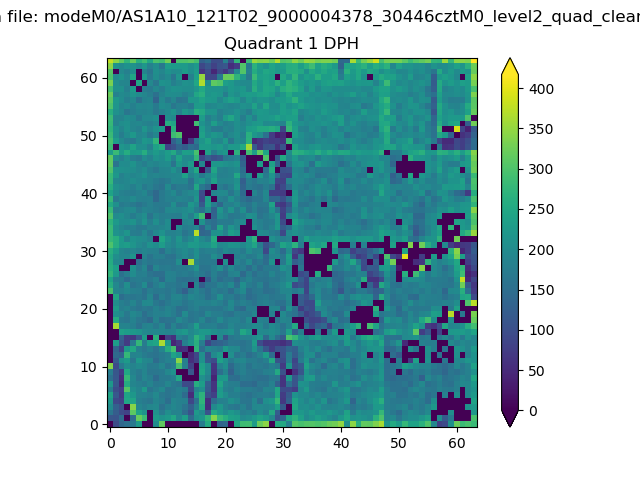
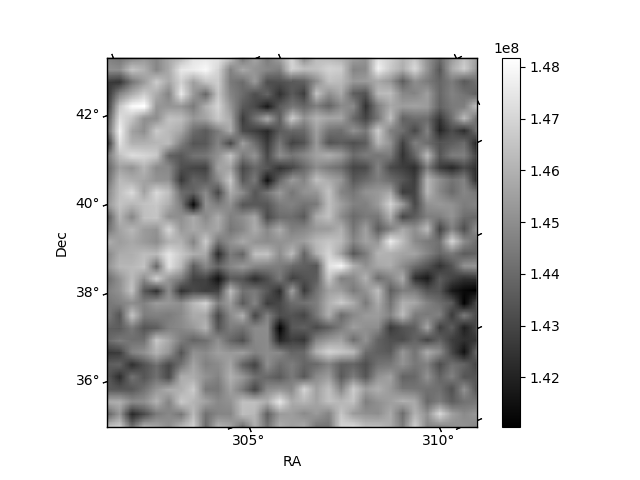
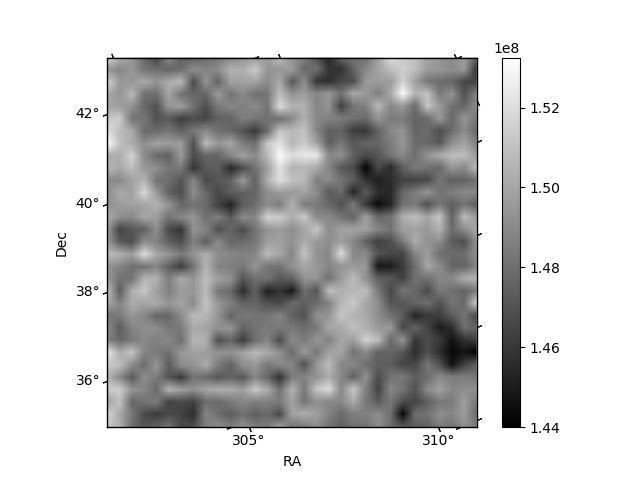
Histogram calculated using DETX and DETY for each event in the final _common_clean file
| Quadrant A |  |
 |
Quadrant B |
|---|---|---|---|
| Quadrant D |  |
 |
Quadrant C |
| Plot type | Count rate plots | Images |
|---|---|---|
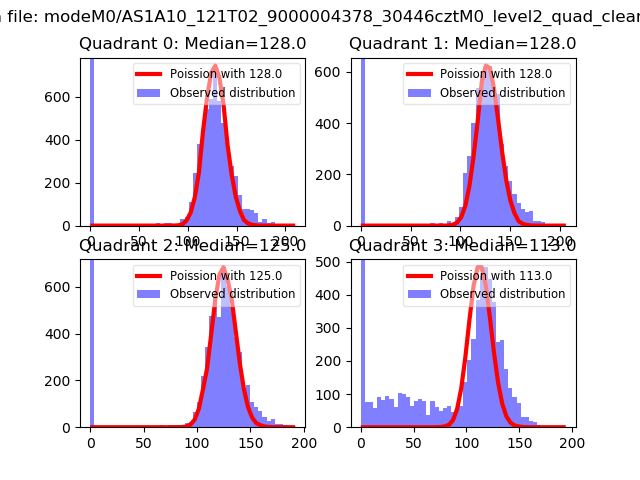
| Comparison with Poisson distribution Blue bars denote a histogram of data divided into 1 sec bins. Red curve is a Poisson curve with rate = median count rate of data. |
 |
 |
| Quadrant-wise count rates Data is divided into 100 sec bins |
 |
|
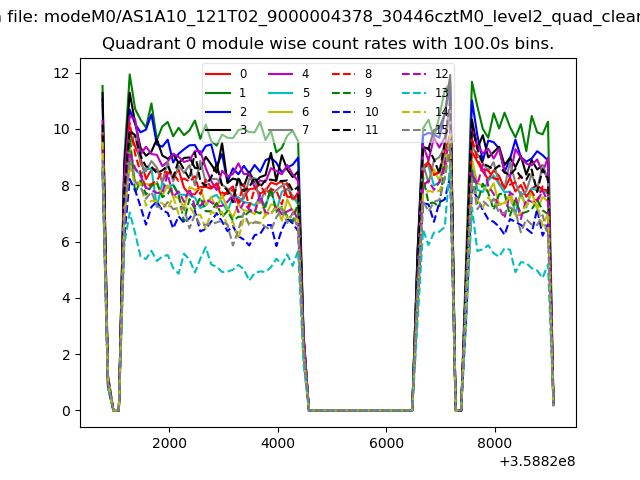
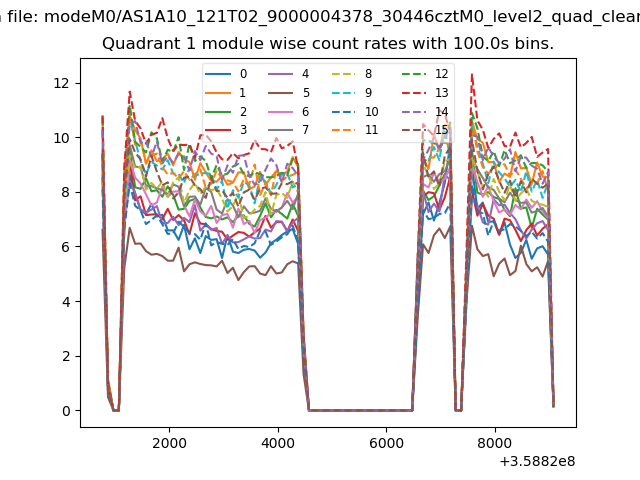
| Module-wise count rates for Quadrant A Data is divided into 100 sec bins |
 |
 |
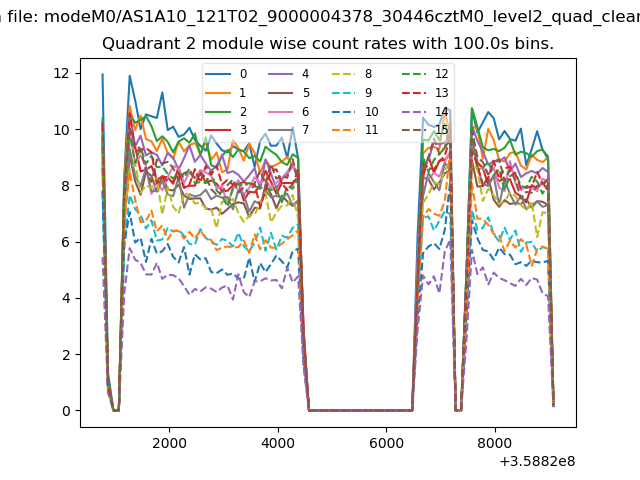
| Module-wise count rates for Quadrant B Data is divided into 100 sec bins |
 |
 |
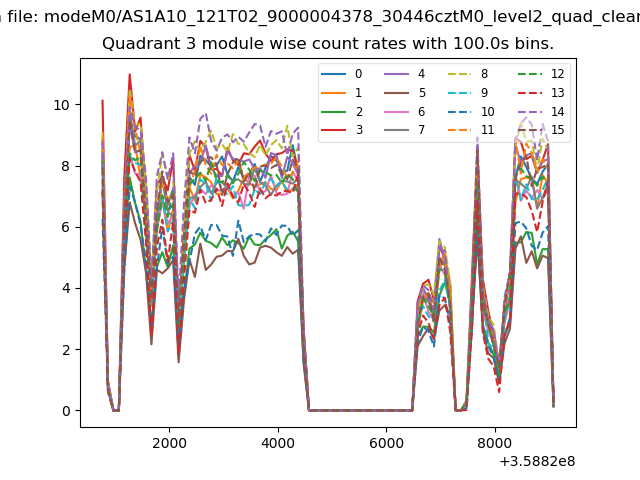
| Module-wise count rates for Quadrant C Data is divided into 100 sec bins |
 |
 |
| Module-wise count rates for Quadrant D Data is divided into 100 sec bins |
 |
 |
| Parameter | Plot |
|---|---|
| CZT HV Monitor | 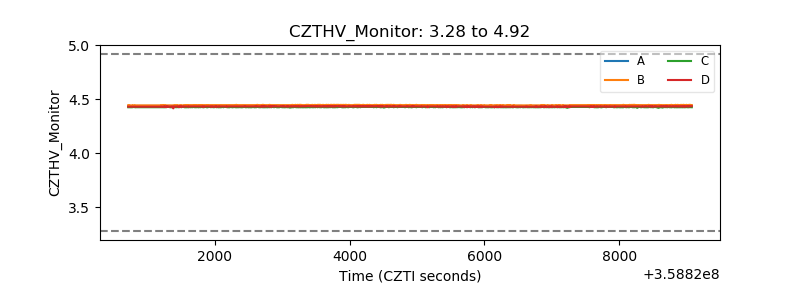 |
| D_VDD | 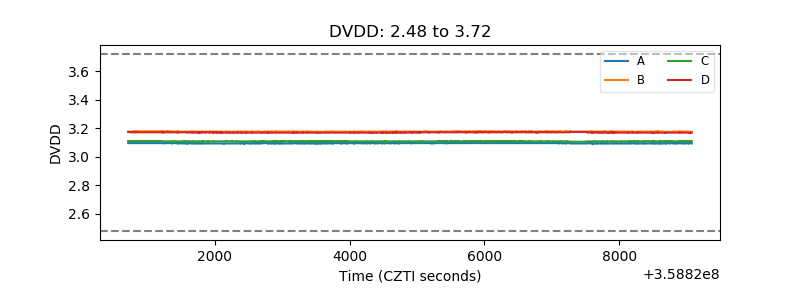 |
| Temperature 1 | 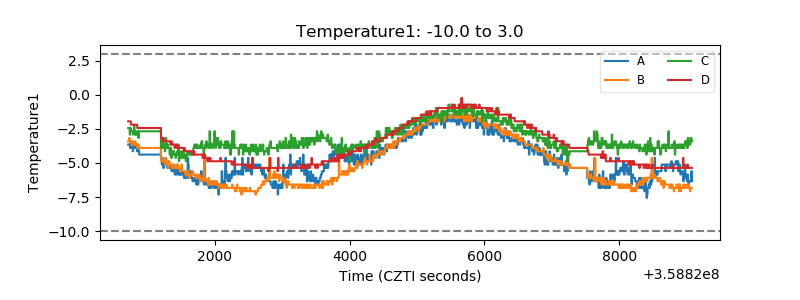 |
| Veto HV Monitor | 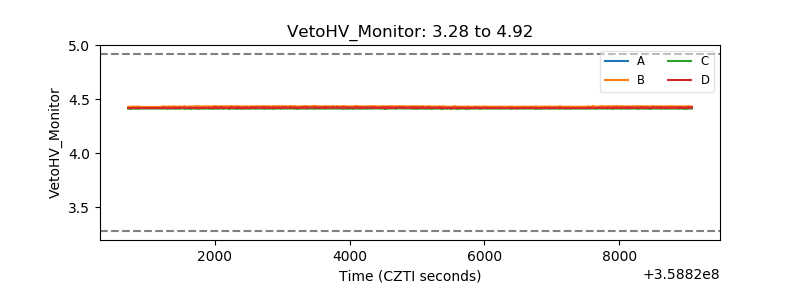 |
| Veto LLD | 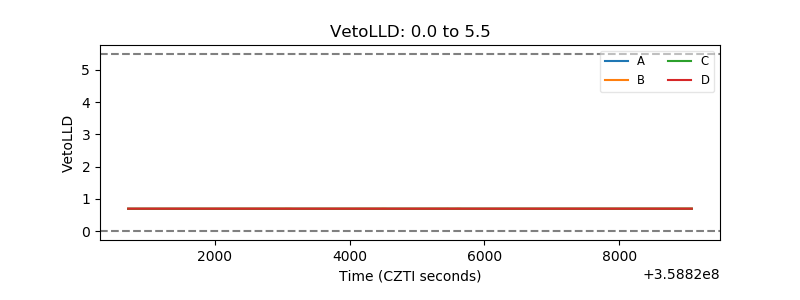 |
| Alpha Counter | 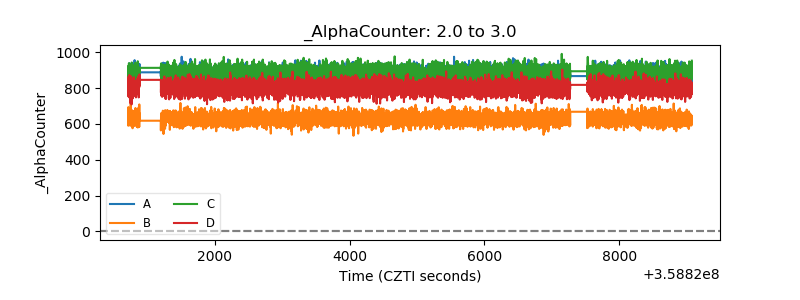 |
| _CPM_Rate | 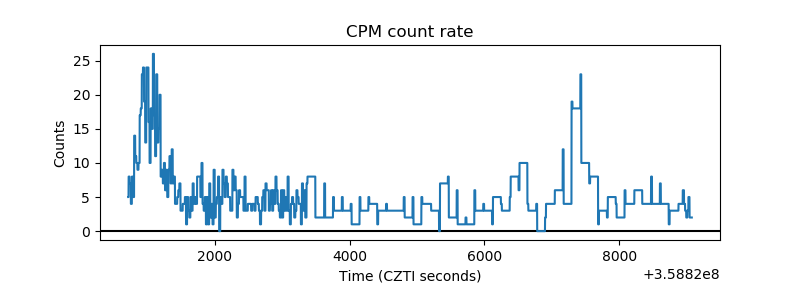 |
| CZT Counter |  |
| +2.5 Volts monitor |  |
| +5 Volts monitor |  |
| _ROLL_ROT | 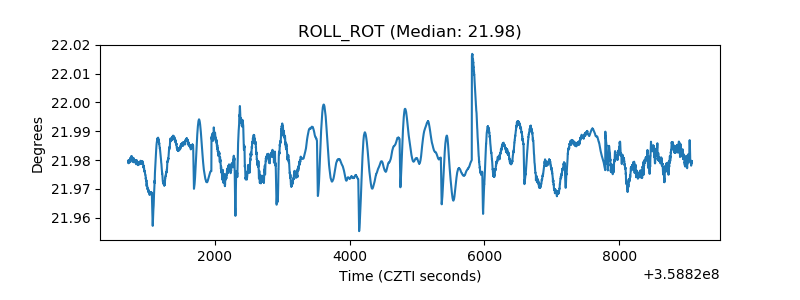 |
| _Roll_DEC | 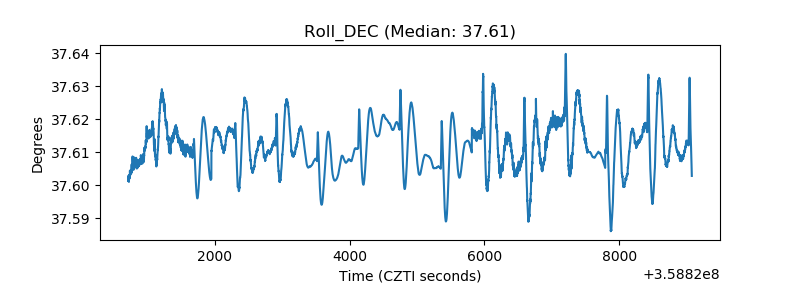 |
| _Roll_RA | 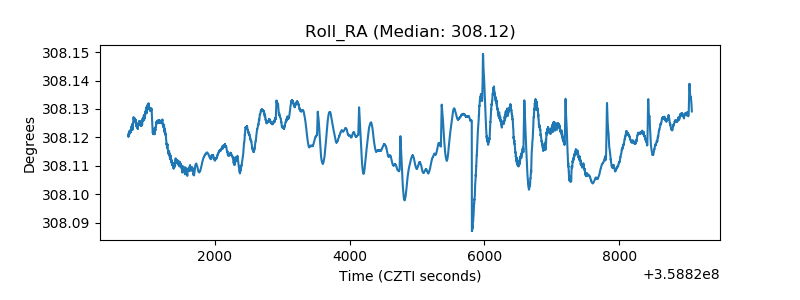 |
| Veto Counter | 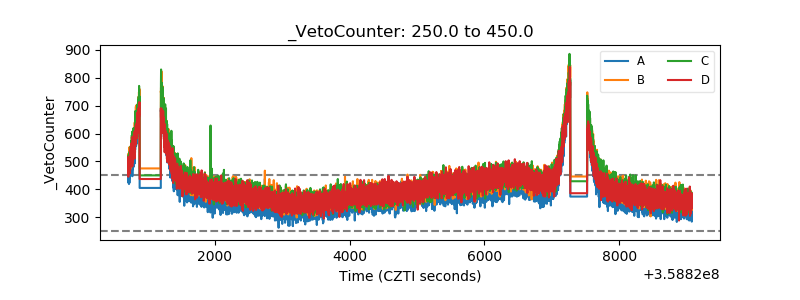 |