| Param | Original file | Final file |
|---|---|---|
| Filename | modeM0/AS1A10_121T02_9000004378_30449cztM0_level2.evt | modeM0/AS1A10_121T02_9000004378_30449cztM0_level2_quad_clean.evt |
| Size (bytes) | 77,446,080 | 21,873,600 |
| Size | 73.9 MB | 20.9 MB |
| Events in quadrant A | 1,010,423 | 255,760 |
| Events in quadrant B | 5,959 | 844 |
| Events in quadrant C | 663,482 | 150,514 |
| Events in quadrant D | 573,885 | 158,478 |
| Mode M0 | |||
|---|---|---|---|
| Quadrant | BADHDUFLAG | Total packets | Discarded packets |
| A | 0 | 15283 | 10696 |
| B | 0 | 22497 | 22477 |
| C | 0 | 22559 | 19884 |
| D | 0 | 33768 | 31020 |
| Mode SS | |||
|---|---|---|---|
| Quadrant | BADHDUFLAG | Total packets | Discarded packets |
| A | 0 | 140117410736936 | 46 |
| B | 0 | -1 | -1 |
| C | 0 | -1 | -1 |
| D | 0 | -1 | -1 |
| Mode M9 | |||
|---|---|---|---|
| Quadrant | BADHDUFLAG | Total packets | Discarded packets |
| A | 0 | 13 | 0 |
| B | 1 | 13 | 0 |
| C | 1 | -1 | -1 |
| D | 1 | -1 | -1 |
| Quadrant | Total seconds | Saturated seconds | Saturation percentage |
|---|---|---|---|
| A | 2295 | 3 | 0.130719% |
| B | 10 | 0 | 0.000000% |
| C | 1339 | 9 | 0.672143% |
| D | 1375 | 0 | 0.000000% |
Noise dominated data is calculated using 1-second bins in cleaned event files. If a bin has >2000 counts, and if more than 50% of those come from <1% of pixels, then it is considered to be noise-dominated and hence unusable.
| Quadrant | # 1 sec bins | Bins with >0 counts | Bins with >2000 counts | High rate bins dominated by noise | Noise dominated (total time) | Noise dominated (detector-on time) | Marked lightcurve |
|---|---|---|---|---|---|---|---|
| A | 15663 | 4557 | 0 | 0 | 0.00% | 0.00% | 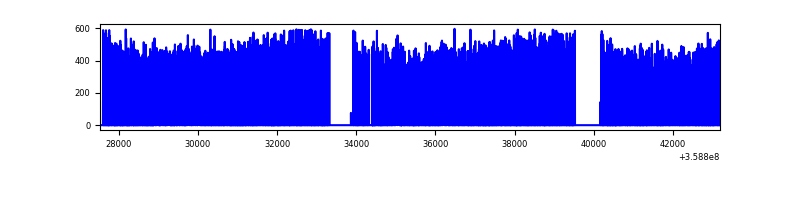 |
| B | 10901 | 18 | 0 | 0 | 0.00% | 0.00% | 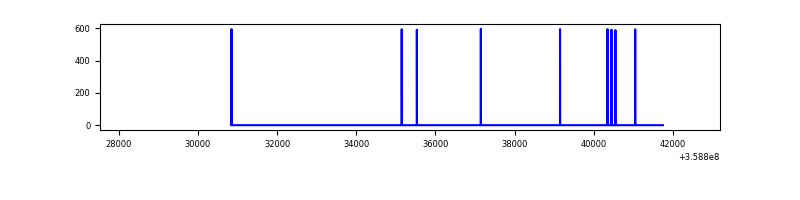 |
| C | 15660 | 2670 | 0 | 0 | 0.00% | 0.00% | 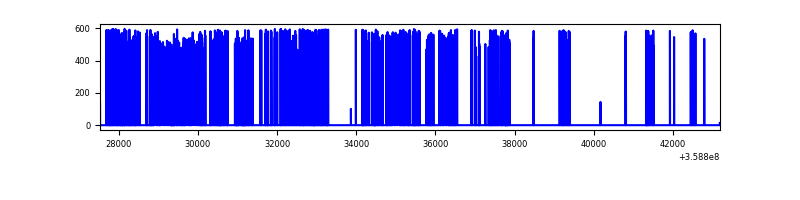 |
| D | 14461 | 2705 | 0 | 0 | 0.00% | 0.00% | 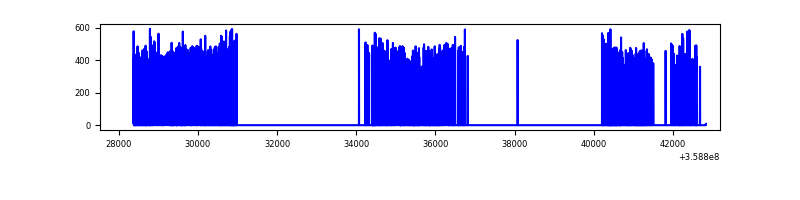 |
Top three noisy pixels from each quadrant. If the there are fewer than three noisy pixels in the level2.evt file, extra rows are filled as -1
| Pixel properties | Quadrant properties | ||||||
|---|---|---|---|---|---|---|---|
| Quadrant | DetID | PixID | Counts | Sigma | Mean | Median | Sigma |
| A | 13 | 254 | 4460 | 77.42 | 260 | 254 | 54.3 |
| A | 3 | 137 | 2668 | 44.44 | 260 | 254 | 54.3 |
| A | 4 | 2 | 2567 | 42.58 | 260 | 254 | 54.3 |
| B | 6 | 159 | 2003 | 3947.2 | 1 | 1 | 0.5 |
| B | 0 | 229 | 101 | 197.16 | 1 | 1 | 0.5 |
| B | 12 | 111 | 21 | 39.43 | 1 | 1 | 0.5 |
| C | 3 | 233 | 93027 | 2675.34 | 139 | 139 | 34.7 |
| C | 14 | 238 | 22431 | 642.04 | 139 | 139 | 34.7 |
| C | 2 | 114 | 2981 | 81.84 | 139 | 139 | 34.7 |
| D | 8 | 195 | 32988 | 934.22 | 140 | 137 | 35.2 |
| D | 13 | 104 | 6546 | 182.26 | 140 | 137 | 35.2 |
| D | 2 | 234 | 4821 | 133.2 | 140 | 137 | 35.2 |
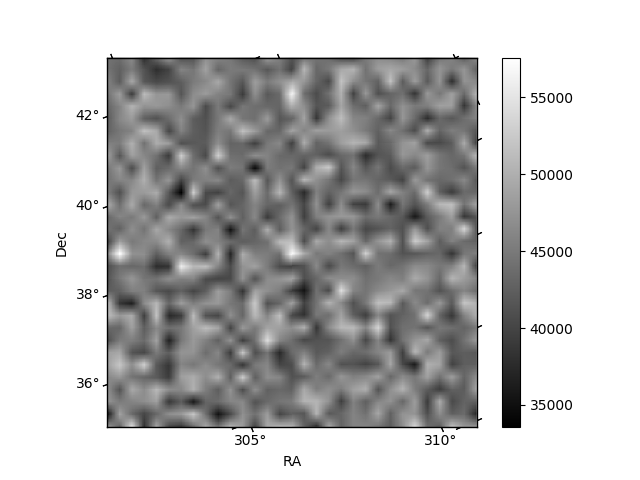
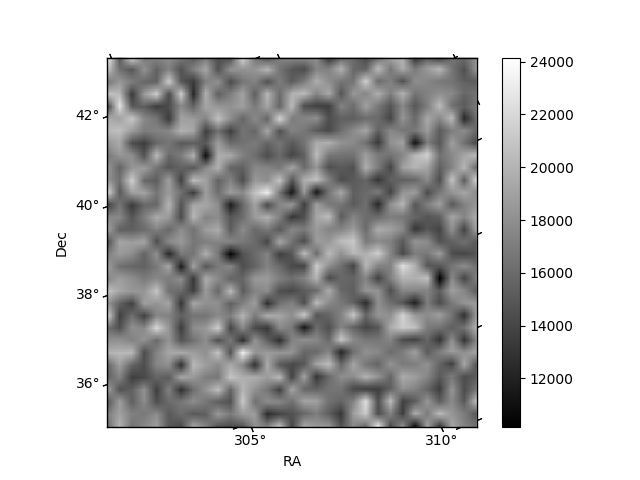
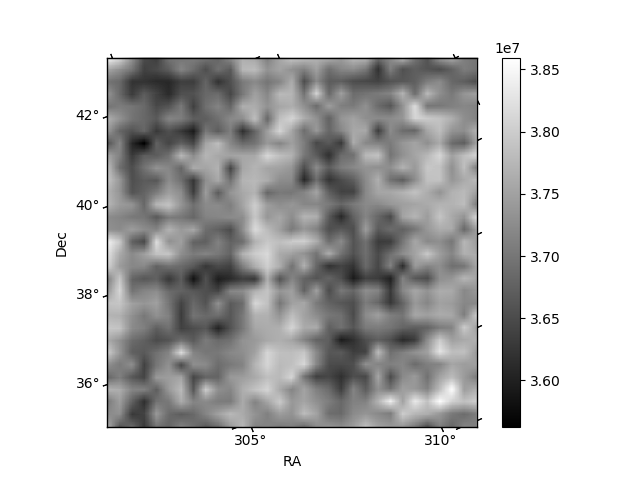
Histogram calculated using DETX and DETY for each event in the final _common_clean file
| Quadrant A | 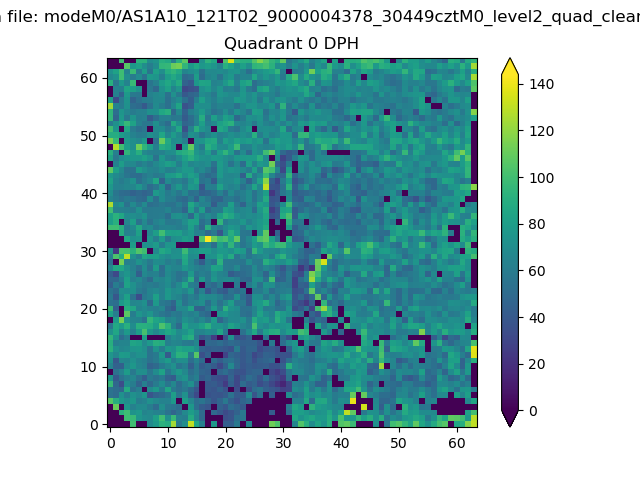 |
 |
Quadrant B |
|---|---|---|---|
| Quadrant D |  |
 |
Quadrant C |
| Plot type | Count rate plots | Images |
|---|---|---|
| Comparison with Poisson distribution Blue bars denote a histogram of data divided into 1 sec bins. Red curve is a Poisson curve with rate = median count rate of data. |
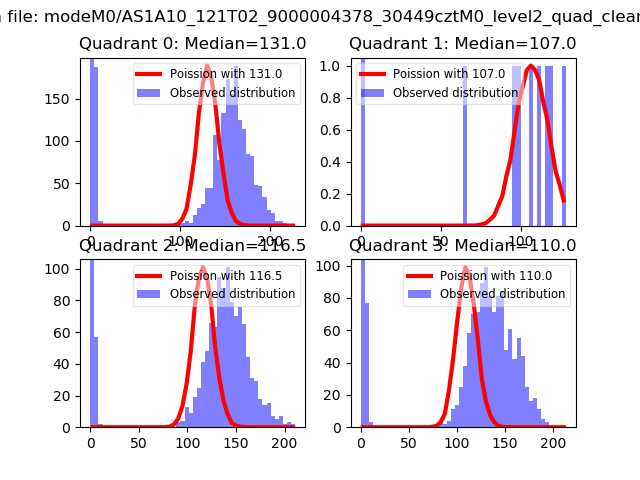 |
 |
| Quadrant-wise count rates Data is divided into 100 sec bins |
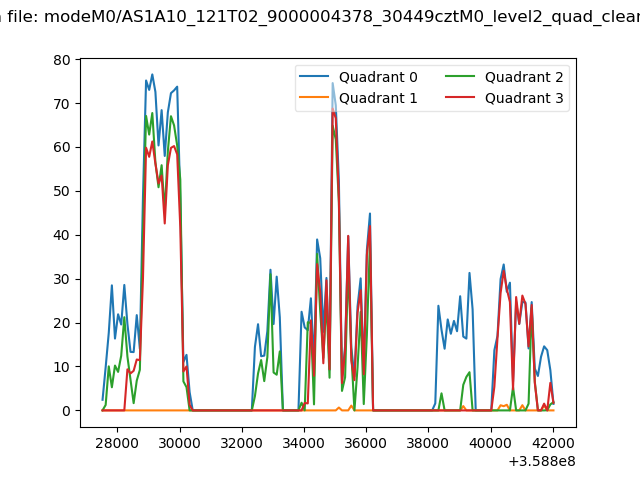 |
|
| Module-wise count rates for Quadrant A Data is divided into 100 sec bins |
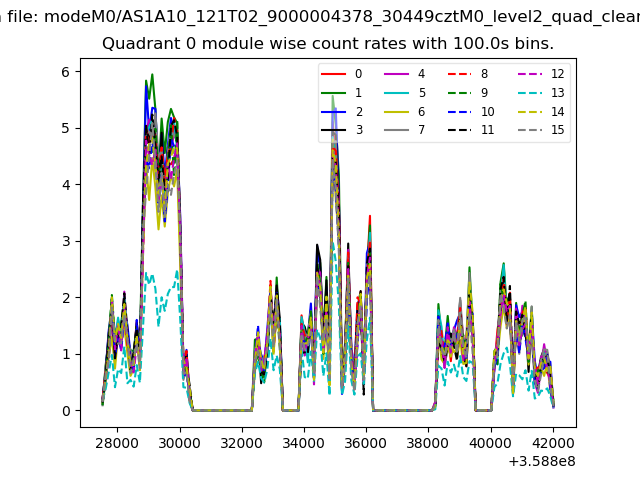 |
 |
| Module-wise count rates for Quadrant B Data is divided into 100 sec bins |
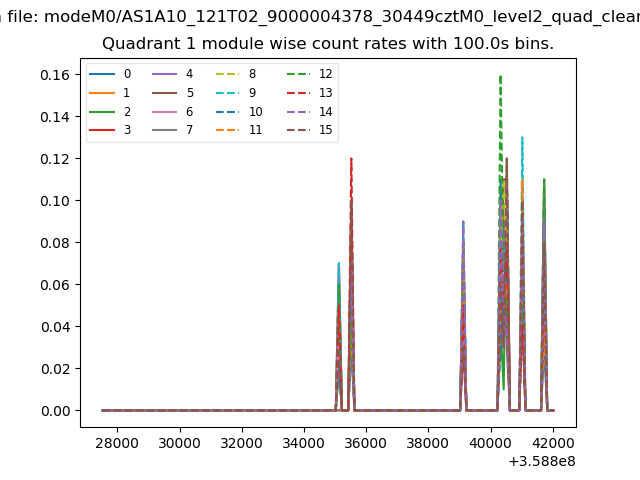 |
 |
| Module-wise count rates for Quadrant C Data is divided into 100 sec bins |
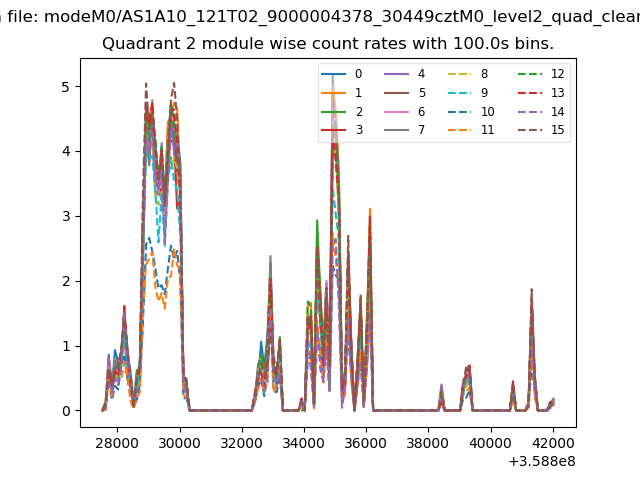 |
 |
| Module-wise count rates for Quadrant D Data is divided into 100 sec bins |
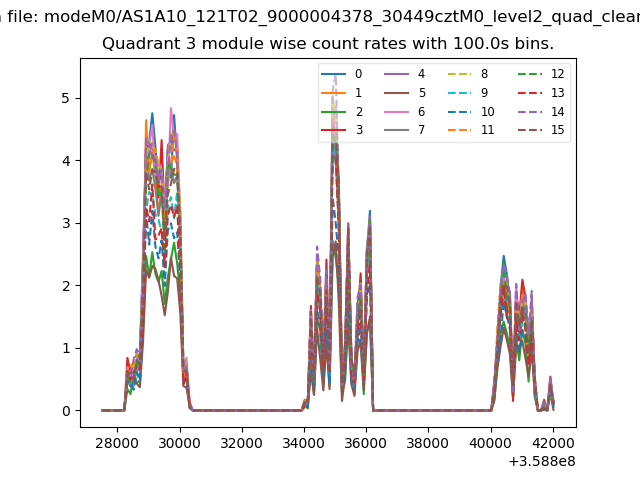 |
 |
| Parameter | Plot |
|---|---|
| CZT HV Monitor | 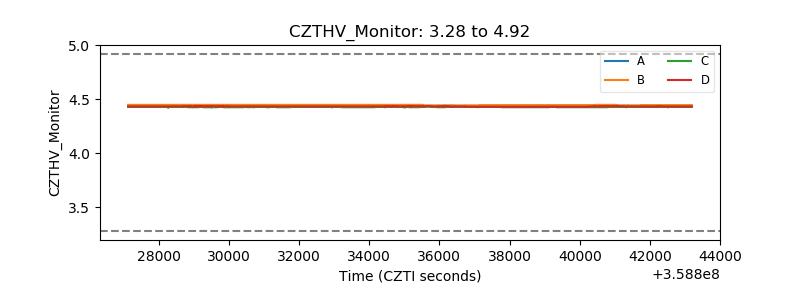 |
| D_VDD | 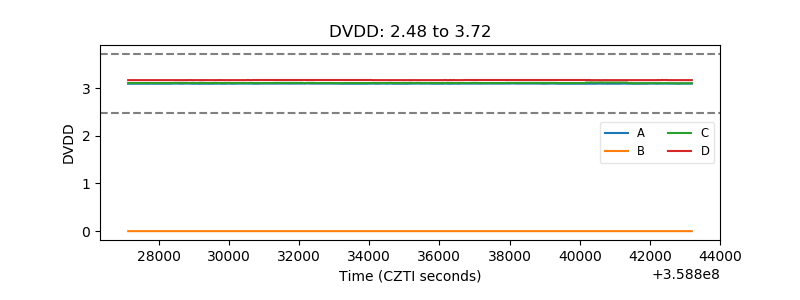 |
| Temperature 1 | 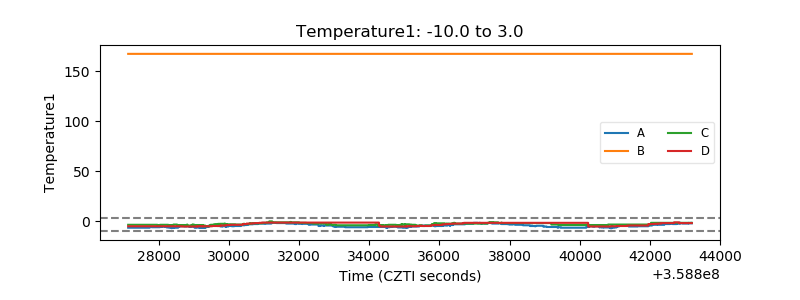 |
| Veto HV Monitor | 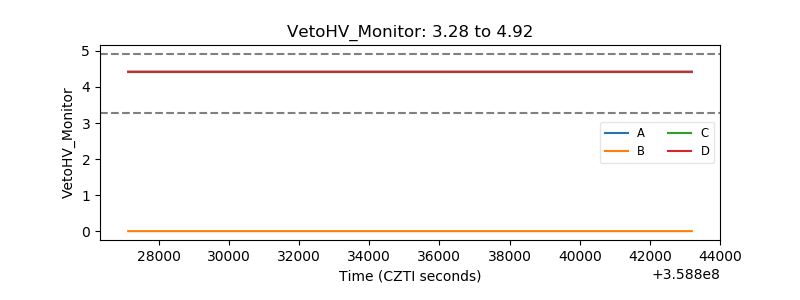 |
| Veto LLD | 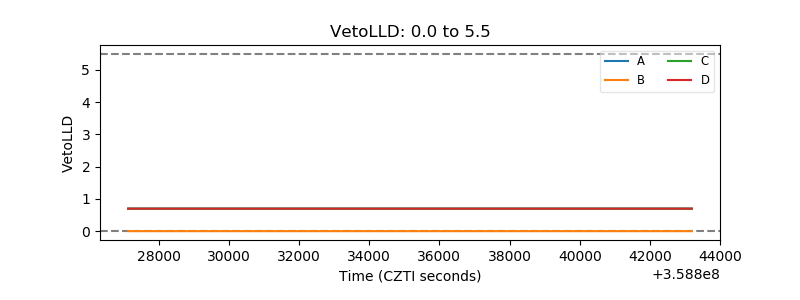 |
| Alpha Counter | 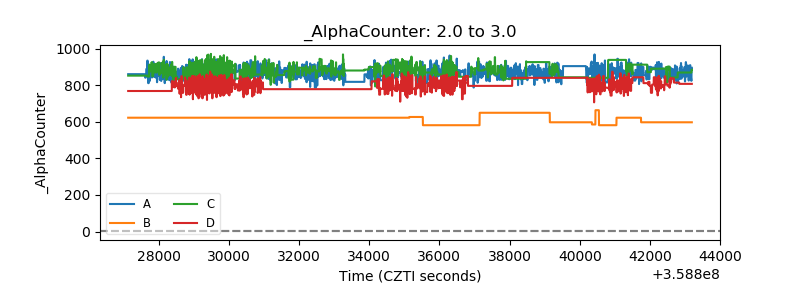 |
| _CPM_Rate | 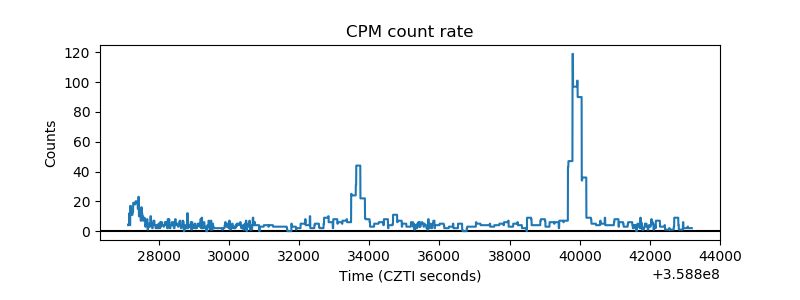 |
| CZT Counter |  |
| +2.5 Volts monitor |  |
| +5 Volts monitor |  |
| _ROLL_ROT | 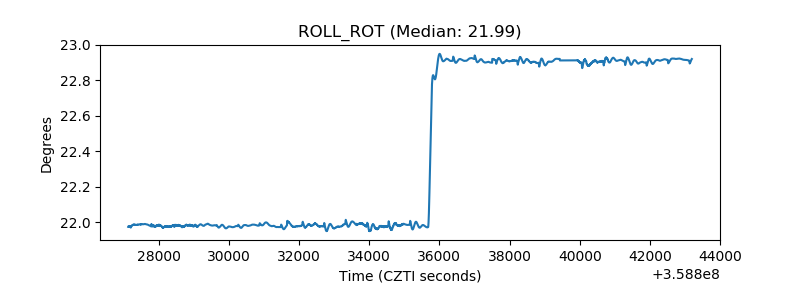 |
| _Roll_DEC | 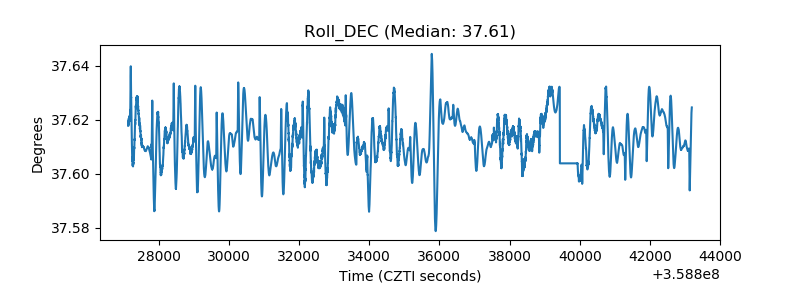 |
| _Roll_RA | 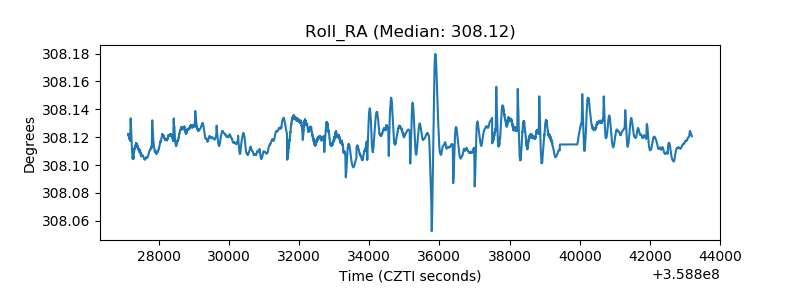 |
| Veto Counter | 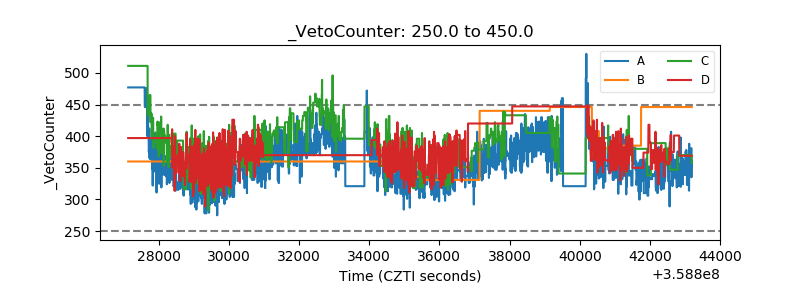 |