| Param | Original file | Final file |
|---|---|---|
| Filename | modeM0/AS1A10_121T02_9000004378_30450cztM0_level2.evt | modeM0/AS1A10_121T02_9000004378_30450cztM0_level2_quad_clean.evt |
| Size (bytes) | 1,261,722,240 | 121,308,480 |
| Size | 1.2 GB | 115.7 MB |
| Events in quadrant A | 5,108,292 | 783,613 |
| Events in quadrant B | 8,271,168 | 782,413 |
| Events in quadrant C | 11,608,514 | 719,875 |
| Events in quadrant D | 12,510,460 | 652,330 |
| Mode M0 | |||
|---|---|---|---|
| Quadrant | BADHDUFLAG | Total packets | Discarded packets |
| A | 0 | 21742 | 2 |
| B | 0 | 32269 | 2 |
| C | 0 | 42155 | 4 |
| D | 0 | 44343 | 2 |
| Mode SS | |||
|---|---|---|---|
| Quadrant | BADHDUFLAG | Total packets | Discarded packets |
| A | 0 | 216 | 0 |
| B | 0 | 216 | 0 |
| C | 0 | 216 | 0 |
| D | 0 | 216 | 0 |
| Mode M9 | |||
|---|---|---|---|
| Quadrant | BADHDUFLAG | Total packets | Discarded packets |
| A | 0 | 16 | 0 |
| B | 0 | 16 | 0 |
| C | 0 | 16 | 0 |
| D | 0 | 16 | 0 |
| Quadrant | Total seconds | Saturated seconds | Saturation percentage |
|---|---|---|---|
| A | 10604 | 121 | 1.141079% |
| B | 10604 | 184 | 1.735194% |
| C | 10603 | 1454 | 13.713100% |
| D | 10603 | 3098 | 29.218146% |
Noise dominated data is calculated using 1-second bins in cleaned event files. If a bin has >2000 counts, and if more than 50% of those come from <1% of pixels, then it is considered to be noise-dominated and hence unusable.
| Quadrant | # 1 sec bins | Bins with >0 counts | Bins with >2000 counts | High rate bins dominated by noise | Noise dominated (total time) | Noise dominated (detector-on time) | Marked lightcurve |
|---|---|---|---|---|---|---|---|
| A | 12229 | 10606 | 6 | 6 | 0.05% | 0.06% |  |
| B | 12229 | 10606 | 3 | 3 | 0.02% | 0.03% |  |
| C | 12228 | 10605 | 809 | 809 | 6.62% | 7.63% | 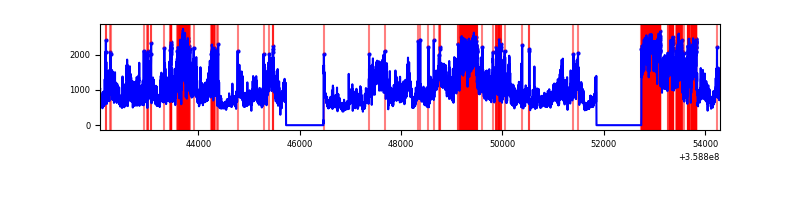 |
| D | 12228 | 10605 | 2758 | 2758 | 22.55% | 26.01% | 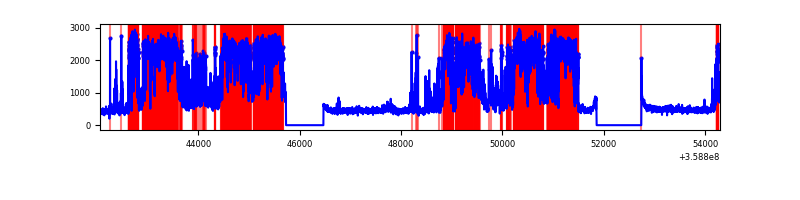 |
Top three noisy pixels from each quadrant. If the there are fewer than three noisy pixels in the level2.evt file, extra rows are filled as -1
| Pixel properties | Quadrant properties | ||||||
|---|---|---|---|---|---|---|---|
| Quadrant | DetID | PixID | Counts | Sigma | Mean | Median | Sigma |
| A | 4 | 2 | 46559 | 173.43 | 1304 | 1275 | 261.1 |
| A | 8 | 192 | 22644 | 81.84 | 1304 | 1275 | 261.1 |
| A | 13 | 254 | 18125 | 64.53 | 1304 | 1275 | 261.1 |
| B | 6 | 159 | 2922684 | 11928.15 | 1282 | 1249 | 244.9 |
| B | 0 | 229 | 269895 | 1096.87 | 1282 | 1249 | 244.9 |
| B | 12 | 111 | 30681 | 120.17 | 1282 | 1249 | 244.9 |
| C | 3 | 233 | 6692369 | 23840.1 | 1200 | 1207 | 280.7 |
| C | 14 | 238 | 189860 | 672.16 | 1200 | 1207 | 280.7 |
| C | 2 | 114 | 24298 | 82.27 | 1200 | 1207 | 280.7 |
| D | 13 | 104 | 7738447 | 26657.04 | 1108 | 1086 | 290.3 |
| D | 8 | 195 | 183325 | 627.86 | 1108 | 1086 | 290.3 |
| D | 2 | 250 | 120544 | 411.56 | 1108 | 1086 | 290.3 |
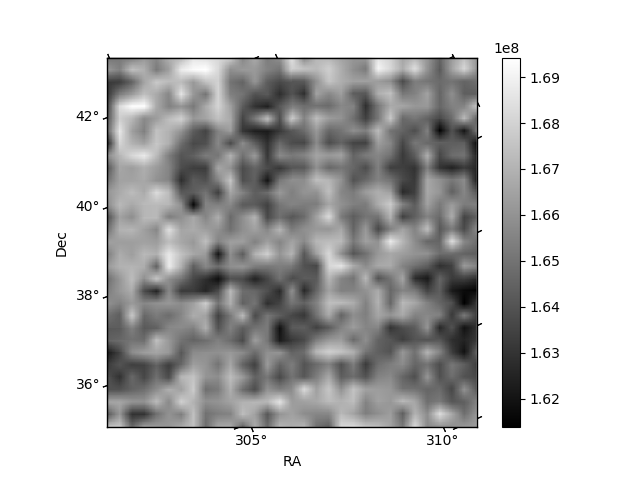
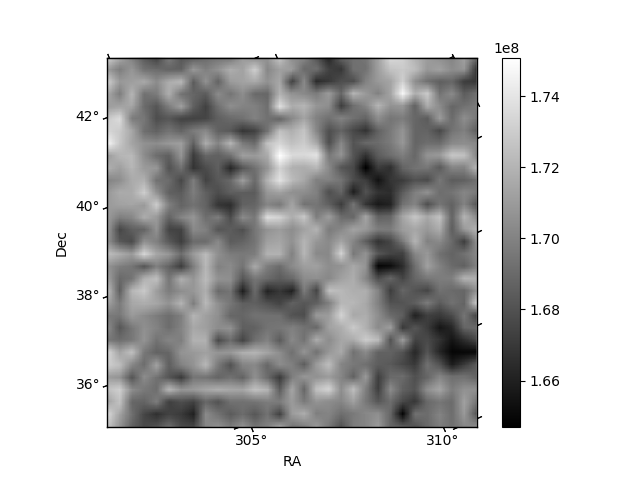
Histogram calculated using DETX and DETY for each event in the final _common_clean file
| Quadrant A | 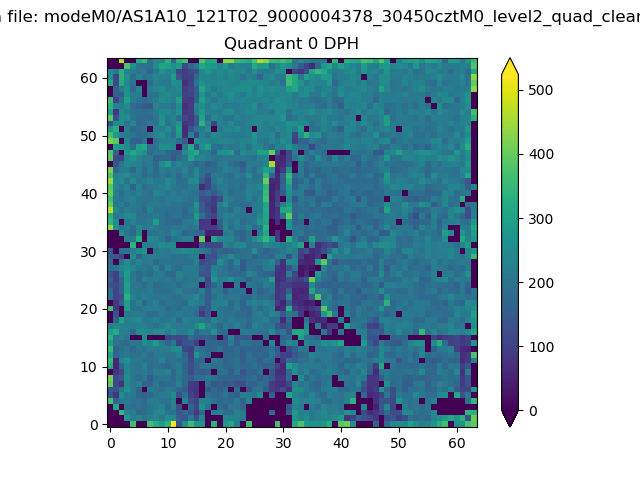 |
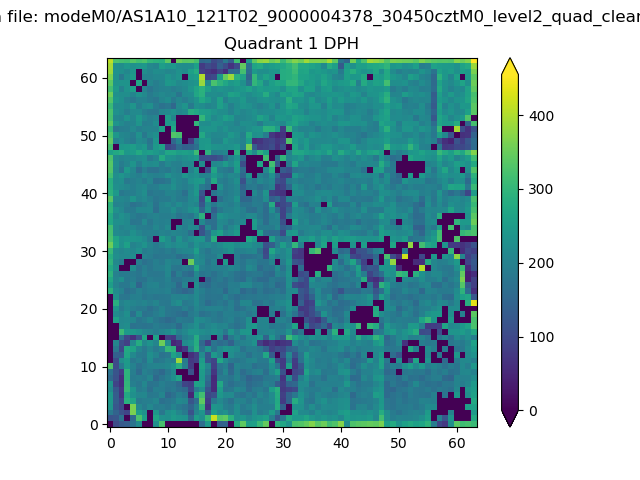 |
Quadrant B |
|---|---|---|---|
| Quadrant D | 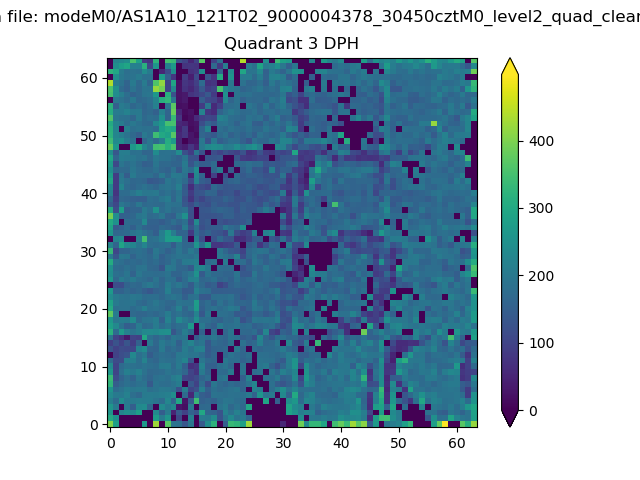 |
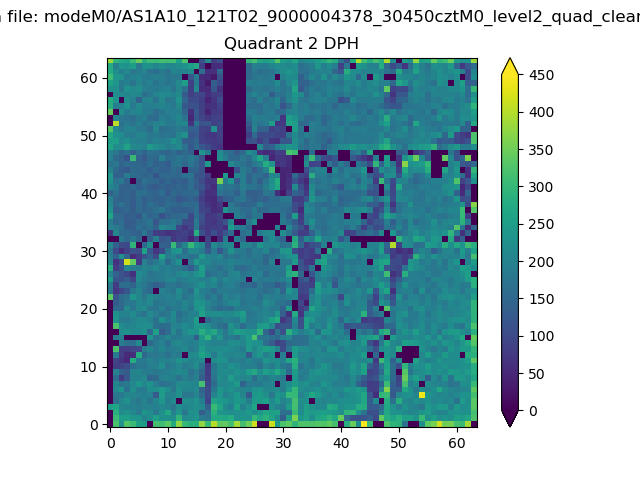 |
Quadrant C |
| Plot type | Count rate plots | Images |
|---|---|---|
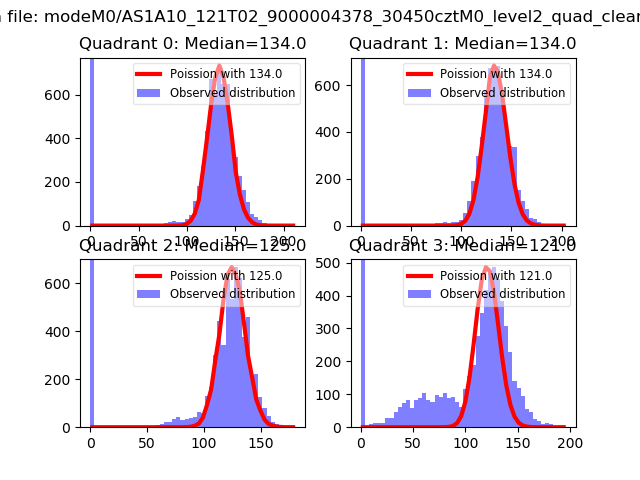
| Comparison with Poisson distribution Blue bars denote a histogram of data divided into 1 sec bins. Red curve is a Poisson curve with rate = median count rate of data. |
 |
 |
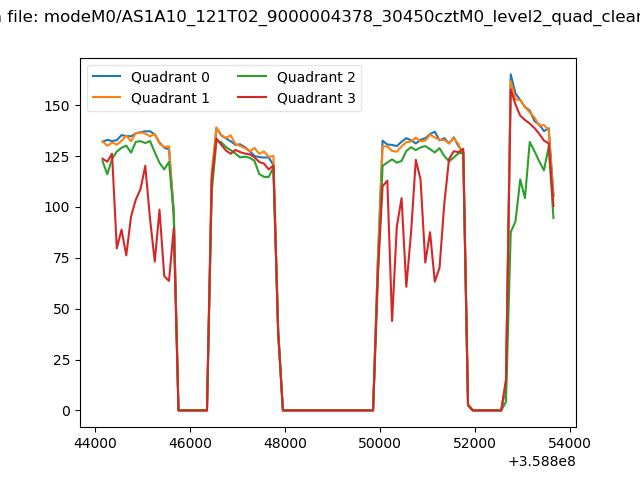
| Quadrant-wise count rates Data is divided into 100 sec bins |
 |
|
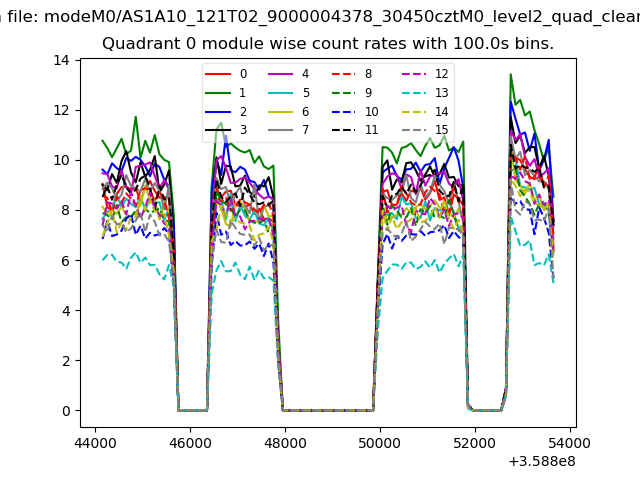
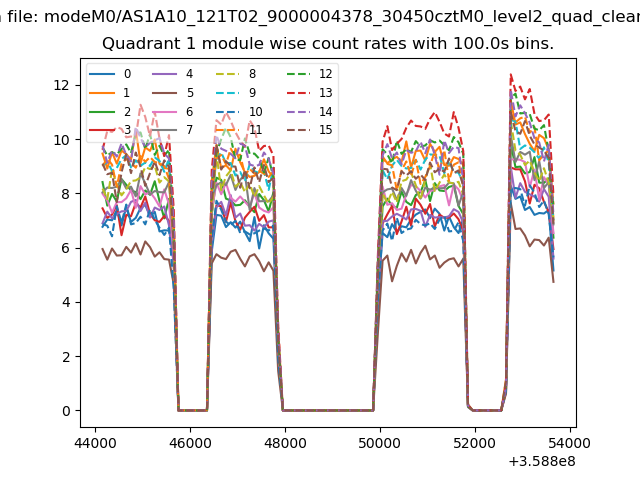
| Module-wise count rates for Quadrant A Data is divided into 100 sec bins |
 |
 |
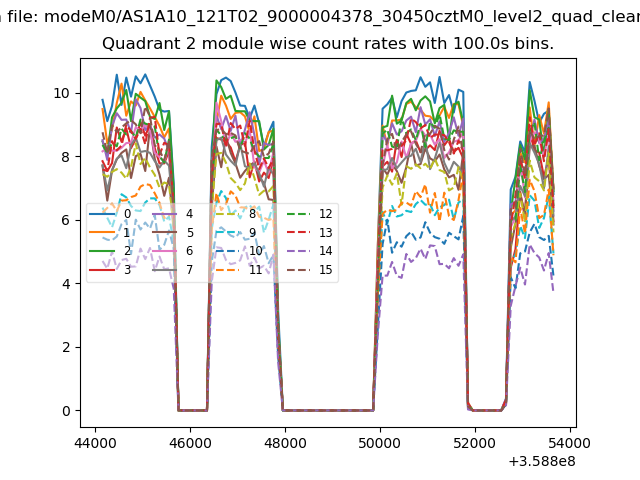
| Module-wise count rates for Quadrant B Data is divided into 100 sec bins |
 |
 |
| Module-wise count rates for Quadrant C Data is divided into 100 sec bins |
 |
 |
| Module-wise count rates for Quadrant D Data is divided into 100 sec bins |
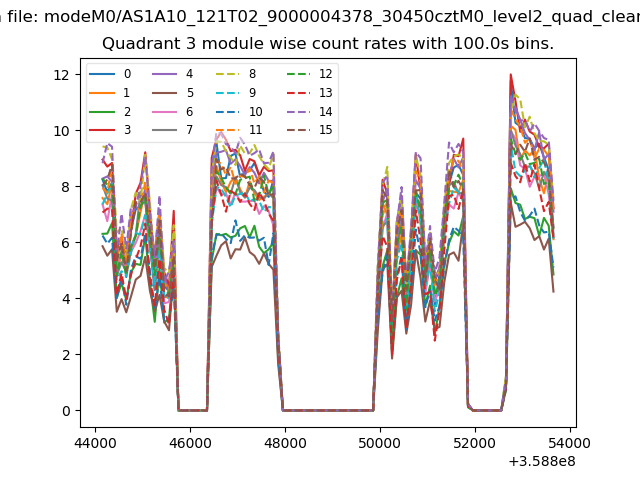 |
 |
| Parameter | Plot |
|---|---|
| CZT HV Monitor | 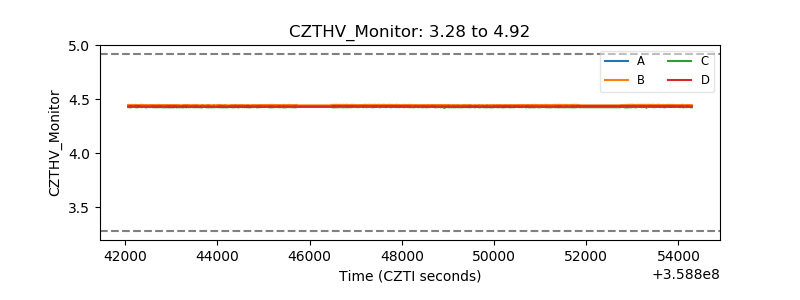 |
| D_VDD | 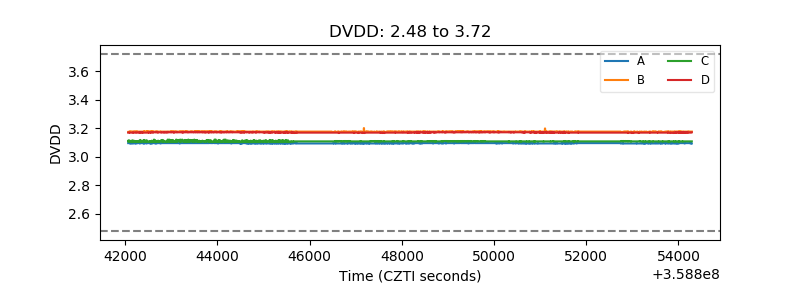 |
| Temperature 1 | 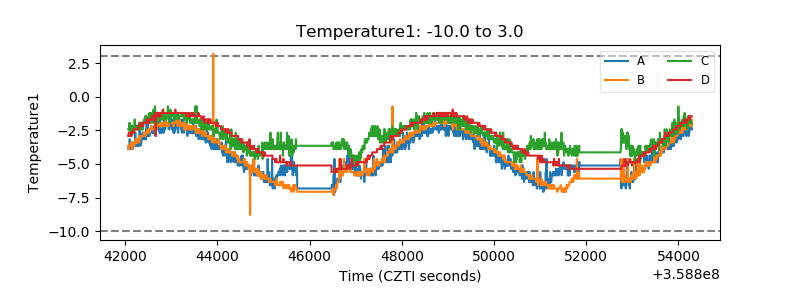 |
| Veto HV Monitor | 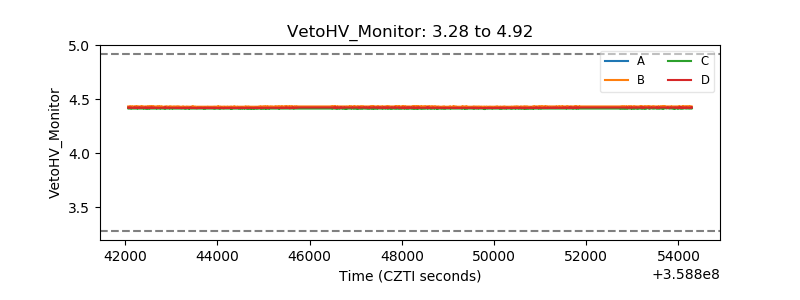 |
| Veto LLD | 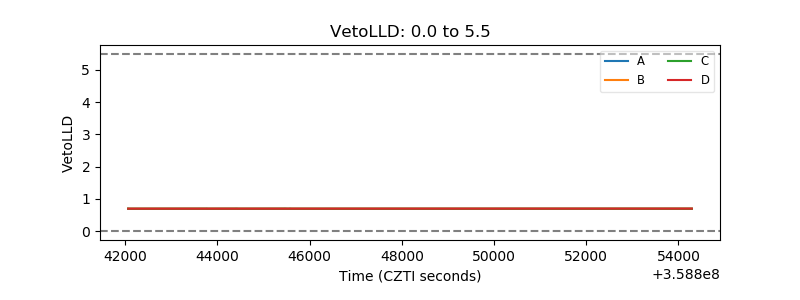 |
| Alpha Counter | 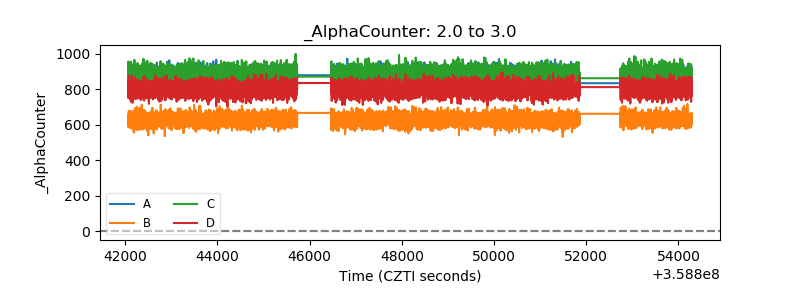 |
| _CPM_Rate | 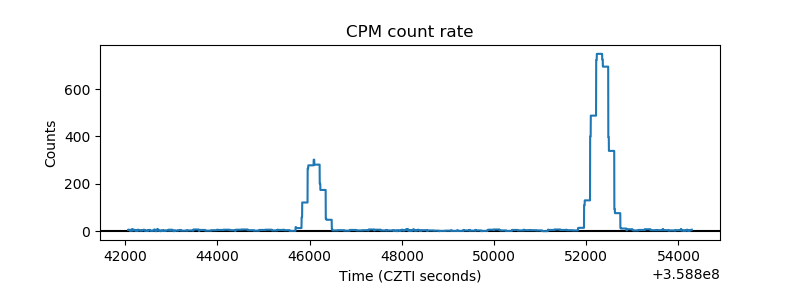 |
| CZT Counter | 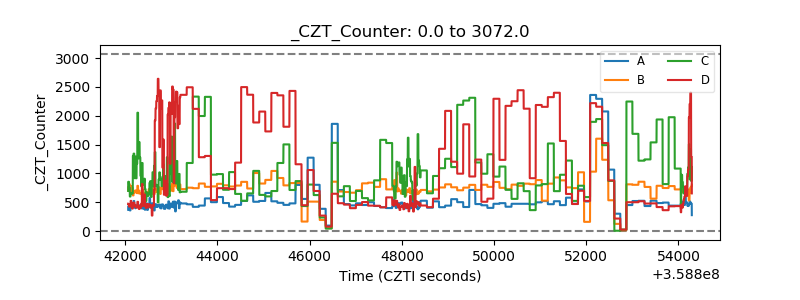 |
| +2.5 Volts monitor |  |
| +5 Volts monitor | 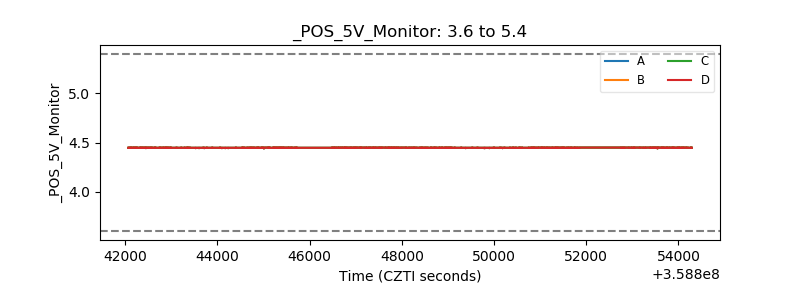 |
| _ROLL_ROT | 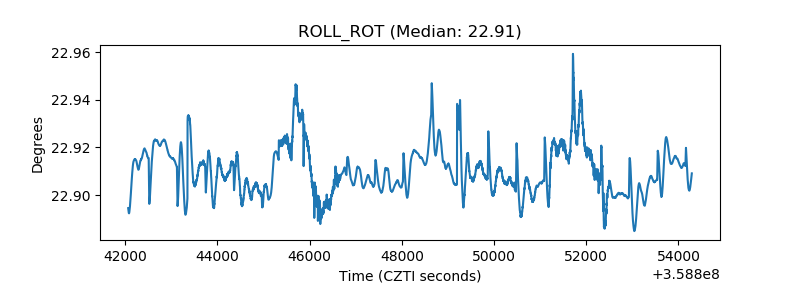 |
| _Roll_DEC | 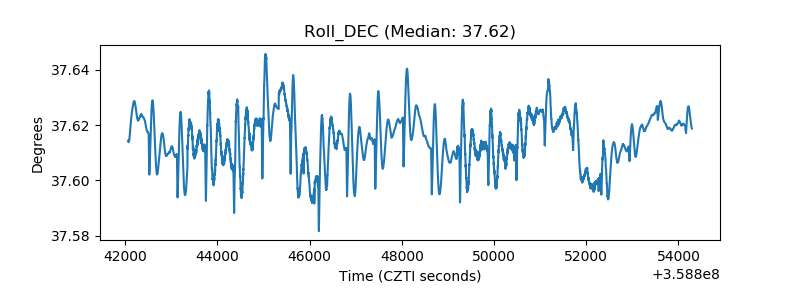 |
| _Roll_RA | 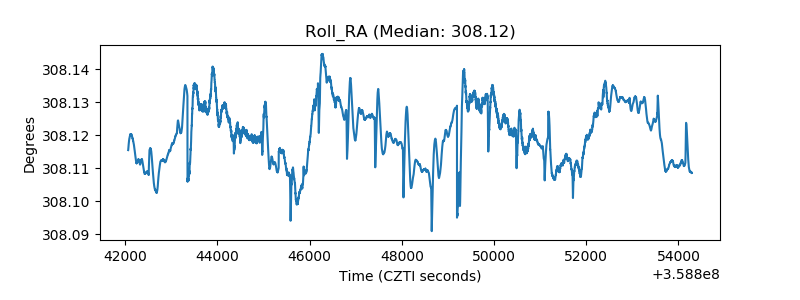 |
| Veto Counter | 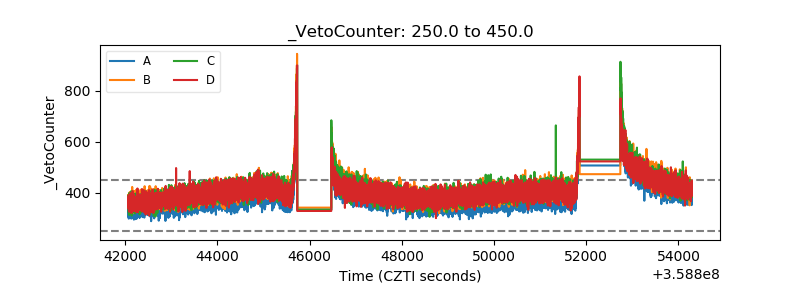 |