| Param | Original file | Final file |
|---|---|---|
| Filename | modeM0/AS1A10_121T02_9000004378_30451cztM0_level2.evt | modeM0/AS1A10_121T02_9000004378_30451cztM0_level2_quad_clean.evt |
| Size (bytes) | 646,462,080 | 81,406,080 |
| Size | 616.5 MB | 77.6 MB |
| Events in quadrant A | 3,348,709 | 517,890 |
| Events in quadrant B | 5,379,231 | 515,517 |
| Events in quadrant C | 5,614,841 | 476,912 |
| Events in quadrant D | 4,785,866 | 490,561 |
| Mode M0 | |||
|---|---|---|---|
| Quadrant | BADHDUFLAG | Total packets | Discarded packets |
| A | 0 | 14005 | 1 |
| B | 0 | 20445 | 1 |
| C | 0 | 20897 | 1 |
| D | 0 | 18389 | 1 |
| Mode SS | |||
|---|---|---|---|
| Quadrant | BADHDUFLAG | Total packets | Discarded packets |
| A | 0 | 136 | 0 |
| B | 0 | 136 | 0 |
| C | 0 | 136 | 0 |
| D | 0 | 136 | 0 |
| Mode M9 | |||
|---|---|---|---|
| Quadrant | BADHDUFLAG | Total packets | Discarded packets |
| A | 0 | 10 | 0 |
| B | 0 | 10 | 0 |
| C | 0 | 10 | 0 |
| D | 0 | 10 | 0 |
| Quadrant | Total seconds | Saturated seconds | Saturation percentage |
|---|---|---|---|
| A | 6650 | 74 | 1.112782% |
| B | 6650 | 108 | 1.624060% |
| C | 6651 | 624 | 9.382048% |
| D | 6651 | 266 | 3.999399% |
Noise dominated data is calculated using 1-second bins in cleaned event files. If a bin has >2000 counts, and if more than 50% of those come from <1% of pixels, then it is considered to be noise-dominated and hence unusable.
| Quadrant | # 1 sec bins | Bins with >0 counts | Bins with >2000 counts | High rate bins dominated by noise | Noise dominated (total time) | Noise dominated (detector-on time) | Marked lightcurve |
|---|---|---|---|---|---|---|---|
| A | 7680 | 6651 | 7 | 7 | 0.09% | 0.11% | 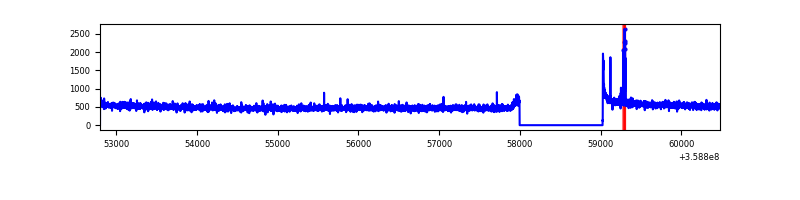 |
| B | 7680 | 6651 | 3 | 3 | 0.04% | 0.05% | 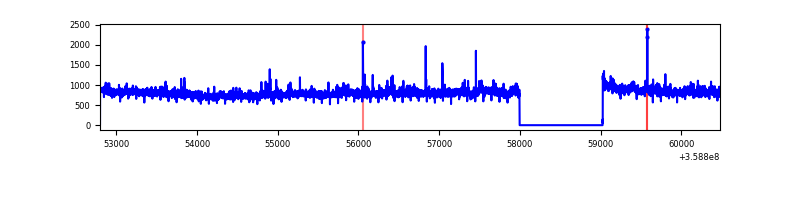 |
| C | 7681 | 6652 | 416 | 416 | 5.42% | 6.25% | 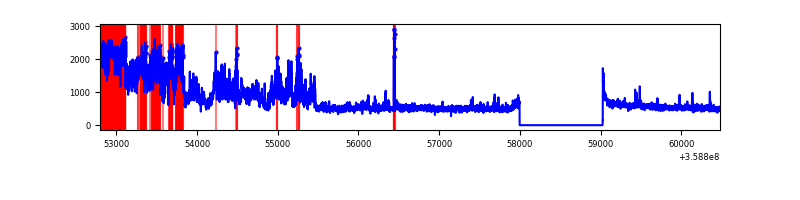 |
| D | 7681 | 6652 | 224 | 224 | 2.92% | 3.37% | 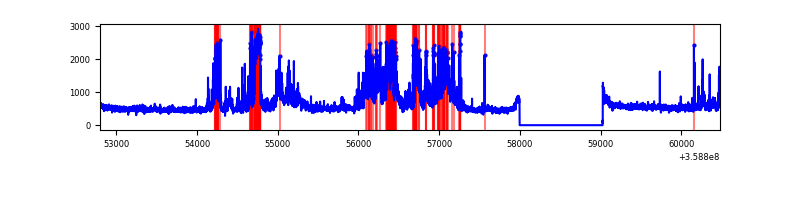 |
Top three noisy pixels from each quadrant. If the there are fewer than three noisy pixels in the level2.evt file, extra rows are filled as -1
| Pixel properties | Quadrant properties | ||||||
|---|---|---|---|---|---|---|---|
| Quadrant | DetID | PixID | Counts | Sigma | Mean | Median | Sigma |
| A | 12 | 96 | 36682 | 210.41 | 855 | 837 | 170.4 |
| A | 8 | 192 | 14111 | 77.92 | 855 | 837 | 170.4 |
| A | 13 | 254 | 11613 | 63.26 | 855 | 837 | 170.4 |
| B | 6 | 159 | 1838225 | 11433.64 | 838 | 818 | 160.7 |
| B | 0 | 229 | 229527 | 1423.19 | 838 | 818 | 160.7 |
| B | 12 | 111 | 19654 | 117.21 | 838 | 818 | 160.7 |
| C | 3 | 233 | 2337776 | 12664.61 | 790 | 797 | 184.5 |
| C | 14 | 238 | 135543 | 730.22 | 790 | 797 | 184.5 |
| C | 10 | 22 | 27755 | 146.09 | 790 | 797 | 184.5 |
| D | 13 | 104 | 1338260 | 6321.51 | 812 | 798 | 211.6 |
| D | 7 | 238 | 130633 | 613.67 | 812 | 798 | 211.6 |
| D | 8 | 195 | 123329 | 579.14 | 812 | 798 | 211.6 |
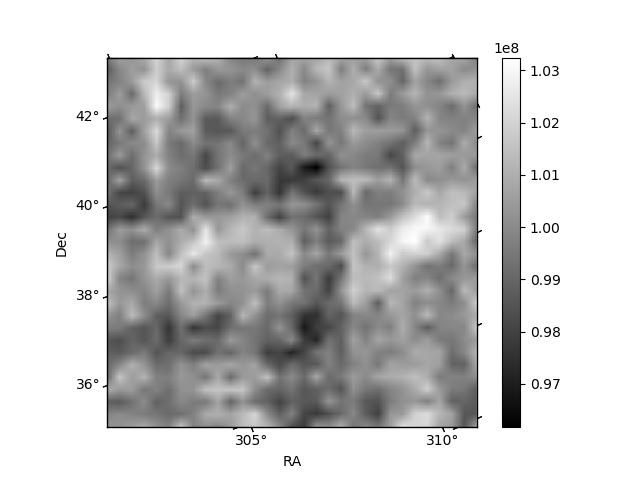
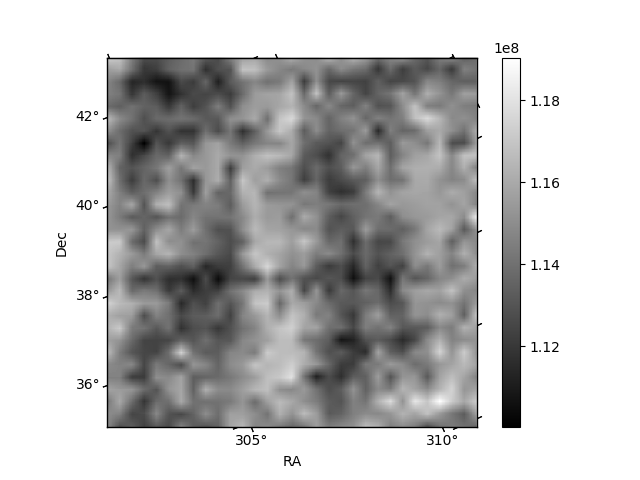
Histogram calculated using DETX and DETY for each event in the final _common_clean file
| Quadrant A | 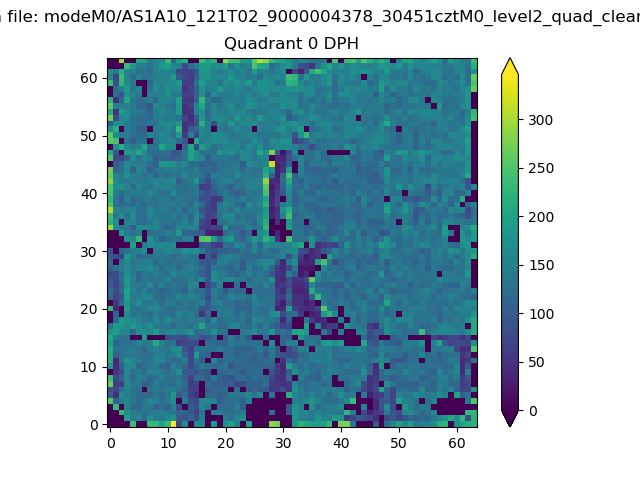 |
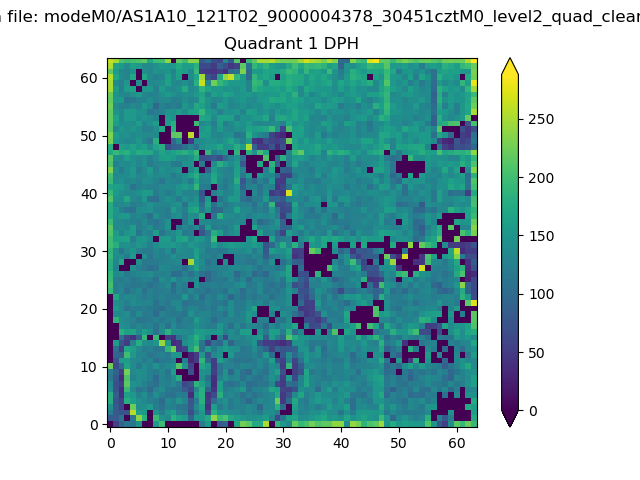 |
Quadrant B |
|---|---|---|---|
| Quadrant D | 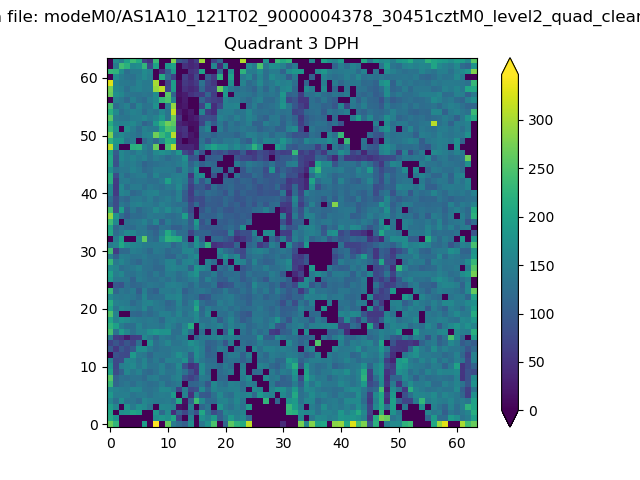 |
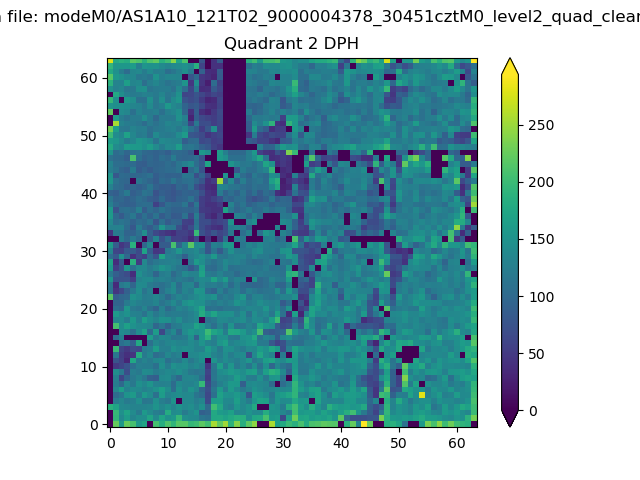 |
Quadrant C |
| Plot type | Count rate plots | Images |
|---|---|---|
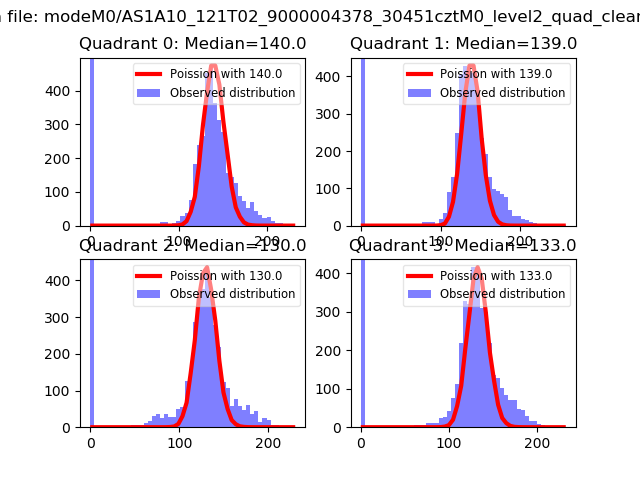
| Comparison with Poisson distribution Blue bars denote a histogram of data divided into 1 sec bins. Red curve is a Poisson curve with rate = median count rate of data. |
 |
 |
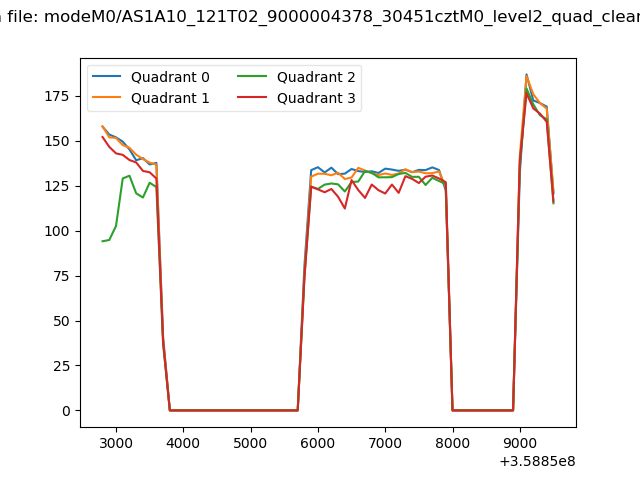
| Quadrant-wise count rates Data is divided into 100 sec bins |
 |
|
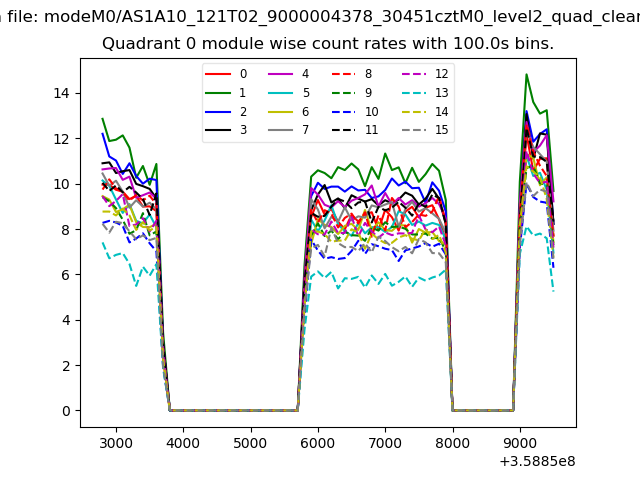
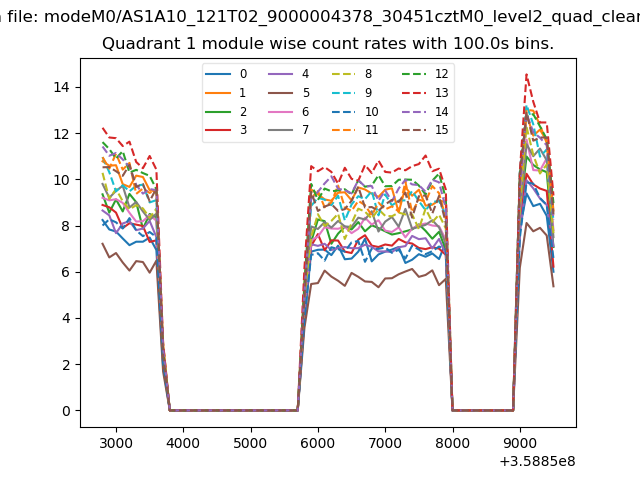
| Module-wise count rates for Quadrant A Data is divided into 100 sec bins |
 |
 |
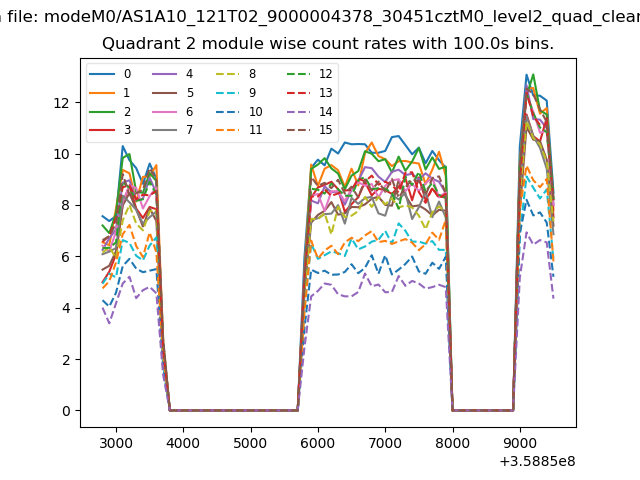
| Module-wise count rates for Quadrant B Data is divided into 100 sec bins |
 |
 |
| Module-wise count rates for Quadrant C Data is divided into 100 sec bins |
 |
 |
| Module-wise count rates for Quadrant D Data is divided into 100 sec bins |
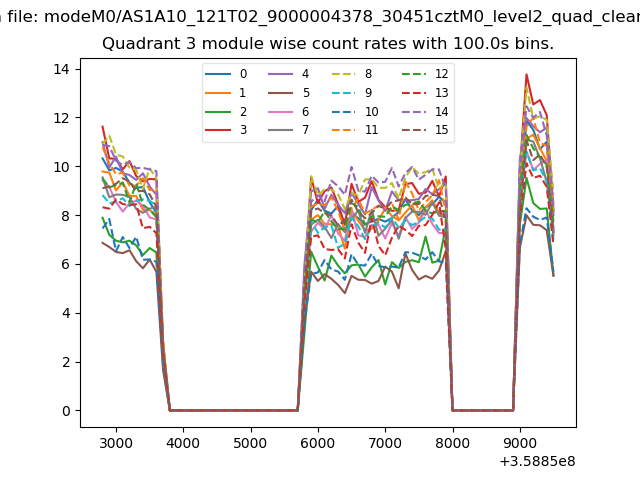 |
 |
| Parameter | Plot |
|---|---|
| CZT HV Monitor | 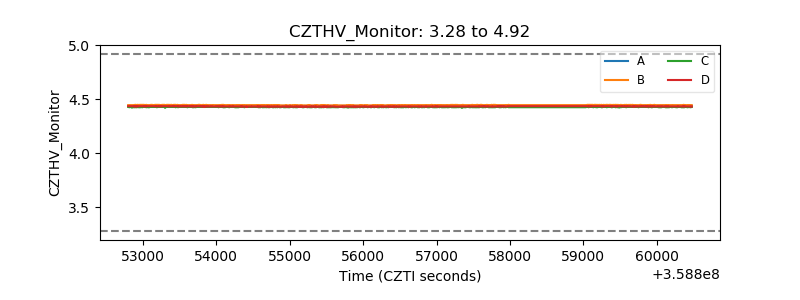 |
| D_VDD | 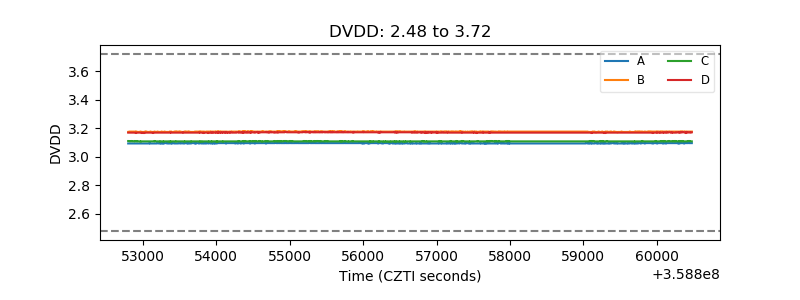 |
| Temperature 1 | 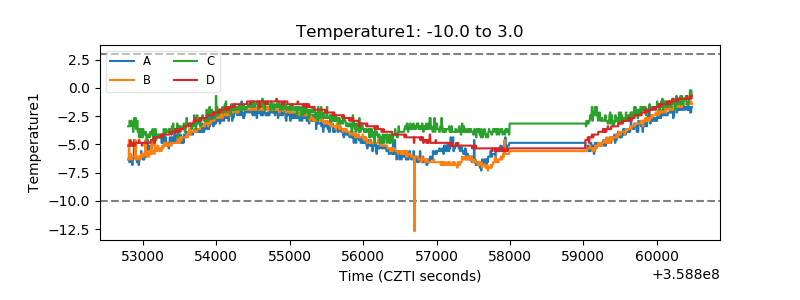 |
| Veto HV Monitor | 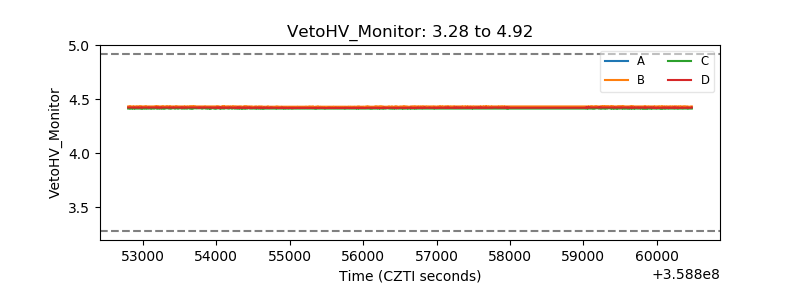 |
| Veto LLD | 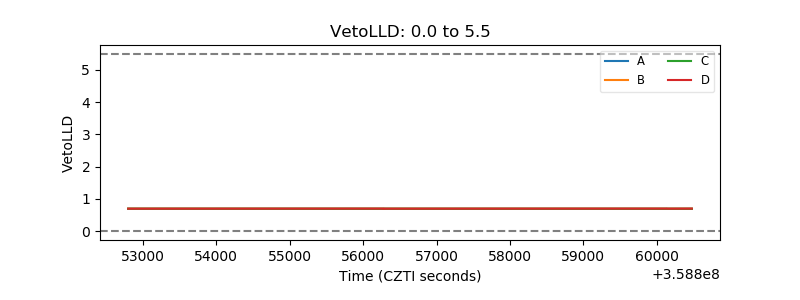 |
| Alpha Counter | 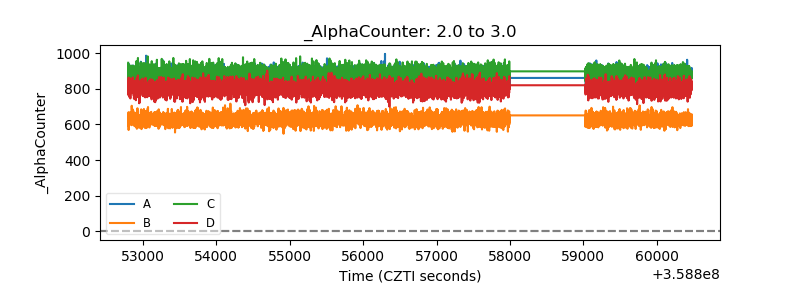 |
| _CPM_Rate | 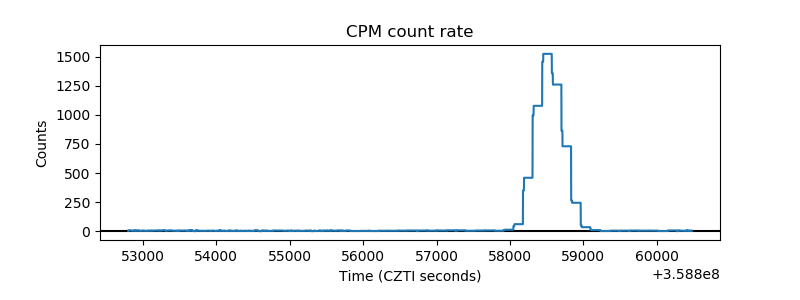 |
| CZT Counter | 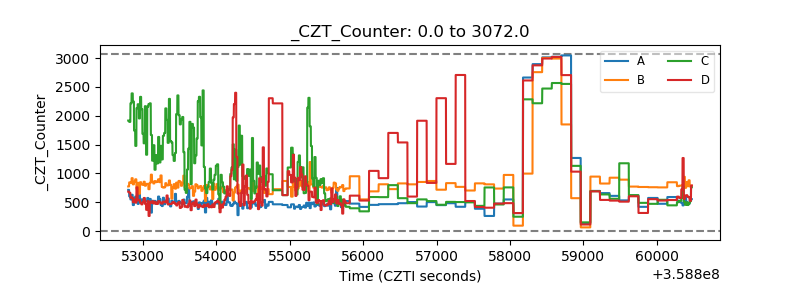 |
| +2.5 Volts monitor |  |
| +5 Volts monitor |  |
| _ROLL_ROT | 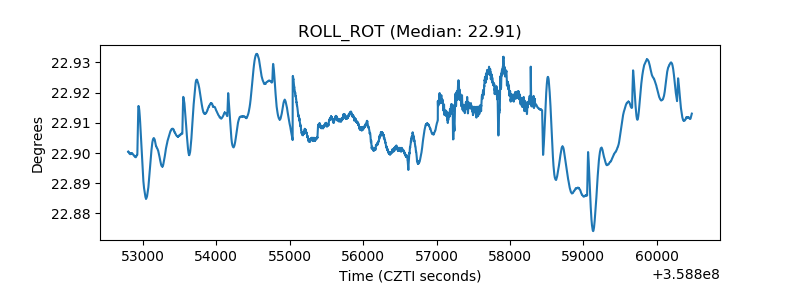 |
| _Roll_DEC | 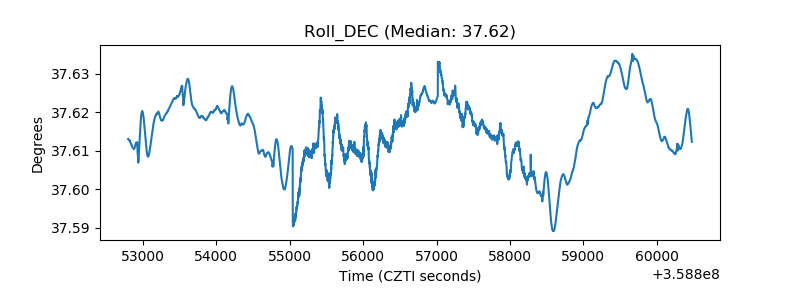 |
| _Roll_RA | 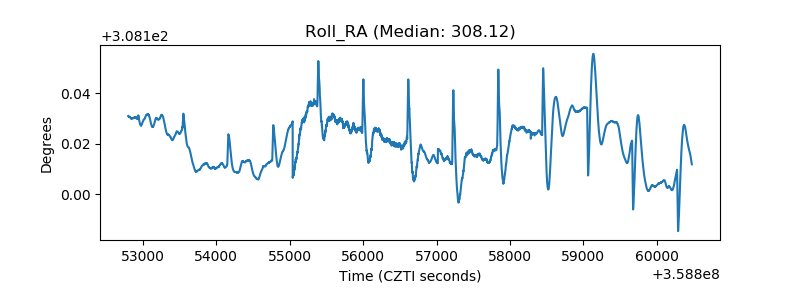 |
| Veto Counter | 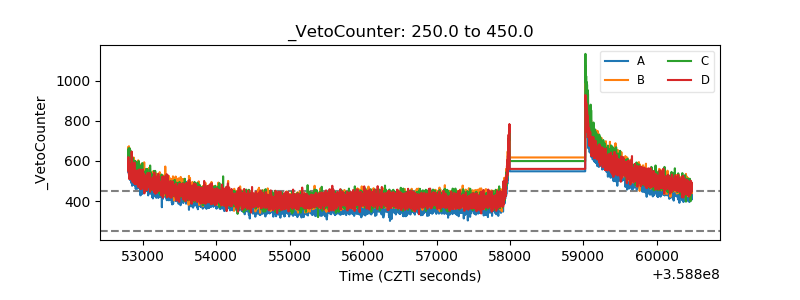 |