| Param | Original file | Final file |
|---|---|---|
| Filename | modeM0/AS1A10_121T02_9000004378_30453cztM0_level2.evt | modeM0/AS1A10_121T02_9000004378_30453cztM0_level2_quad_clean.evt |
| Size (bytes) | 648,236,160 | 70,344,000 |
| Size | 618.2 MB | 67.1 MB |
| Events in quadrant A | 3,456,682 | 436,262 |
| Events in quadrant B | 5,474,091 | 430,900 |
| Events in quadrant C | 3,470,596 | 420,220 |
| Events in quadrant D | 6,792,902 | 390,447 |
| Mode M0 | |||
|---|---|---|---|
| Quadrant | BADHDUFLAG | Total packets | Discarded packets |
| A | 0 | 14326 | 1 |
| B | 0 | 20512 | 1 |
| C | 0 | 14214 | 1 |
| D | 0 | 24545 | 1 |
| Mode SS | |||
|---|---|---|---|
| Quadrant | BADHDUFLAG | Total packets | Discarded packets |
| A | 0 | 132 | 0 |
| B | 0 | 132 | 0 |
| C | 0 | 132 | 0 |
| D | 0 | 132 | 0 |
| Mode M9 | |||
|---|---|---|---|
| Quadrant | BADHDUFLAG | Total packets | Discarded packets |
| A | 0 | 11 | 0 |
| B | 0 | 11 | 0 |
| C | 0 | 11 | 0 |
| D | 0 | 11 | 0 |
| Quadrant | Total seconds | Saturated seconds | Saturation percentage |
|---|---|---|---|
| A | 6475 | 106 | 1.637066% |
| B | 6475 | 148 | 2.285714% |
| C | 6476 | 139 | 2.146387% |
| D | 6476 | 895 | 13.820259% |
Noise dominated data is calculated using 1-second bins in cleaned event files. If a bin has >2000 counts, and if more than 50% of those come from <1% of pixels, then it is considered to be noise-dominated and hence unusable.
| Quadrant | # 1 sec bins | Bins with >0 counts | Bins with >2000 counts | High rate bins dominated by noise | Noise dominated (total time) | Noise dominated (detector-on time) | Marked lightcurve |
|---|---|---|---|---|---|---|---|
| A | 7600 | 6476 | 7 | 7 | 0.09% | 0.11% | 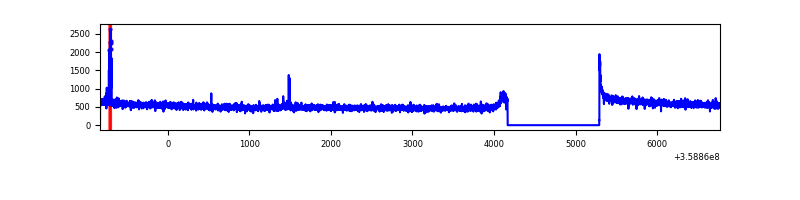 |
| B | 7600 | 6476 | 5 | 5 | 0.07% | 0.08% | 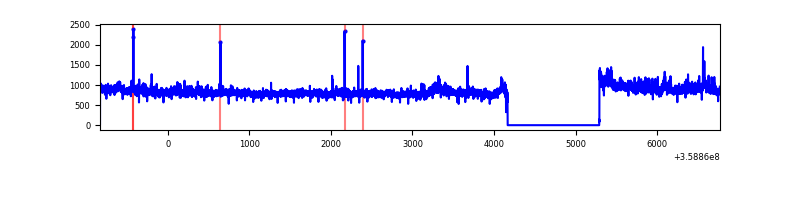 |
| C | 7601 | 6477 | 1 | 1 | 0.01% | 0.02% | 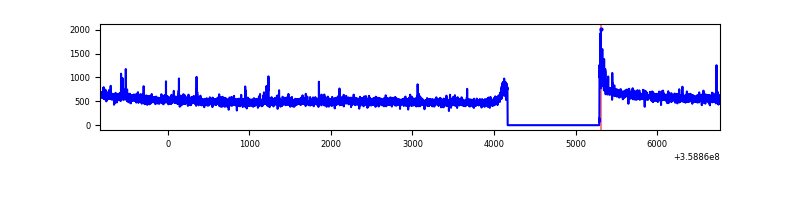 |
| D | 7601 | 6477 | 853 | 853 | 11.22% | 13.17% | 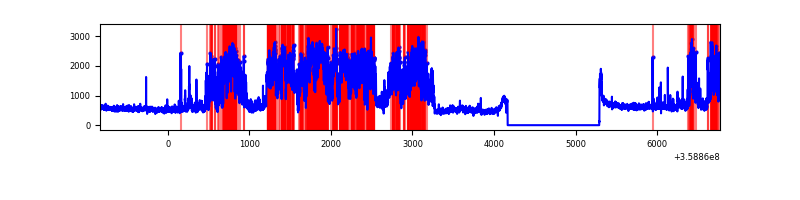 |
Top three noisy pixels from each quadrant. If the there are fewer than three noisy pixels in the level2.evt file, extra rows are filled as -1
| Pixel properties | Quadrant properties | ||||||
|---|---|---|---|---|---|---|---|
| Quadrant | DetID | PixID | Counts | Sigma | Mean | Median | Sigma |
| A | 12 | 96 | 42420 | 240.04 | 881 | 868 | 173.1 |
| A | 8 | 192 | 13357 | 72.15 | 881 | 868 | 173.1 |
| A | 13 | 254 | 12004 | 64.33 | 881 | 868 | 173.1 |
| B | 6 | 159 | 1785222 | 11016.48 | 860 | 841 | 162.0 |
| B | 0 | 229 | 289674 | 1783.21 | 860 | 841 | 162.0 |
| B | 12 | 111 | 19175 | 113.19 | 860 | 841 | 162.0 |
| C | 14 | 238 | 140422 | 728.48 | 833 | 841 | 191.6 |
| C | 3 | 233 | 28728 | 145.54 | 833 | 841 | 191.6 |
| C | 2 | 114 | 15159 | 74.72 | 833 | 841 | 191.6 |
| D | 13 | 104 | 2246293 | 10985.97 | 821 | 804 | 204.4 |
| D | 12 | 227 | 1083702 | 5298.04 | 821 | 804 | 204.4 |
| D | 8 | 195 | 134931 | 656.21 | 821 | 804 | 204.4 |
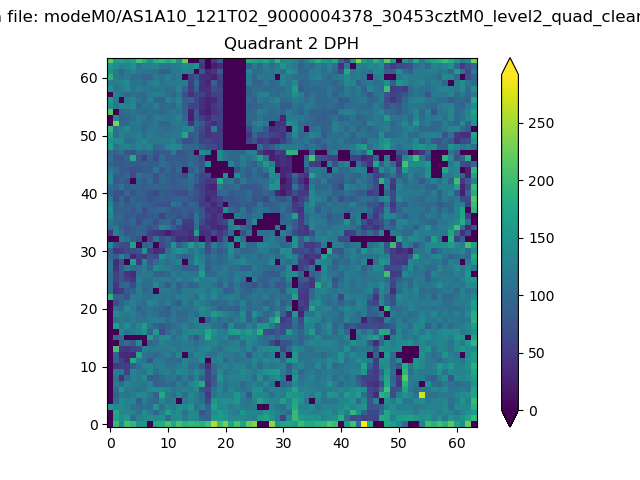
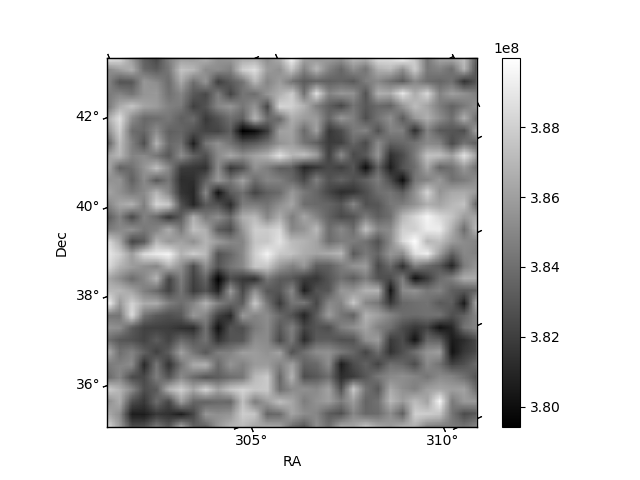
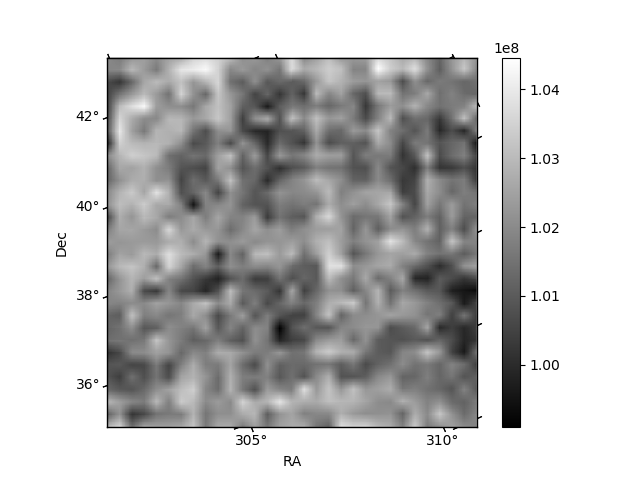
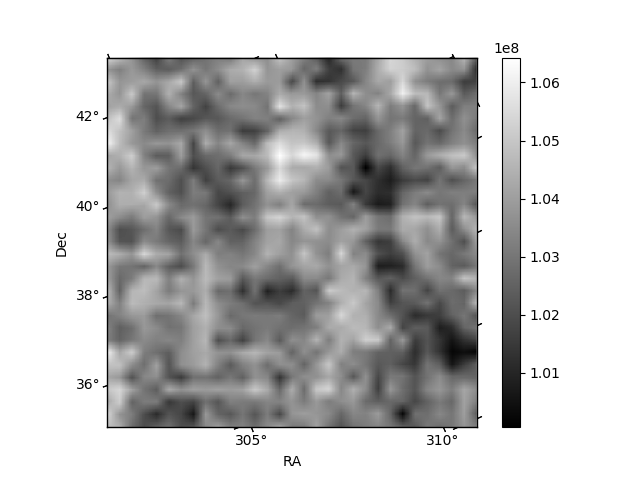
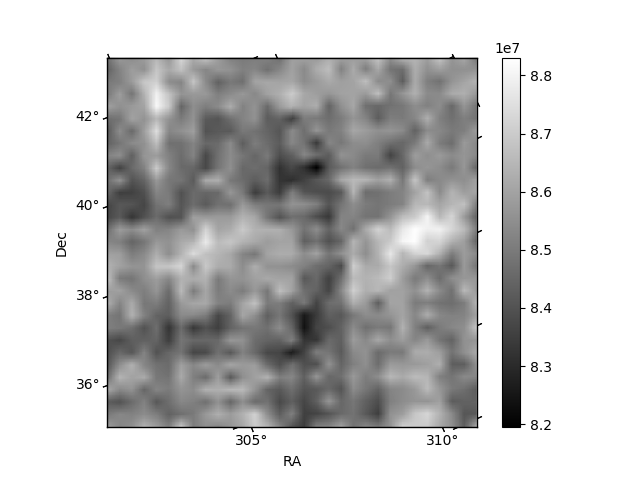
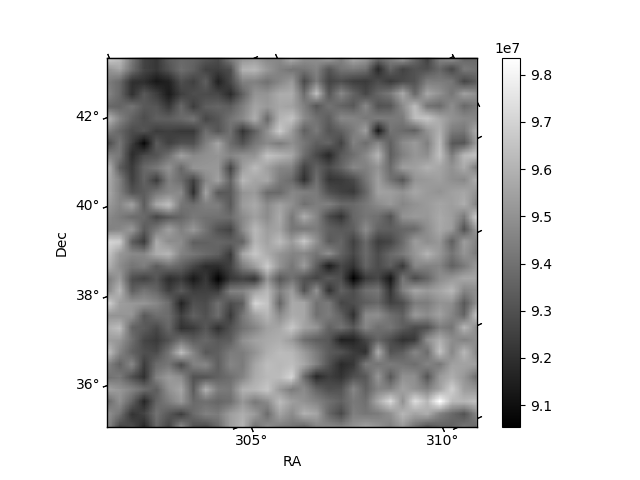
Histogram calculated using DETX and DETY for each event in the final _common_clean file
| Quadrant A | 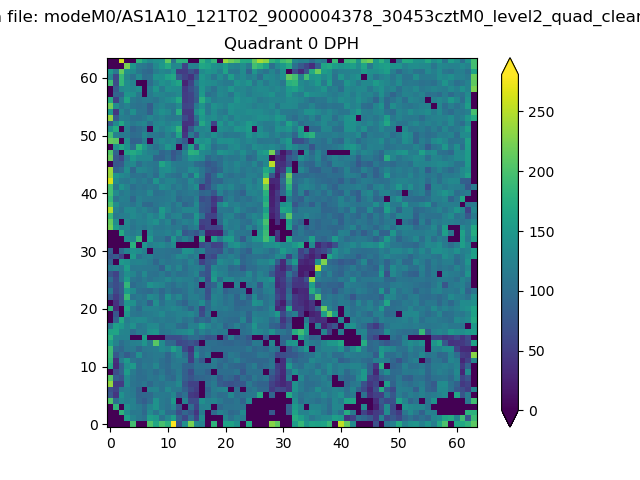 |
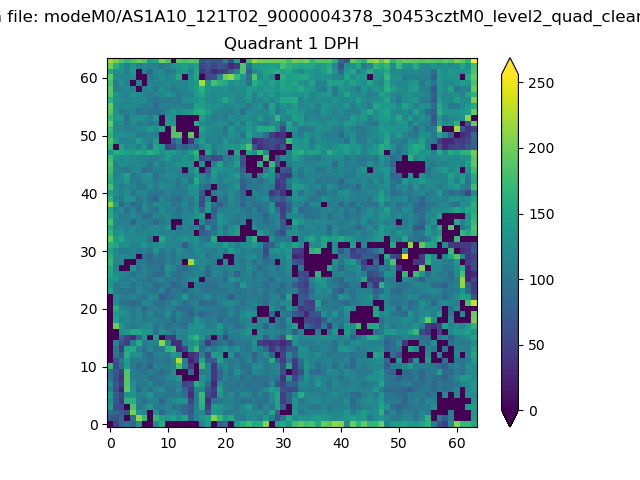 |
Quadrant B |
|---|---|---|---|
| Quadrant D | 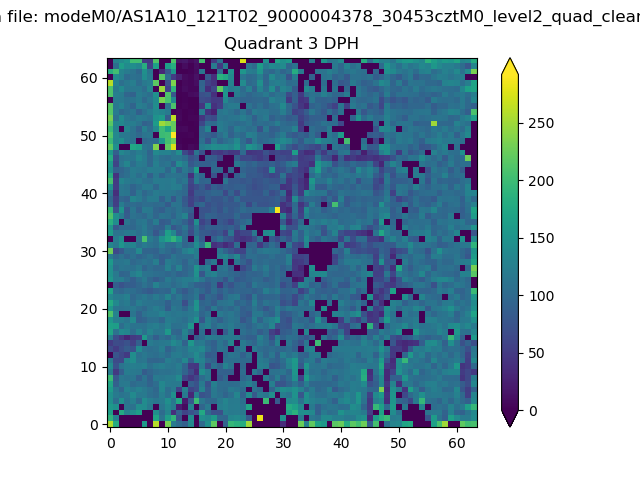 |
 |
Quadrant C |
| Plot type | Count rate plots | Images |
|---|---|---|
| Comparison with Poisson distribution Blue bars denote a histogram of data divided into 1 sec bins. Red curve is a Poisson curve with rate = median count rate of data. |
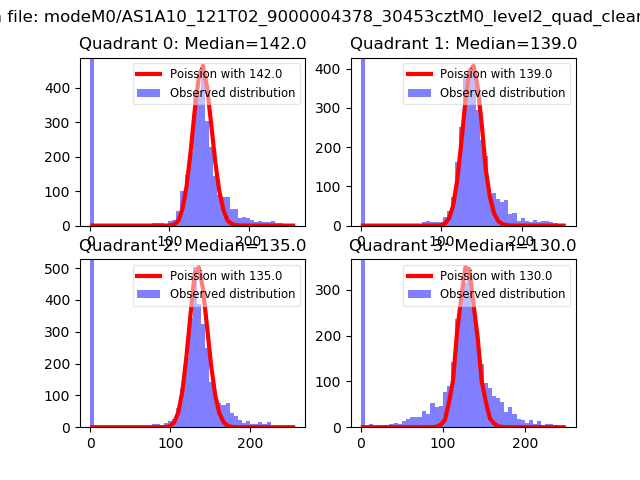 |
 |
| Quadrant-wise count rates Data is divided into 100 sec bins |
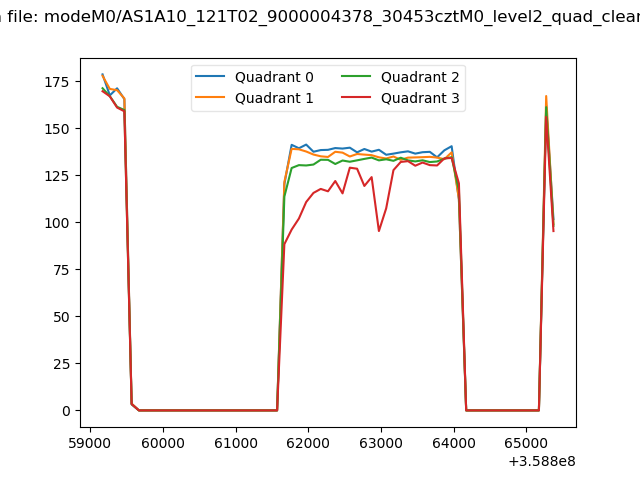 |
|
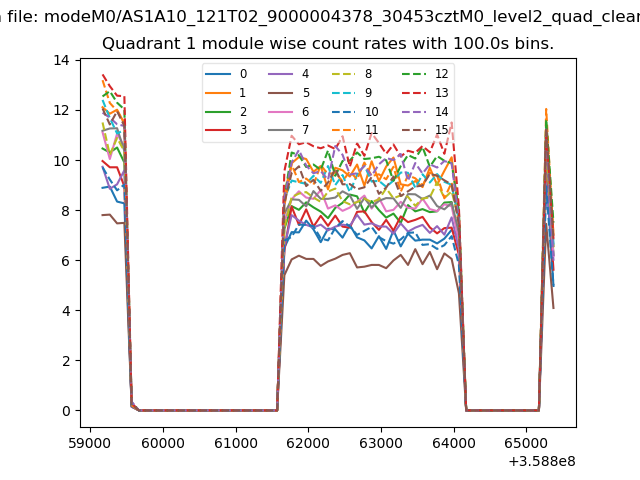
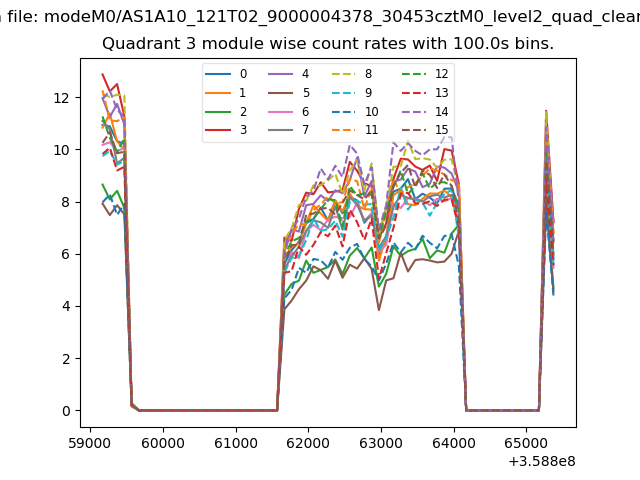
| Module-wise count rates for Quadrant A Data is divided into 100 sec bins |
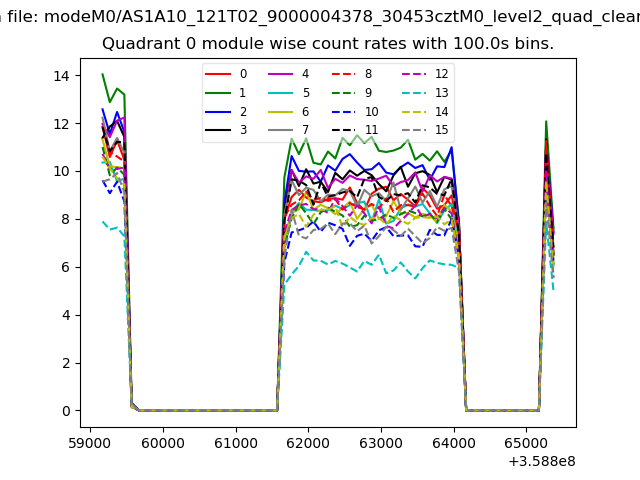 |
 |
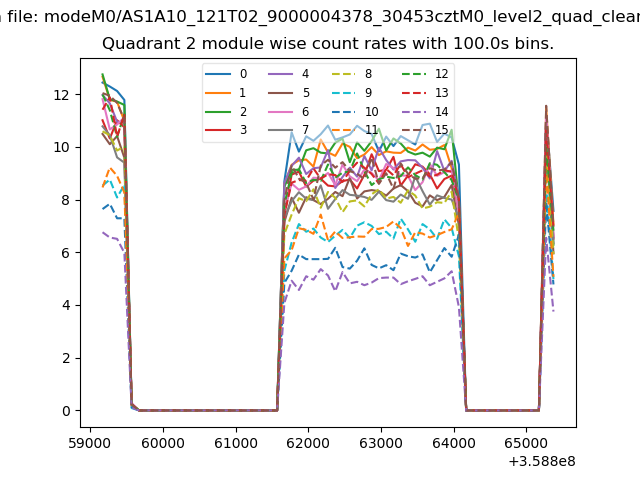
| Module-wise count rates for Quadrant B Data is divided into 100 sec bins |
 |
 |
| Module-wise count rates for Quadrant C Data is divided into 100 sec bins |
 |
 |
| Module-wise count rates for Quadrant D Data is divided into 100 sec bins |
 |
 |
| Parameter | Plot |
|---|---|
| CZT HV Monitor | 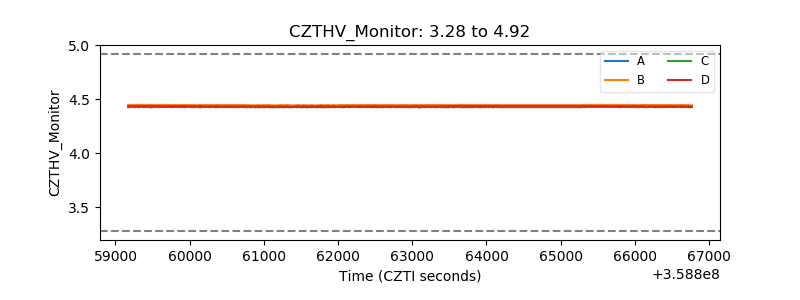 |
| D_VDD | 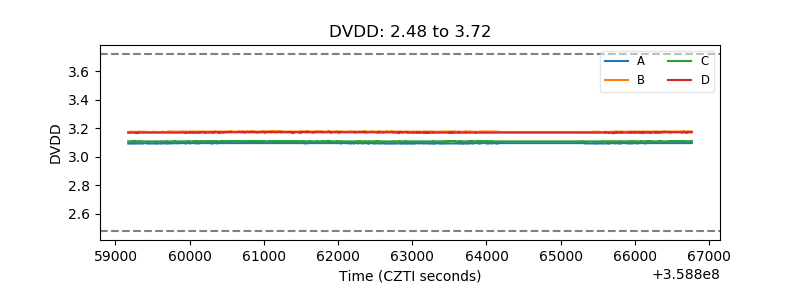 |
| Temperature 1 | 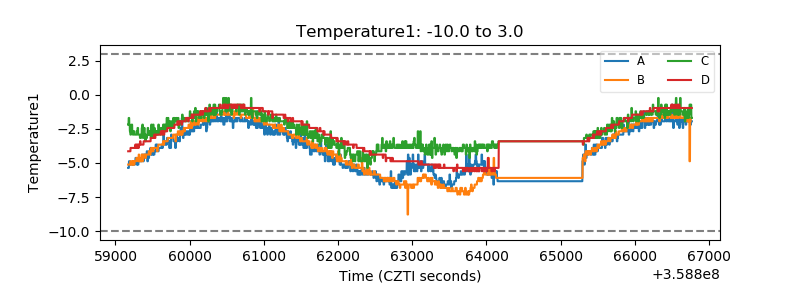 |
| Veto HV Monitor | 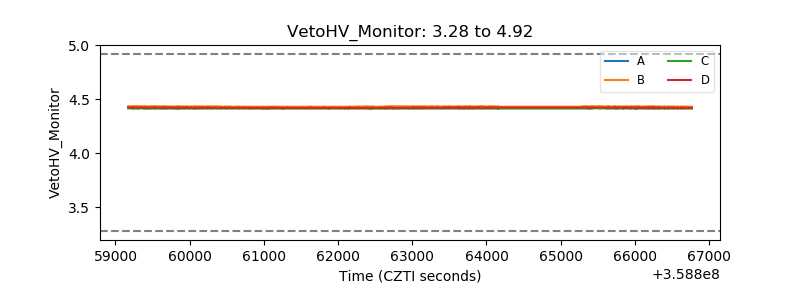 |
| Veto LLD | 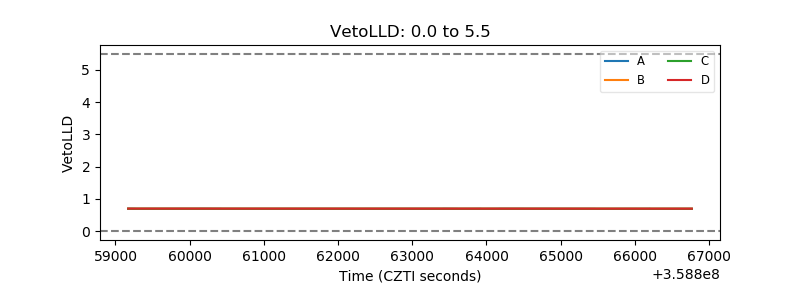 |
| Alpha Counter | 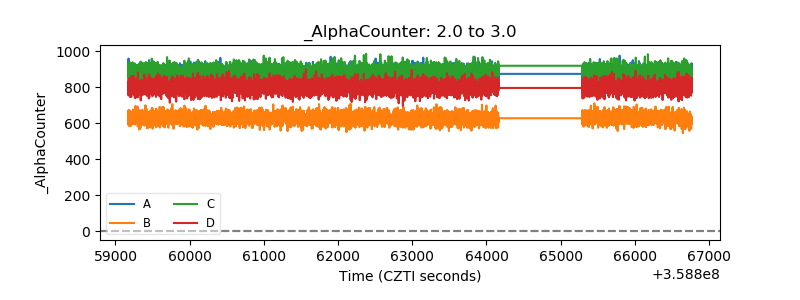 |
| _CPM_Rate | 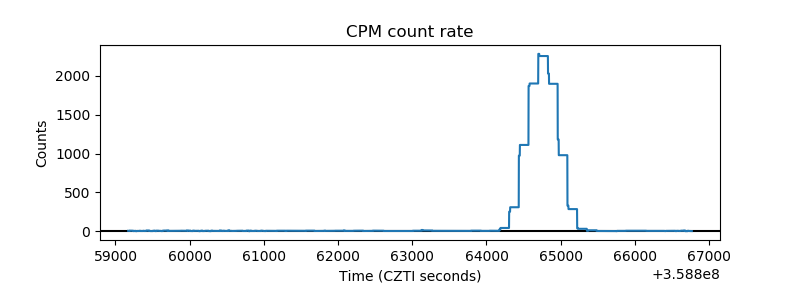 |
| CZT Counter | 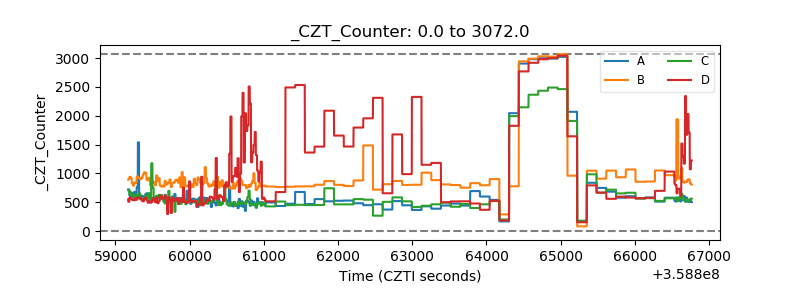 |
| +2.5 Volts monitor |  |
| +5 Volts monitor |  |
| _ROLL_ROT | 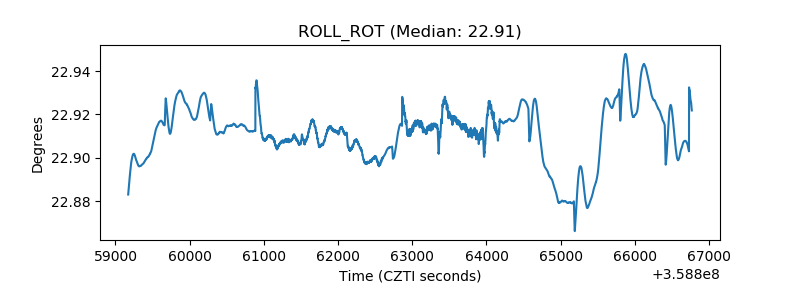 |
| _Roll_DEC | 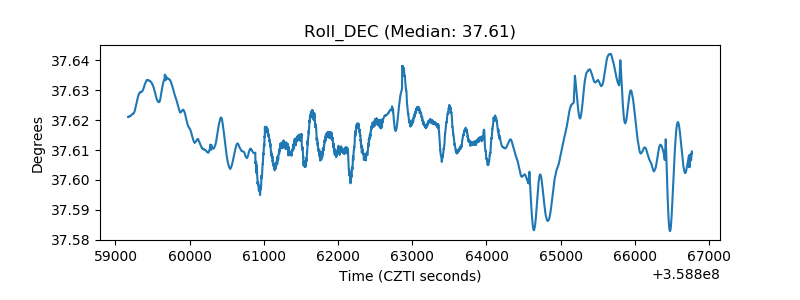 |
| _Roll_RA | 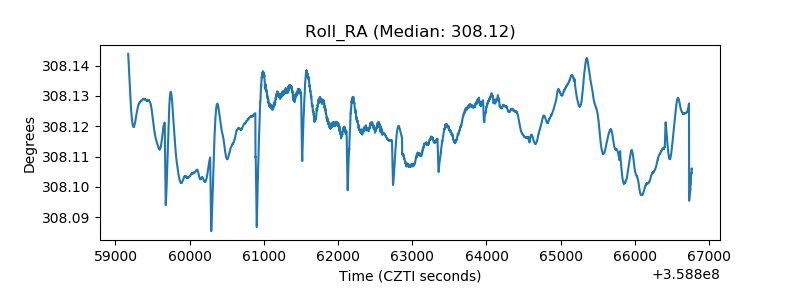 |
| Veto Counter | 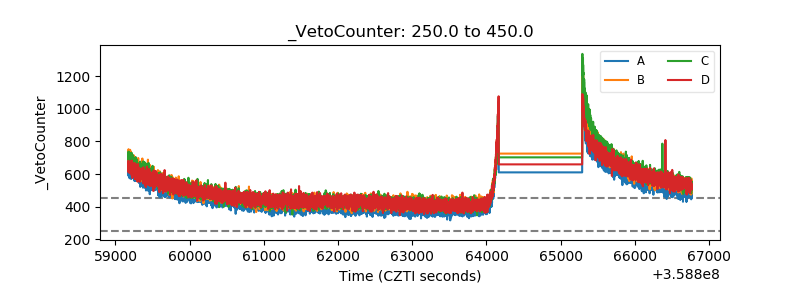 |