| Param | Original file | Final file |
|---|---|---|
| Filename | modeM0/AS1A10_121T02_9000004378_30456cztM0_level2.evt | modeM0/AS1A10_121T02_9000004378_30456cztM0_level2_quad_clean.evt |
| Size (bytes) | 626,777,280 | 87,900,480 |
| Size | 597.7 MB | 83.8 MB |
| Events in quadrant A | 3,539,957 | 570,270 |
| Events in quadrant B | 5,338,466 | 567,367 |
| Events in quadrant C | 3,740,299 | 558,438 |
| Events in quadrant D | 5,946,938 | 535,274 |
| Mode M0 | |||
|---|---|---|---|
| Quadrant | BADHDUFLAG | Total packets | Discarded packets |
| A | 0 | 14609 | 2 |
| B | 0 | 19874 | 3 |
| C | 0 | 15360 | 2 |
| D | 0 | 22045 | 2 |
| Mode SS | |||
|---|---|---|---|
| Quadrant | BADHDUFLAG | Total packets | Discarded packets |
| A | 0 | 124 | 0 |
| B | 0 | 124 | 0 |
| C | 0 | 124 | 0 |
| D | 0 | 124 | 0 |
| Mode M9 | |||
|---|---|---|---|
| Quadrant | BADHDUFLAG | Total packets | Discarded packets |
| A | 0 | 22 | 0 |
| B | 0 | 23 | 0 |
| C | 0 | 23 | 0 |
| D | 0 | 23 | 0 |
| Quadrant | Total seconds | Saturated seconds | Saturation percentage |
|---|---|---|---|
| A | 6171 | 115 | 1.863555% |
| B | 6170 | 183 | 2.965964% |
| C | 6170 | 237 | 3.841167% |
| D | 6170 | 638 | 10.340357% |
Noise dominated data is calculated using 1-second bins in cleaned event files. If a bin has >2000 counts, and if more than 50% of those come from <1% of pixels, then it is considered to be noise-dominated and hence unusable.
| Quadrant | # 1 sec bins | Bins with >0 counts | Bins with >2000 counts | High rate bins dominated by noise | Noise dominated (total time) | Noise dominated (detector-on time) | Marked lightcurve |
|---|---|---|---|---|---|---|---|
| A | 7481 | 6172 | 7 | 7 | 0.09% | 0.11% | 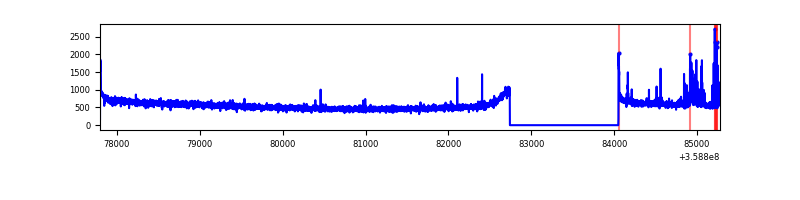 |
| B | 7480 | 6171 | 15 | 15 | 0.20% | 0.24% | 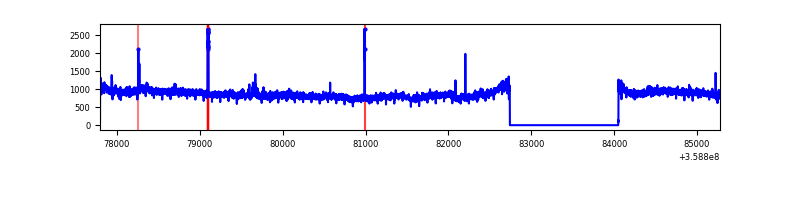 |
| C | 7480 | 6171 | 18 | 18 | 0.24% | 0.29% | 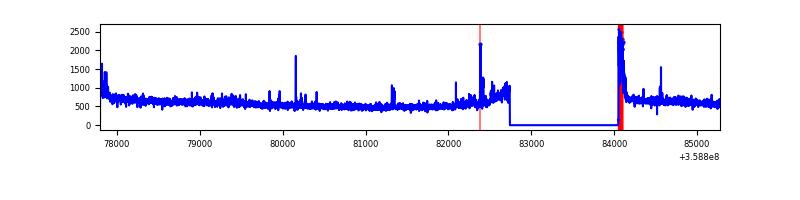 |
| D | 7480 | 6171 | 389 | 389 | 5.20% | 6.30% | 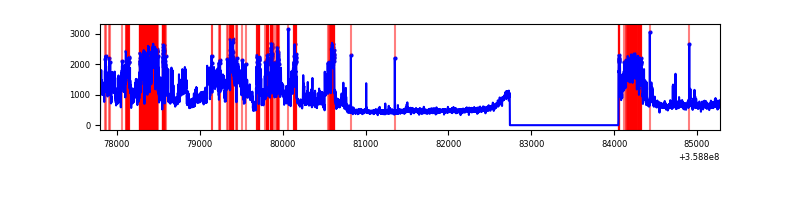 |
Top three noisy pixels from each quadrant. If the there are fewer than three noisy pixels in the level2.evt file, extra rows are filled as -1
| Pixel properties | Quadrant properties | ||||||
|---|---|---|---|---|---|---|---|
| Quadrant | DetID | PixID | Counts | Sigma | Mean | Median | Sigma |
| A | 4 | 2 | 107721 | 612.77 | 883 | 869 | 174.4 |
| A | 8 | 192 | 22544 | 124.3 | 883 | 869 | 174.4 |
| A | 13 | 254 | 11446 | 60.66 | 883 | 869 | 174.4 |
| B | 6 | 159 | 1759246 | 10825.0 | 869 | 850 | 162.4 |
| B | 0 | 229 | 116727 | 713.36 | 869 | 850 | 162.4 |
| B | 6 | 36 | 26293 | 156.63 | 869 | 850 | 162.4 |
| C | 14 | 238 | 140409 | 713.73 | 855 | 866 | 195.5 |
| C | 3 | 233 | 123970 | 629.65 | 855 | 866 | 195.5 |
| C | 0 | 10 | 94591 | 479.38 | 855 | 866 | 195.5 |
| D | 13 | 104 | 2498707 | 12625.92 | 846 | 826 | 197.8 |
| D | 8 | 195 | 113311 | 568.57 | 846 | 826 | 197.8 |
| D | 12 | 227 | 63122 | 314.88 | 846 | 826 | 197.8 |
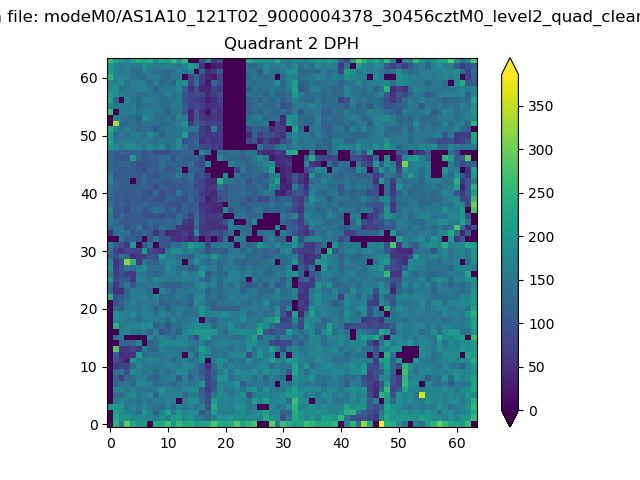
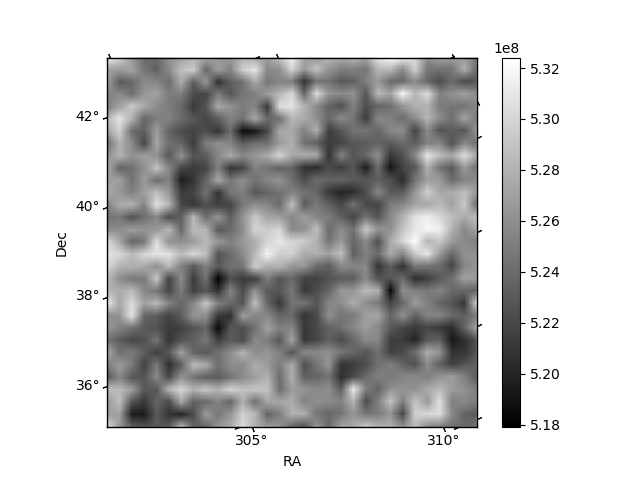
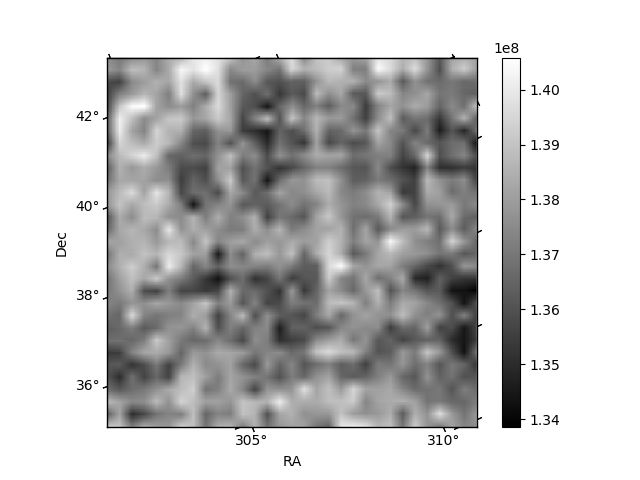
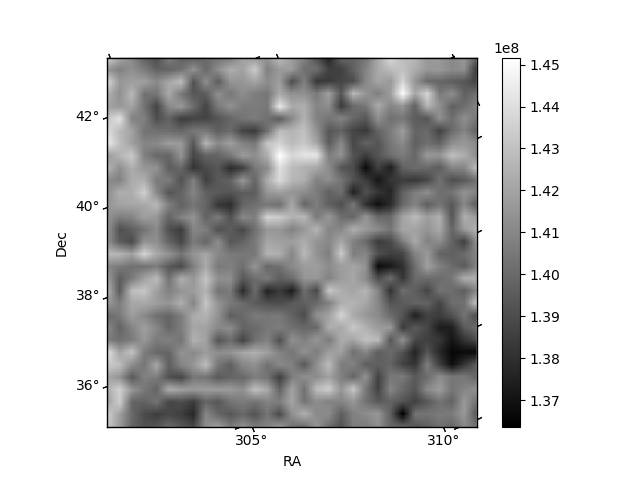
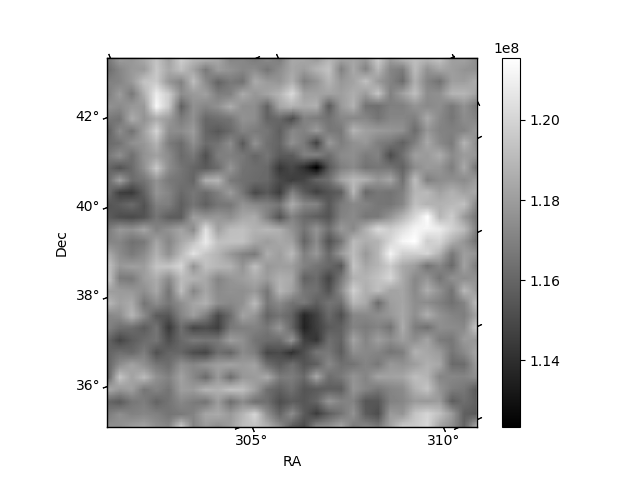
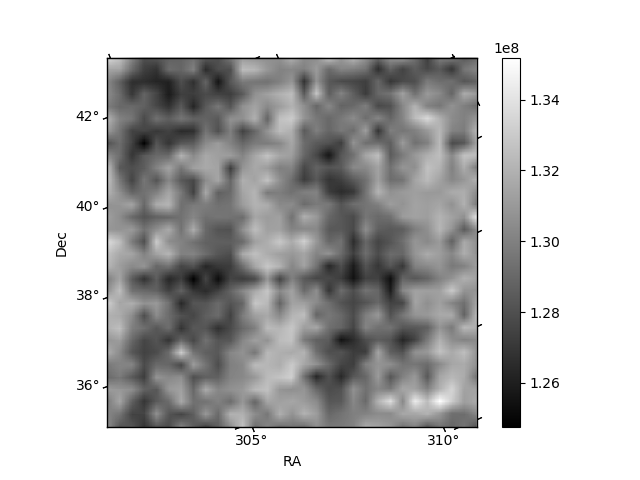
Histogram calculated using DETX and DETY for each event in the final _common_clean file
| Quadrant A | 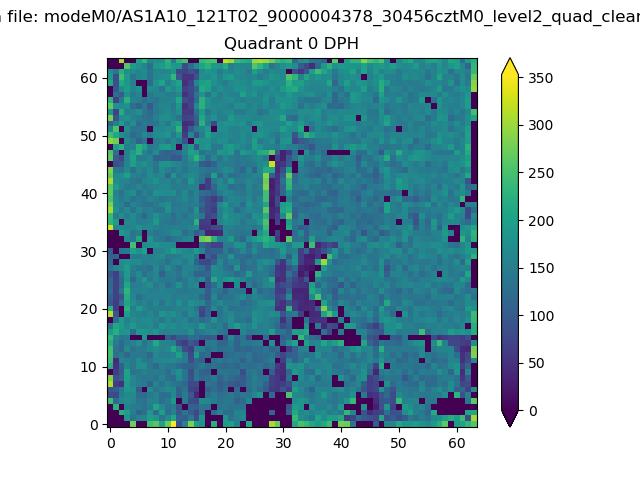 |
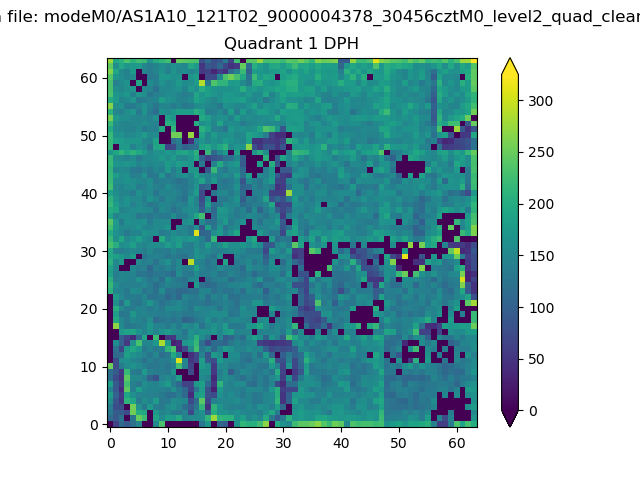 |
Quadrant B |
|---|---|---|---|
| Quadrant D | 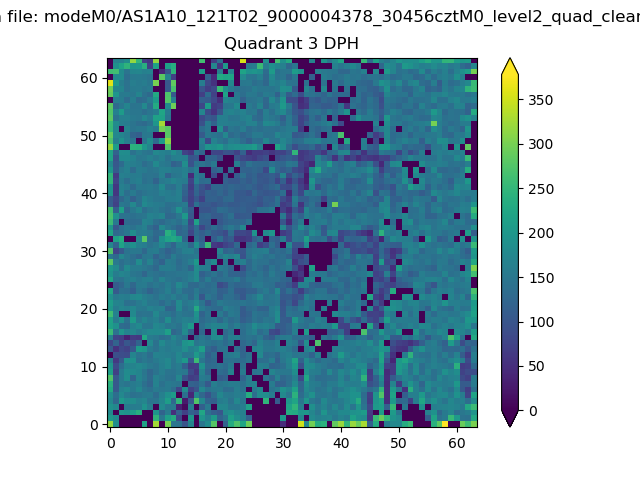 |
 |
Quadrant C |
| Plot type | Count rate plots | Images |
|---|---|---|
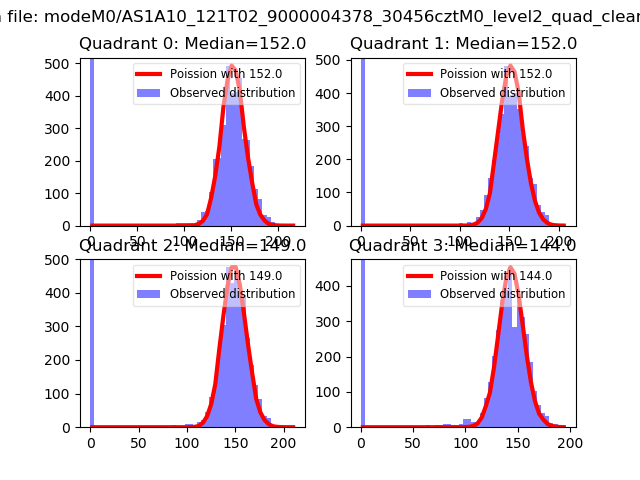
| Comparison with Poisson distribution Blue bars denote a histogram of data divided into 1 sec bins. Red curve is a Poisson curve with rate = median count rate of data. |
 |
 |
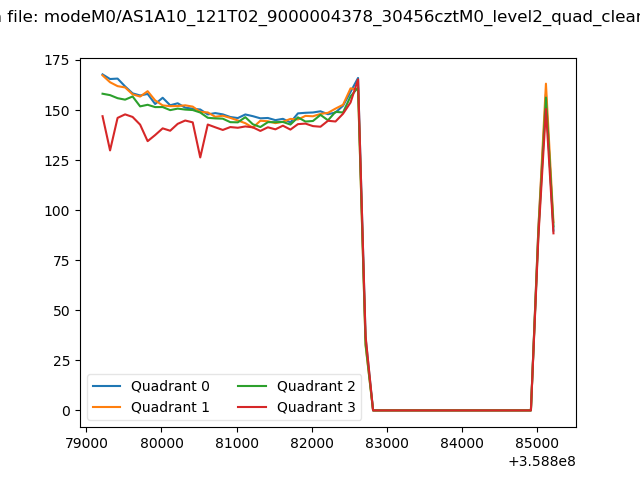
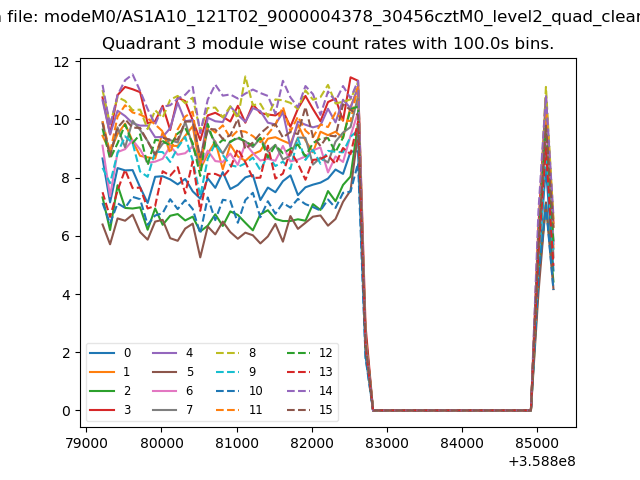
| Quadrant-wise count rates Data is divided into 100 sec bins |
 |
|
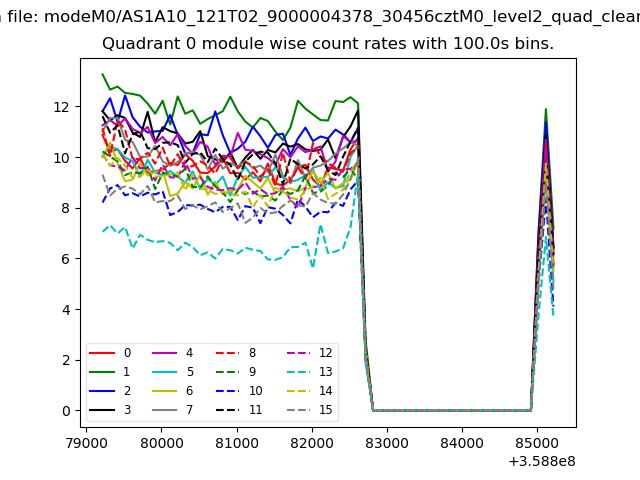
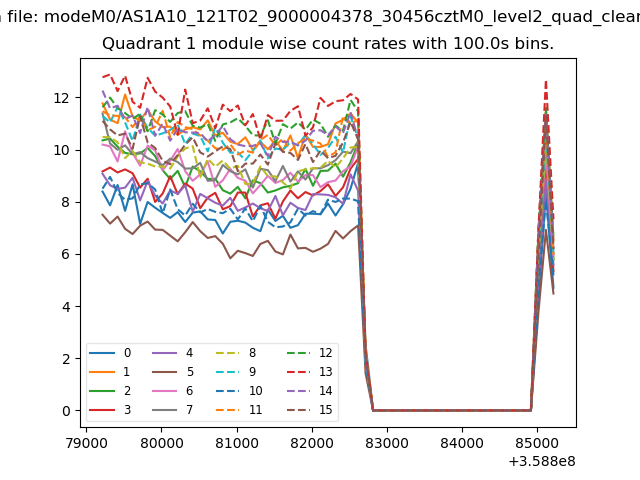
| Module-wise count rates for Quadrant A Data is divided into 100 sec bins |
 |
 |
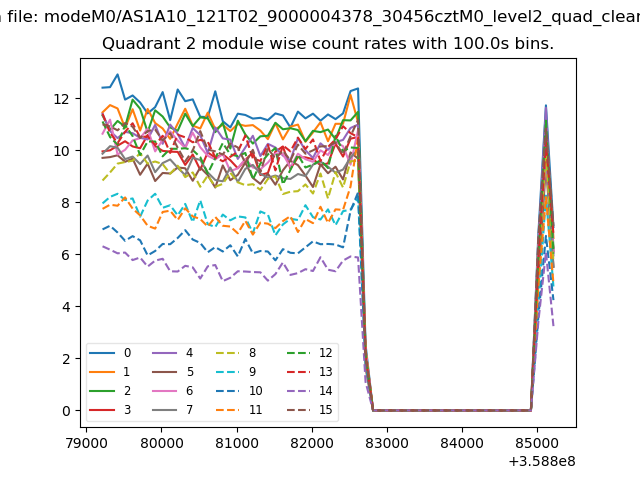
| Module-wise count rates for Quadrant B Data is divided into 100 sec bins |
 |
 |
| Module-wise count rates for Quadrant C Data is divided into 100 sec bins |
 |
 |
| Module-wise count rates for Quadrant D Data is divided into 100 sec bins |
 |
 |
| Parameter | Plot |
|---|---|
| CZT HV Monitor | 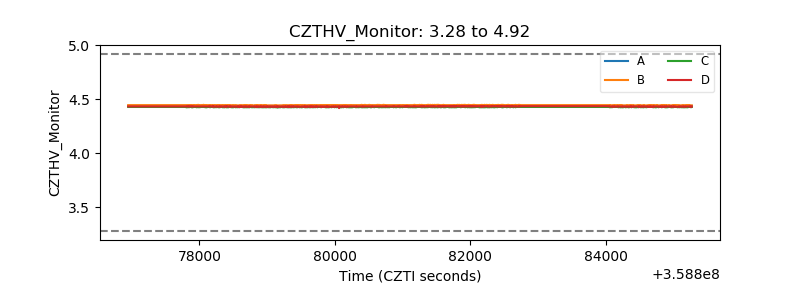 |
| D_VDD | 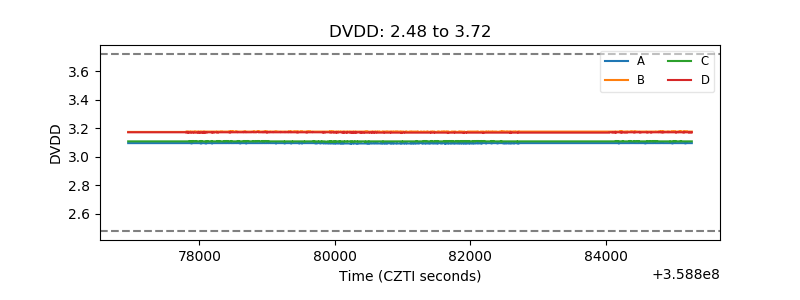 |
| Temperature 1 | 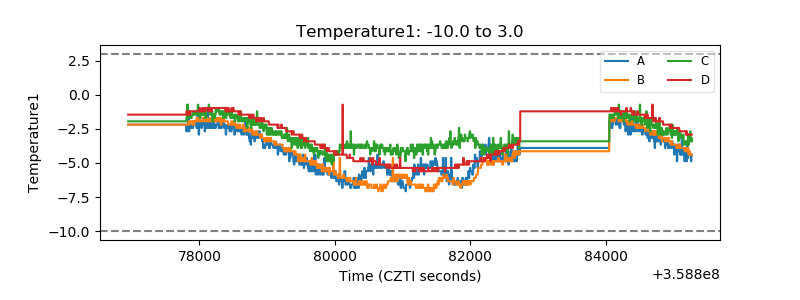 |
| Veto HV Monitor | 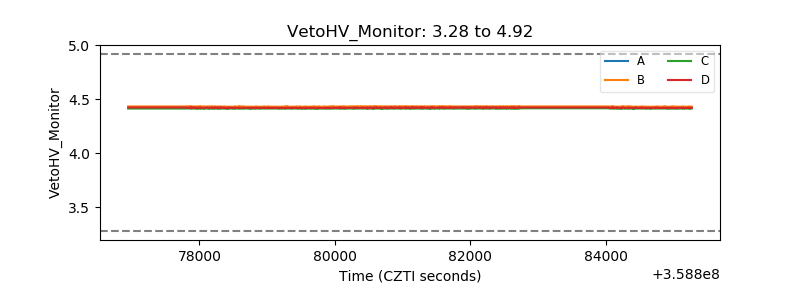 |
| Veto LLD | 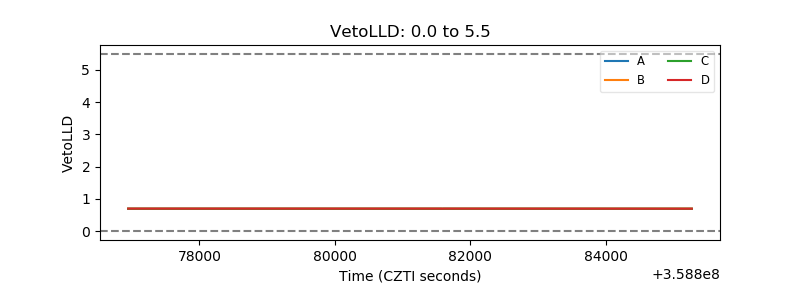 |
| Alpha Counter | 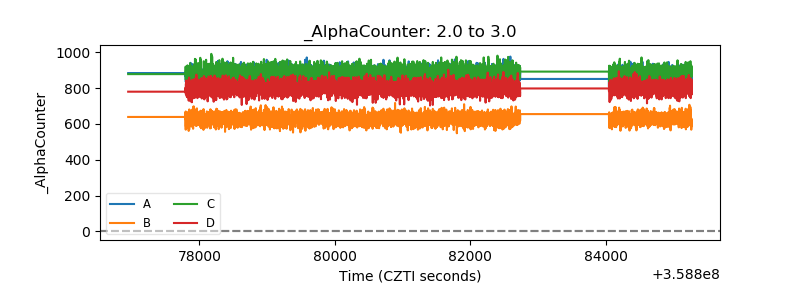 |
| _CPM_Rate | 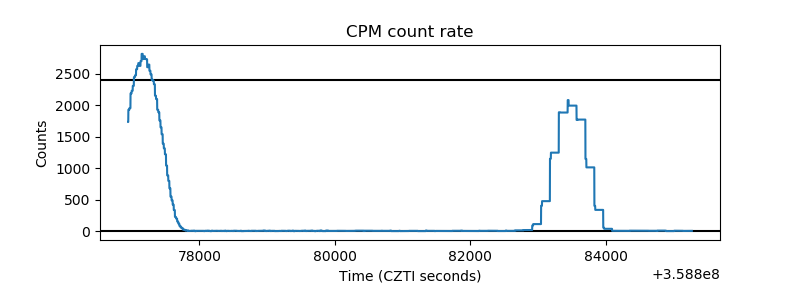 |
| CZT Counter | 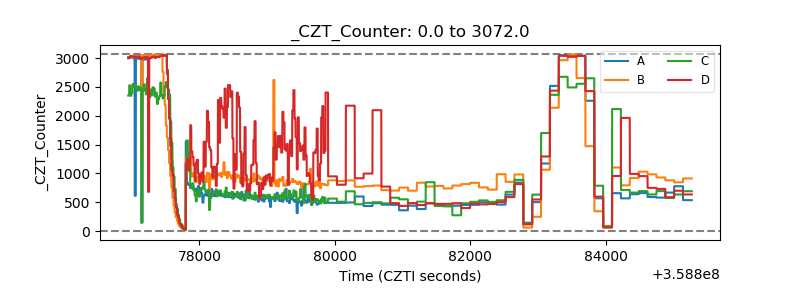 |
| +2.5 Volts monitor |  |
| +5 Volts monitor |  |
| _ROLL_ROT | 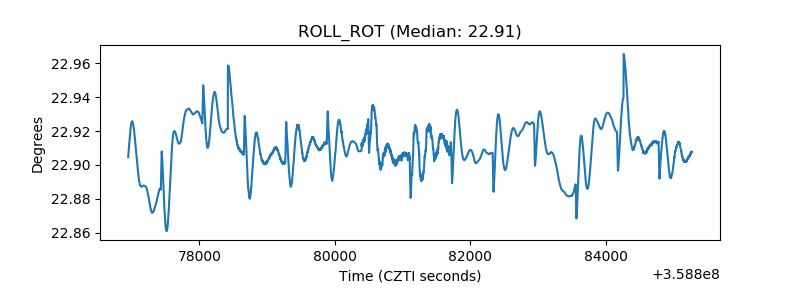 |
| _Roll_DEC | 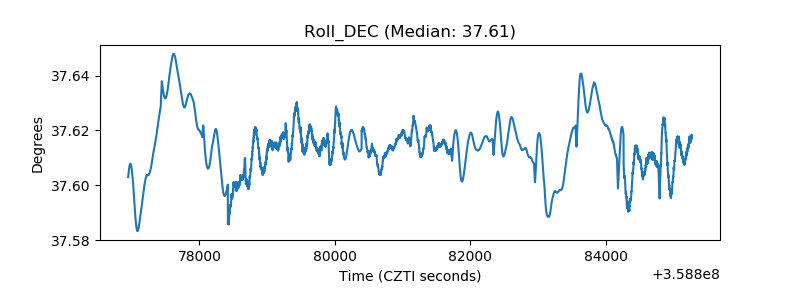 |
| _Roll_RA | 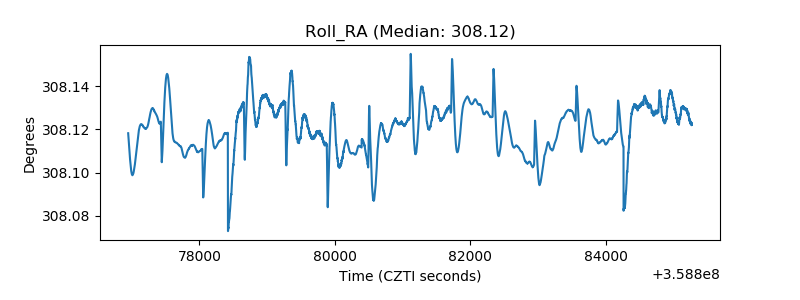 |
| Veto Counter | 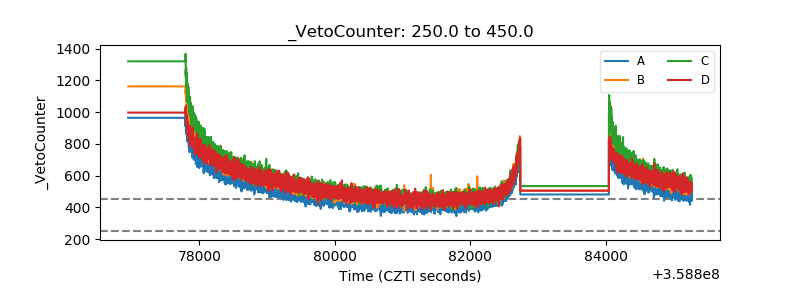 |