| Param | Original file | Final file |
|---|---|---|
| Filename | modeM0/AS1A10_121T02_9000004378_30457cztM0_level2.evt | modeM0/AS1A10_121T02_9000004378_30457cztM0_level2_quad_clean.evt |
| Size (bytes) | 555,321,600 | 97,718,400 |
| Size | 529.6 MB | 93.2 MB |
| Events in quadrant A | 3,238,473 | 644,386 |
| Events in quadrant B | 5,061,909 | 642,358 |
| Events in quadrant C | 3,394,531 | 632,715 |
| Events in quadrant D | 4,713,155 | 616,895 |
| Mode M0 | |||
|---|---|---|---|
| Quadrant | BADHDUFLAG | Total packets | Discarded packets |
| A | 0 | 13429 | 1 |
| B | 0 | 18859 | 2 |
| C | 0 | 13906 | 1 |
| D | 0 | 18358 | 1 |
| Mode SS | |||
|---|---|---|---|
| Quadrant | BADHDUFLAG | Total packets | Discarded packets |
| A | 0 | 124 | 0 |
| B | 0 | 124 | 0 |
| C | 0 | 124 | 0 |
| D | 0 | 124 | 0 |
| Mode M9 | |||
|---|---|---|---|
| Quadrant | BADHDUFLAG | Total packets | Discarded packets |
| A | 0 | 12 | 0 |
| B | 0 | 12 | 0 |
| C | 0 | 12 | 0 |
| D | 0 | 12 | 0 |
| Quadrant | Total seconds | Saturated seconds | Saturation percentage |
|---|---|---|---|
| A | 6056 | 66 | 1.089828% |
| B | 6056 | 136 | 2.245707% |
| C | 6056 | 155 | 2.559445% |
| D | 6056 | 189 | 3.120872% |
Noise dominated data is calculated using 1-second bins in cleaned event files. If a bin has >2000 counts, and if more than 50% of those come from <1% of pixels, then it is considered to be noise-dominated and hence unusable.
| Quadrant | # 1 sec bins | Bins with >0 counts | Bins with >2000 counts | High rate bins dominated by noise | Noise dominated (total time) | Noise dominated (detector-on time) | Marked lightcurve |
|---|---|---|---|---|---|---|---|
| A | 7276 | 6057 | 9 | 9 | 0.12% | 0.15% | 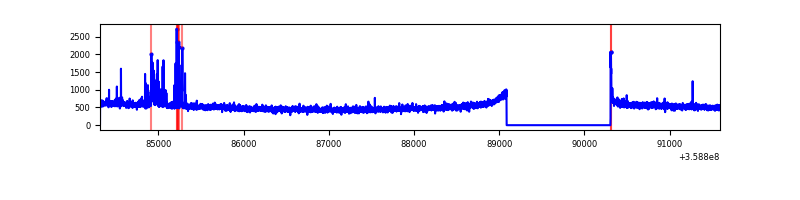 |
| B | 7276 | 6057 | 4 | 4 | 0.05% | 0.07% | 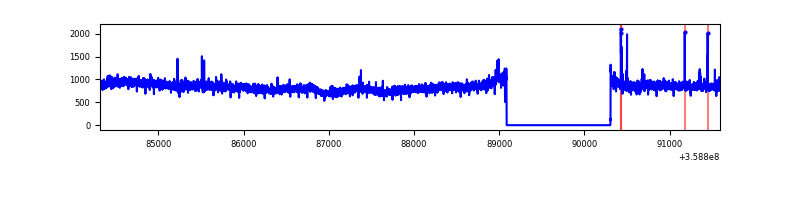 |
| C | 7276 | 6057 | 11 | 11 | 0.15% | 0.18% | 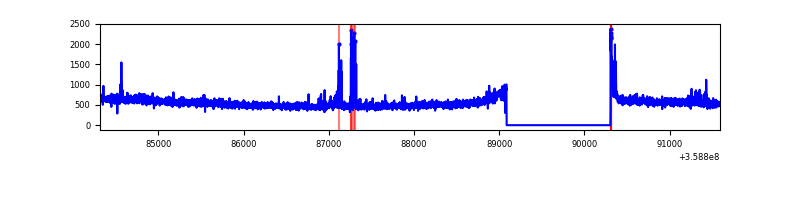 |
| D | 7276 | 6057 | 87 | 87 | 1.20% | 1.44% | 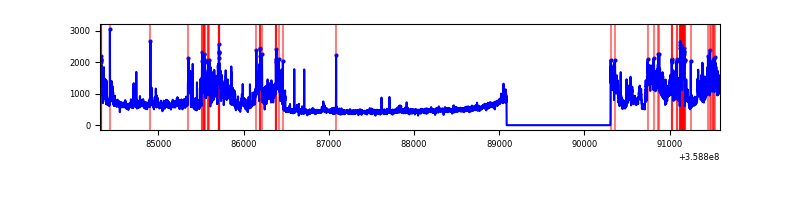 |
Top three noisy pixels from each quadrant. If the there are fewer than three noisy pixels in the level2.evt file, extra rows are filled as -1
| Pixel properties | Quadrant properties | ||||||
|---|---|---|---|---|---|---|---|
| Quadrant | DetID | PixID | Counts | Sigma | Mean | Median | Sigma |
| A | 4 | 2 | 117921 | 729.38 | 805 | 789 | 160.6 |
| A | 8 | 192 | 11567 | 67.11 | 805 | 789 | 160.6 |
| A | 13 | 254 | 11512 | 66.77 | 805 | 789 | 160.6 |
| B | 6 | 159 | 1793502 | 11896.41 | 799 | 782 | 150.7 |
| B | 0 | 229 | 96454 | 634.88 | 799 | 782 | 150.7 |
| B | 5 | 255 | 23832 | 152.96 | 799 | 782 | 150.7 |
| C | 14 | 238 | 135468 | 741.53 | 785 | 790 | 181.6 |
| C | 9 | 54 | 74597 | 406.38 | 785 | 790 | 181.6 |
| C | 0 | 10 | 46679 | 252.66 | 785 | 790 | 181.6 |
| D | 13 | 104 | 1360889 | 6771.15 | 779 | 765 | 200.9 |
| D | 12 | 227 | 210138 | 1042.33 | 779 | 765 | 200.9 |
| D | 8 | 195 | 141875 | 702.49 | 779 | 765 | 200.9 |
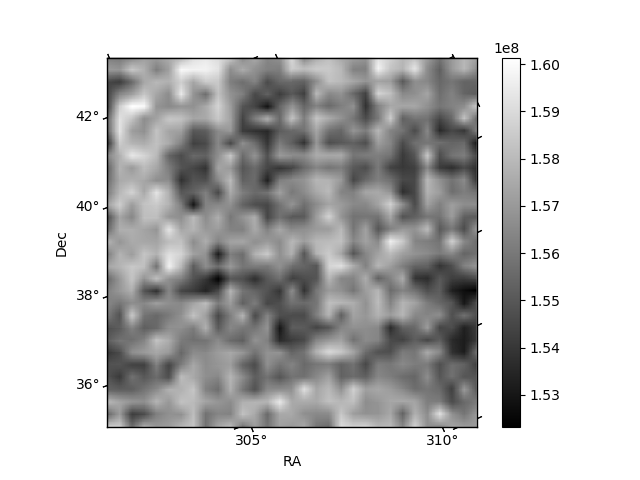
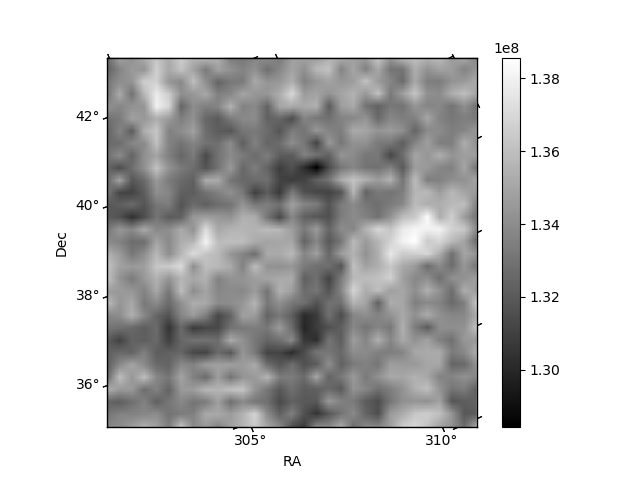
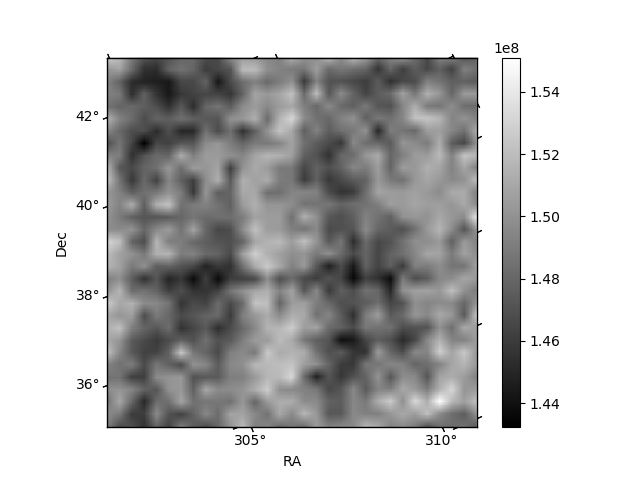
Histogram calculated using DETX and DETY for each event in the final _common_clean file
| Quadrant A |  |
 |
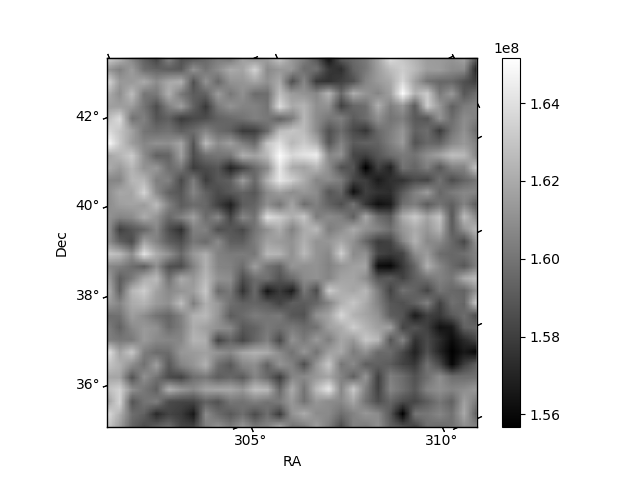
Quadrant B |
|---|---|---|---|
| Quadrant D | 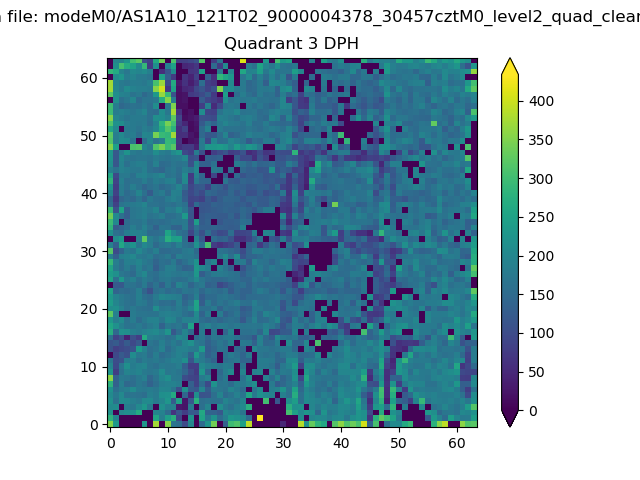 |
 |
Quadrant C |
| Plot type | Count rate plots | Images |
|---|---|---|
| Comparison with Poisson distribution Blue bars denote a histogram of data divided into 1 sec bins. Red curve is a Poisson curve with rate = median count rate of data. |
 |
 |
| Quadrant-wise count rates Data is divided into 100 sec bins |
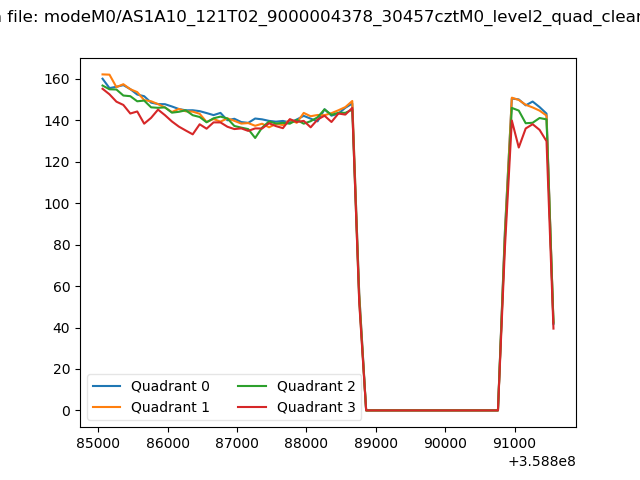 |
|
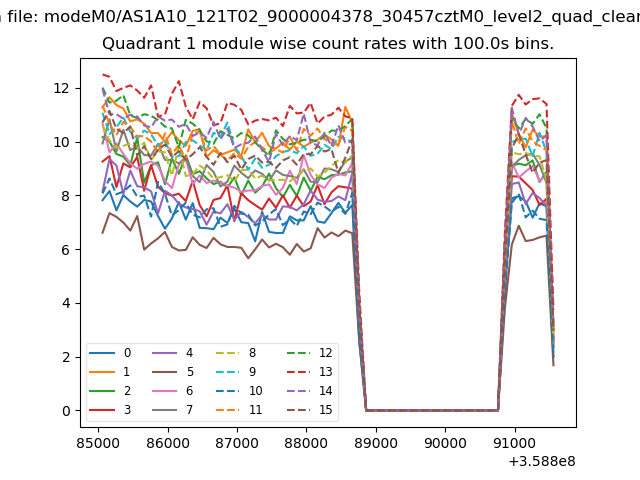
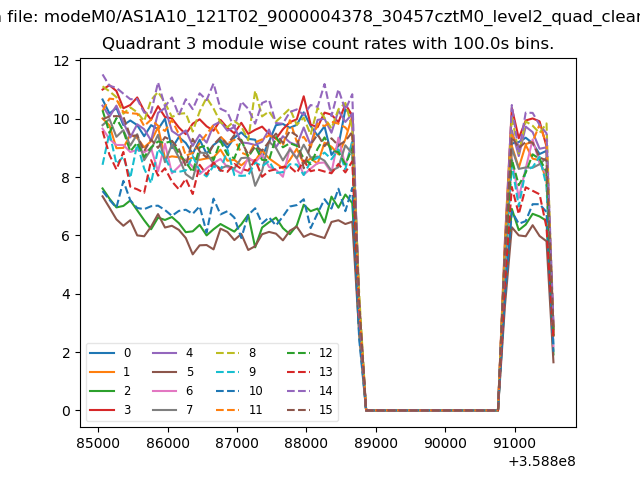
| Module-wise count rates for Quadrant A Data is divided into 100 sec bins |
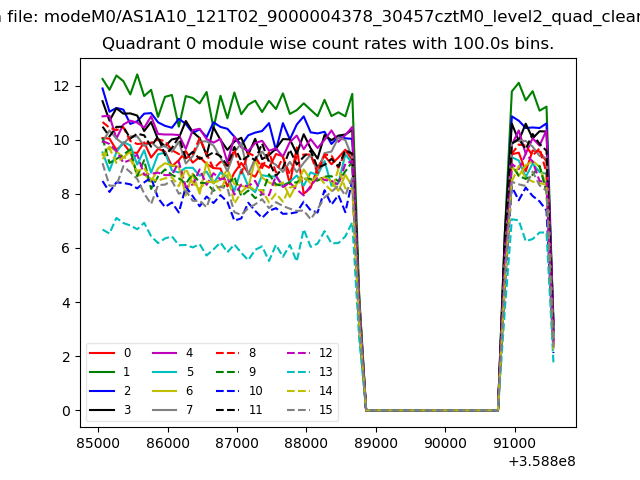 |
 |
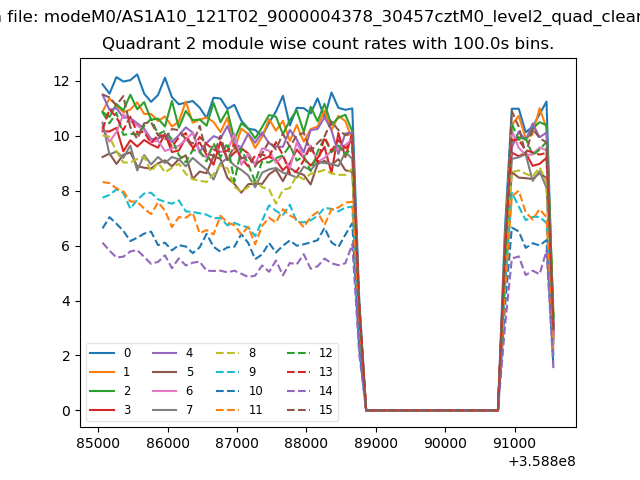
| Module-wise count rates for Quadrant B Data is divided into 100 sec bins |
 |
 |
| Module-wise count rates for Quadrant C Data is divided into 100 sec bins |
 |
 |
| Module-wise count rates for Quadrant D Data is divided into 100 sec bins |
 |
 |
| Parameter | Plot |
|---|---|
| CZT HV Monitor |  |
| D_VDD |  |
| Temperature 1 | 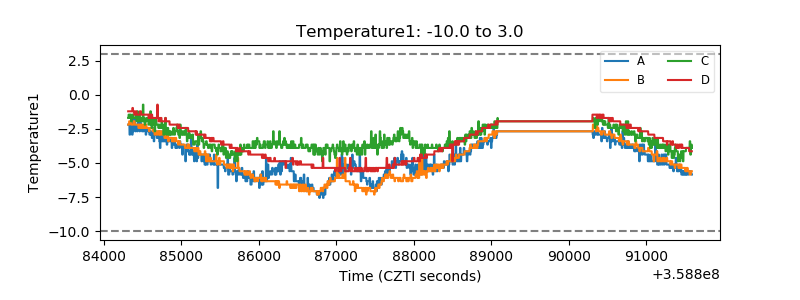 |
| Veto HV Monitor | 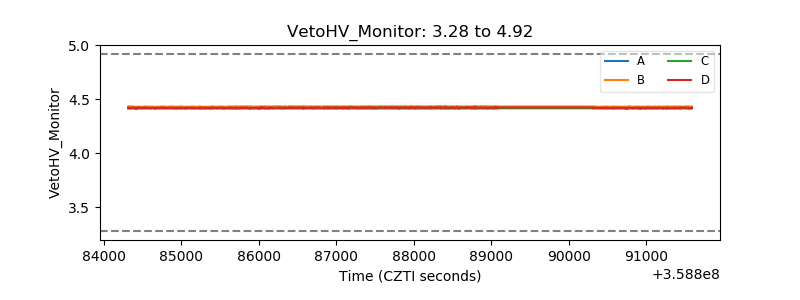 |
| Veto LLD | 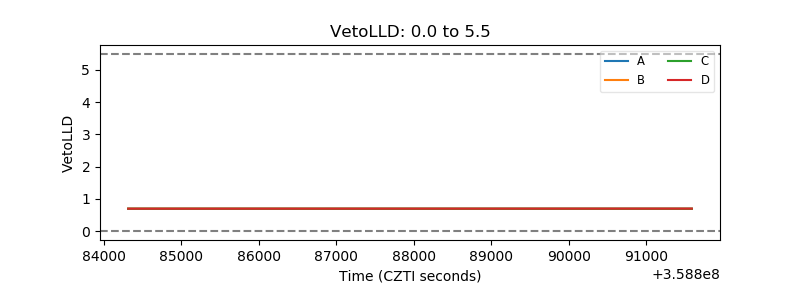 |
| Alpha Counter | 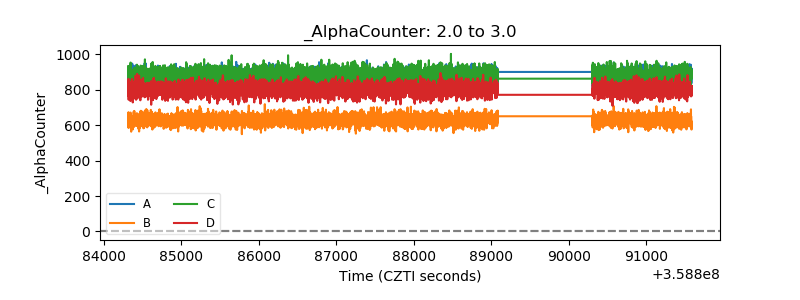 |
| _CPM_Rate | 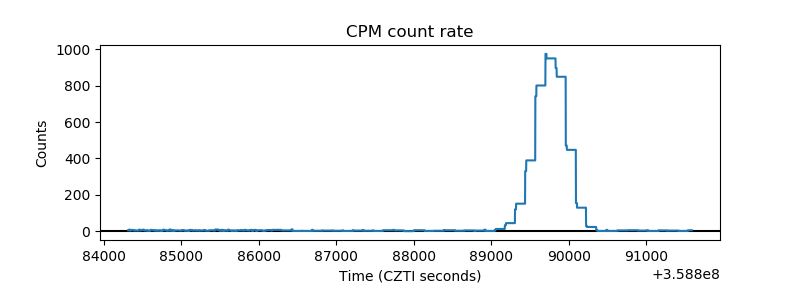 |
| CZT Counter | 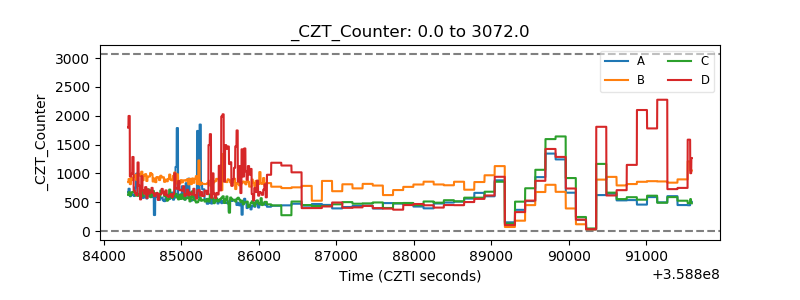 |
| +2.5 Volts monitor |  |
| +5 Volts monitor |  |
| _ROLL_ROT | 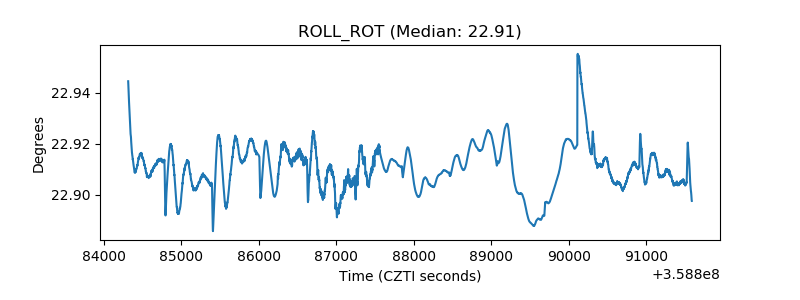 |
| _Roll_DEC | 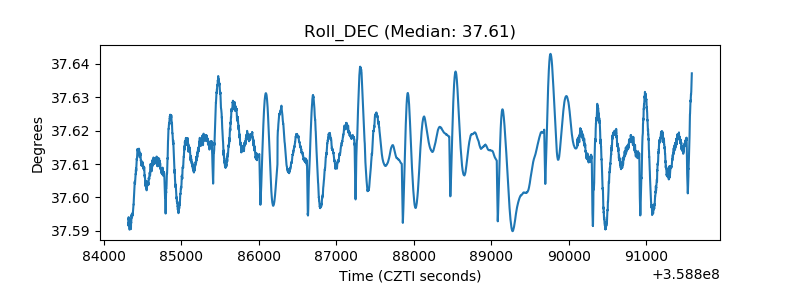 |
| _Roll_RA | 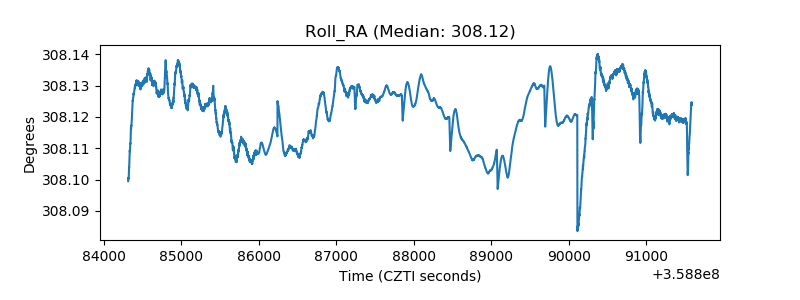 |
| Veto Counter | 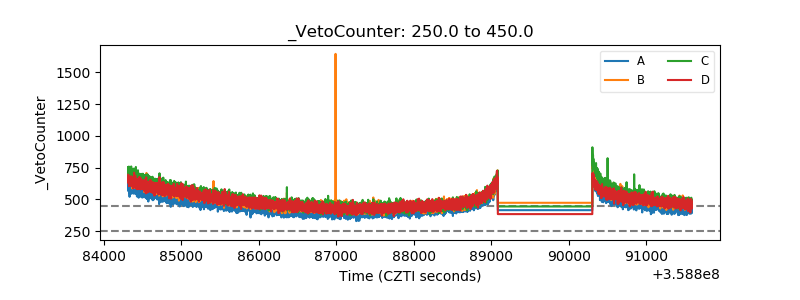 |