| Param | Original file | Final file |
|---|---|---|
| Filename | modeM0/AS1A10_121T02_9000004378_30460cztM0_level2.evt | modeM0/AS1A10_121T02_9000004378_30460cztM0_level2_quad_clean.evt |
| Size (bytes) | 637,934,400 | 109,825,920 |
| Size | 608.4 MB | 104.7 MB |
| Events in quadrant A | 3,847,183 | 708,391 |
| Events in quadrant B | 6,126,670 | 707,882 |
| Events in quadrant C | 4,013,059 | 694,521 |
| Events in quadrant D | 4,810,012 | 677,698 |
| Mode M0 | |||
|---|---|---|---|
| Quadrant | BADHDUFLAG | Total packets | Discarded packets |
| A | 0 | 16659 | 2 |
| B | 0 | 23836 | 2 |
| C | 0 | 16890 | 2 |
| D | 0 | 19713 | 2 |
| Mode SS | |||
|---|---|---|---|
| Quadrant | BADHDUFLAG | Total packets | Discarded packets |
| A | 0 | 158 | 0 |
| B | 0 | 158 | 0 |
| C | 0 | 158 | 0 |
| D | 0 | 158 | 0 |
| Mode M9 | |||
|---|---|---|---|
| Quadrant | BADHDUFLAG | Total packets | Discarded packets |
| A | 0 | 8 | 0 |
| B | 0 | 8 | 0 |
| C | 0 | 8 | 0 |
| D | 0 | 8 | 0 |
| Quadrant | Total seconds | Saturated seconds | Saturation percentage |
|---|---|---|---|
| A | 7728 | 85 | 1.099896% |
| B | 7729 | 259 | 3.351016% |
| C | 7729 | 244 | 3.156941% |
| D | 7729 | 324 | 4.192004% |
Noise dominated data is calculated using 1-second bins in cleaned event files. If a bin has >2000 counts, and if more than 50% of those come from <1% of pixels, then it is considered to be noise-dominated and hence unusable.
| Quadrant | # 1 sec bins | Bins with >0 counts | Bins with >2000 counts | High rate bins dominated by noise | Noise dominated (total time) | Noise dominated (detector-on time) | Marked lightcurve |
|---|---|---|---|---|---|---|---|
| A | 8478 | 7730 | 4 | 4 | 0.05% | 0.05% | 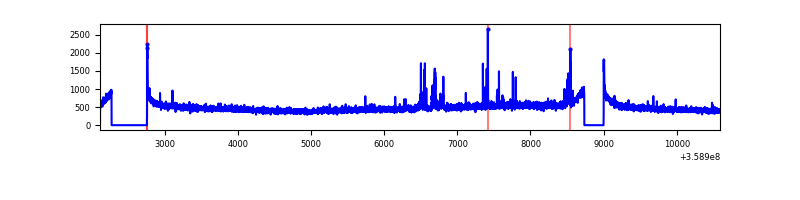 |
| B | 8479 | 7731 | 2 | 2 | 0.02% | 0.03% | 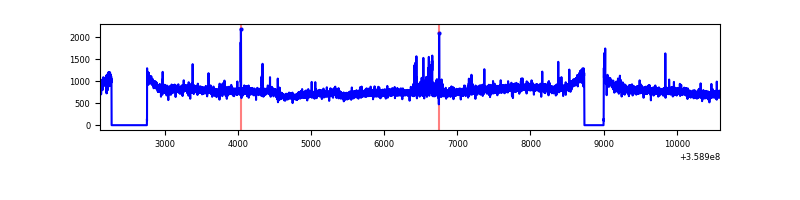 |
| C | 8479 | 7731 | 1 | 1 | 0.01% | 0.01% | 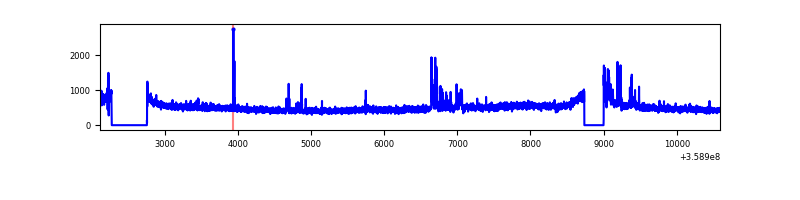 |
| D | 8479 | 7731 | 150 | 150 | 1.77% | 1.94% | 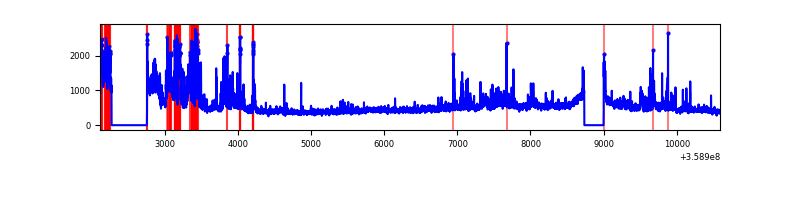 |
Top three noisy pixels from each quadrant. If the there are fewer than three noisy pixels in the level2.evt file, extra rows are filled as -1
| Pixel properties | Quadrant properties | ||||||
|---|---|---|---|---|---|---|---|
| Quadrant | DetID | PixID | Counts | Sigma | Mean | Median | Sigma |
| A | 4 | 2 | 61439 | 312.82 | 960 | 939 | 193.4 |
| A | 0 | 13 | 52823 | 268.27 | 960 | 939 | 193.4 |
| A | 8 | 192 | 22121 | 109.52 | 960 | 939 | 193.4 |
| B | 6 | 159 | 2258178 | 12216.75 | 953 | 927 | 184.8 |
| B | 0 | 229 | 43516 | 230.5 | 953 | 927 | 184.8 |
| B | 0 | 190 | 36436 | 192.18 | 953 | 927 | 184.8 |
| C | 14 | 238 | 156574 | 708.89 | 925 | 930 | 219.6 |
| C | 10 | 22 | 112646 | 508.82 | 925 | 930 | 219.6 |
| C | 3 | 233 | 70039 | 314.76 | 925 | 930 | 219.6 |
| D | 13 | 104 | 854793 | 3570.82 | 916 | 897 | 239.1 |
| D | 8 | 195 | 163507 | 680.0 | 916 | 897 | 239.1 |
| D | 1 | 52 | 112956 | 468.61 | 916 | 897 | 239.1 |
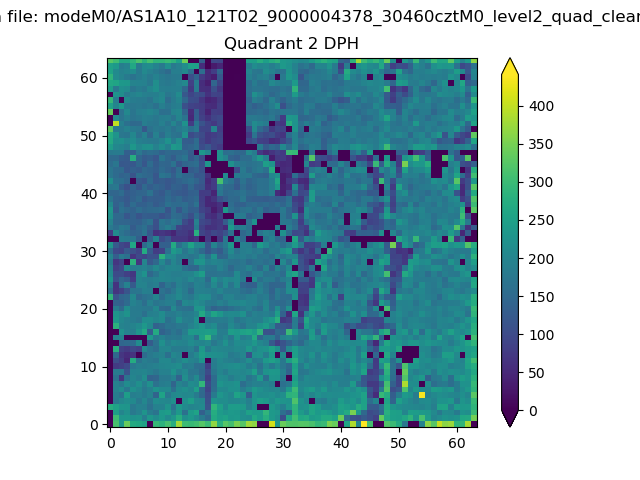
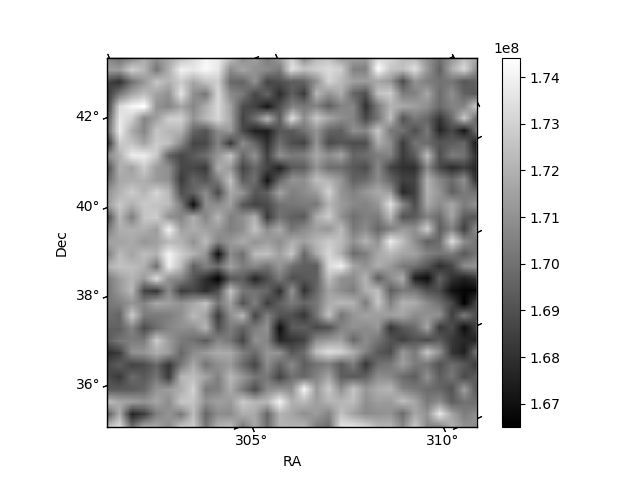
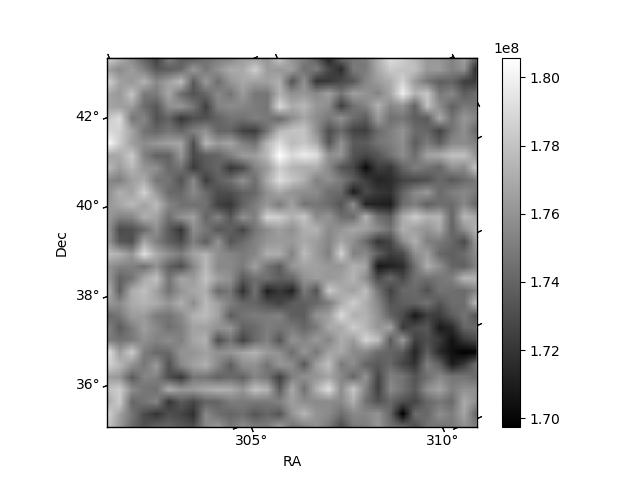
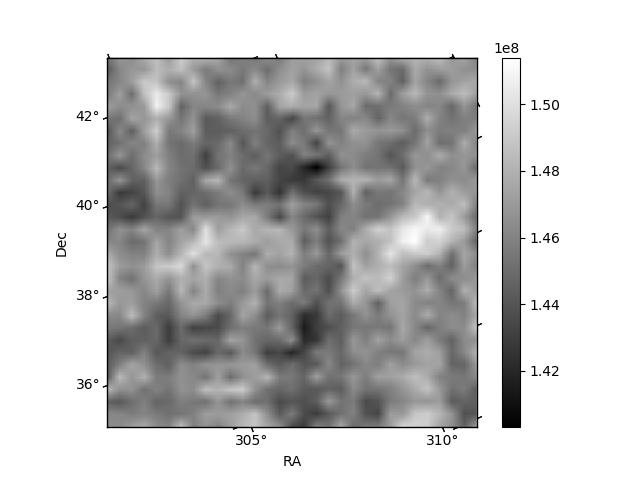
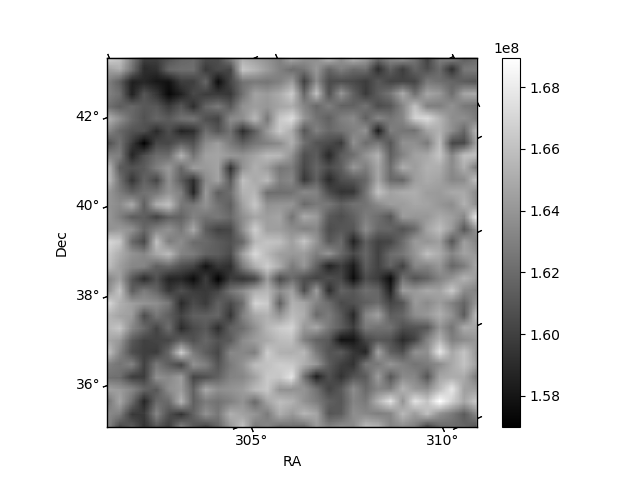
Histogram calculated using DETX and DETY for each event in the final _common_clean file
| Quadrant A | 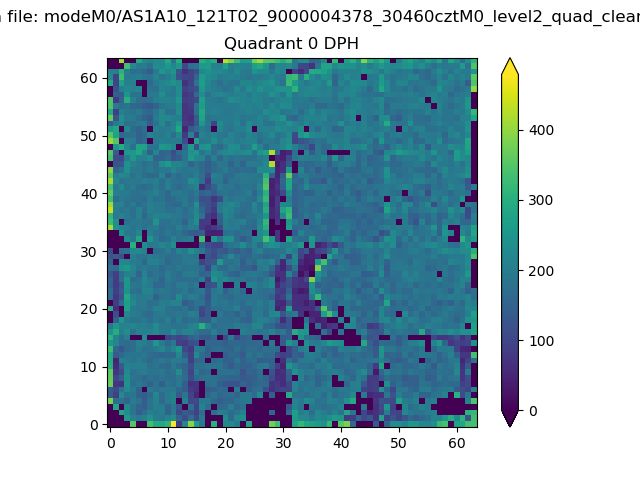 |
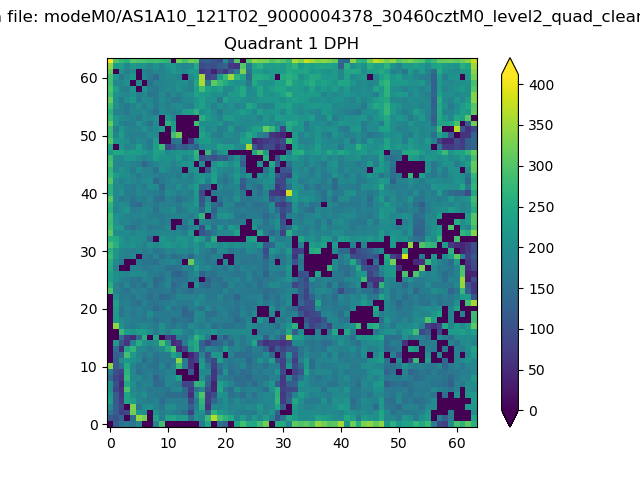 |
Quadrant B |
|---|---|---|---|
| Quadrant D | 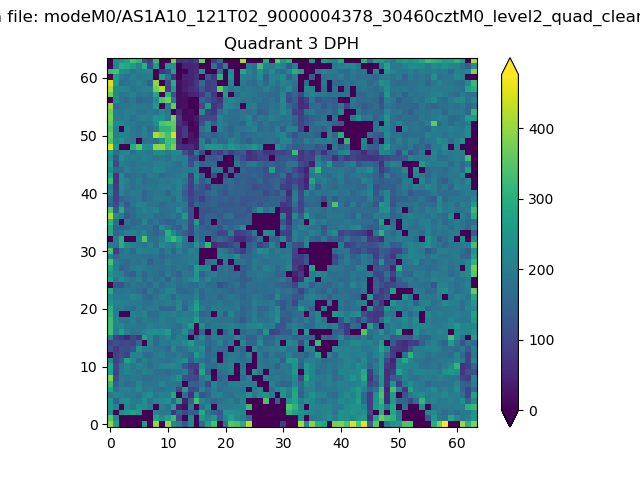 |
 |
Quadrant C |
| Plot type | Count rate plots | Images |
|---|---|---|
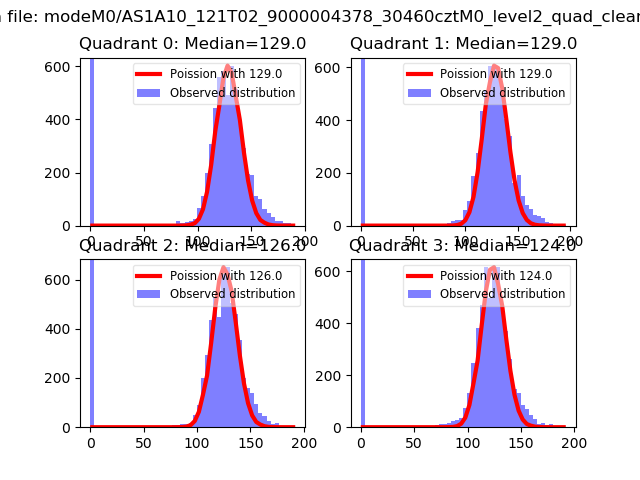
| Comparison with Poisson distribution Blue bars denote a histogram of data divided into 1 sec bins. Red curve is a Poisson curve with rate = median count rate of data. |
 |
 |
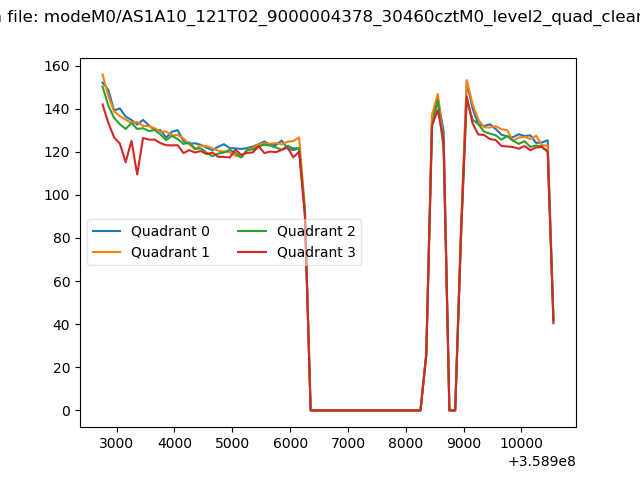
| Quadrant-wise count rates Data is divided into 100 sec bins |
 |
|
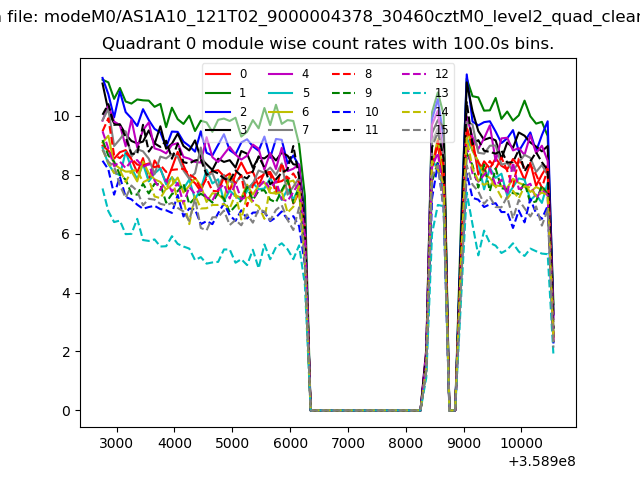
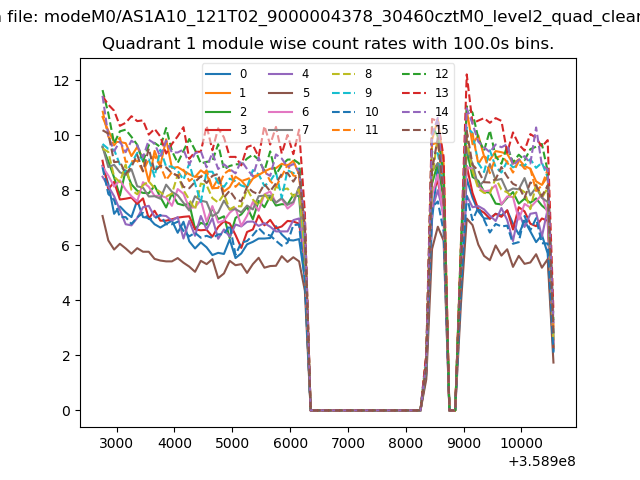
| Module-wise count rates for Quadrant A Data is divided into 100 sec bins |
 |
 |
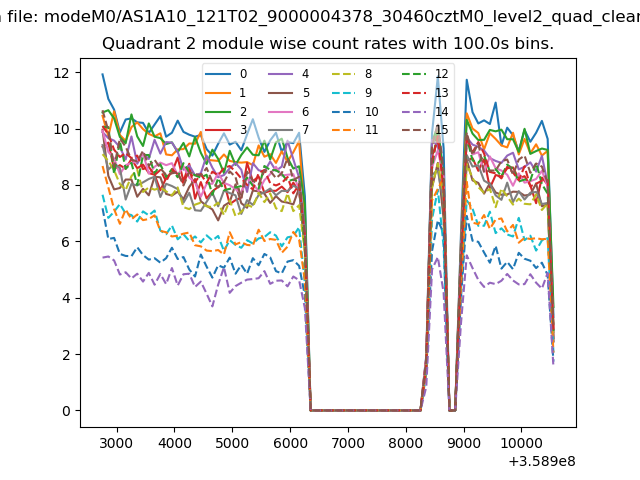
| Module-wise count rates for Quadrant B Data is divided into 100 sec bins |
 |
 |
| Module-wise count rates for Quadrant C Data is divided into 100 sec bins |
 |
 |
| Module-wise count rates for Quadrant D Data is divided into 100 sec bins |
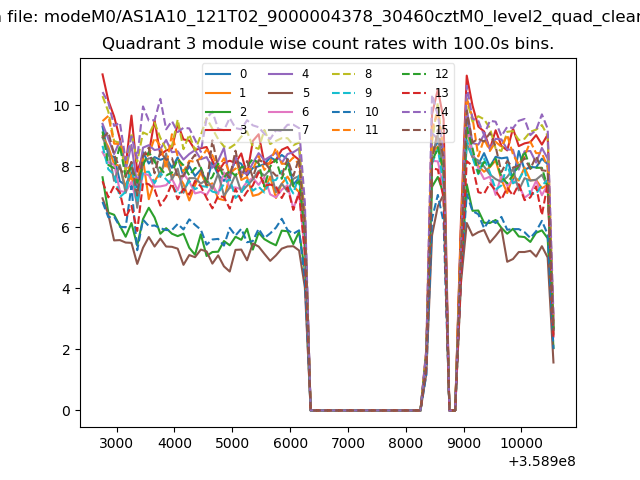 |
 |
| Parameter | Plot |
|---|---|
| CZT HV Monitor |  |
| D_VDD | 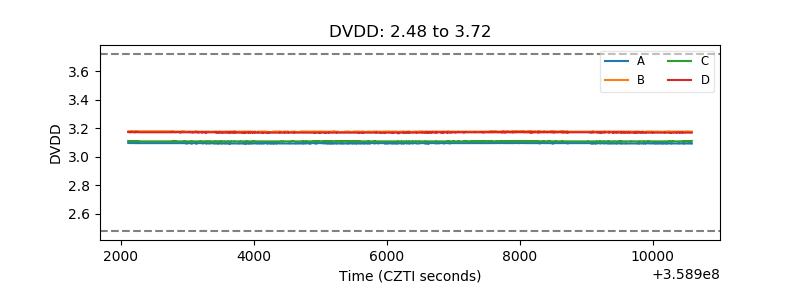 |
| Temperature 1 | 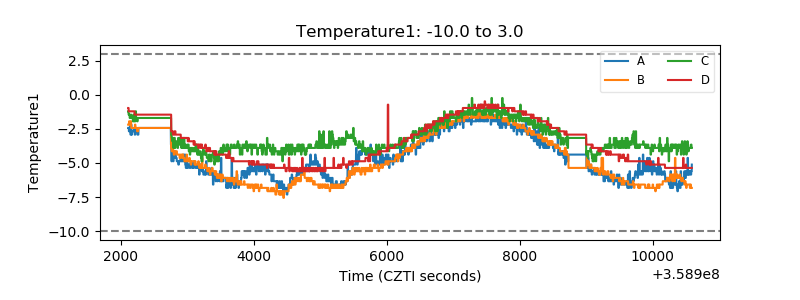 |
| Veto HV Monitor | 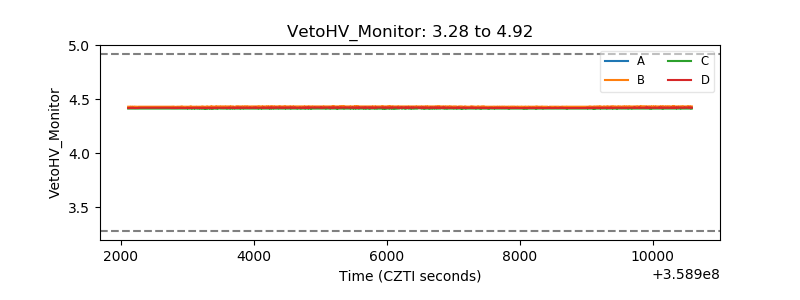 |
| Veto LLD | 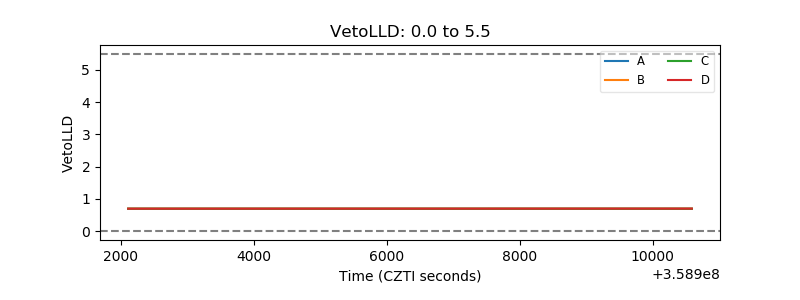 |
| Alpha Counter | 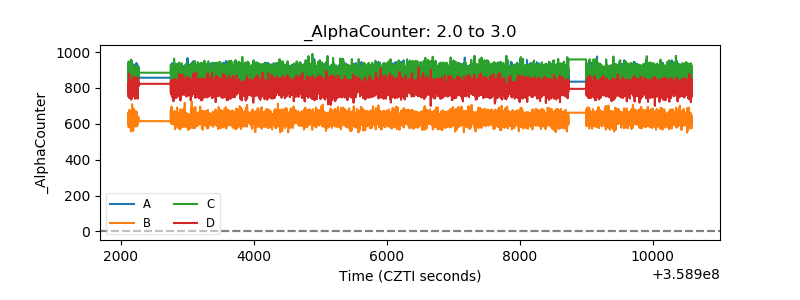 |
| _CPM_Rate | 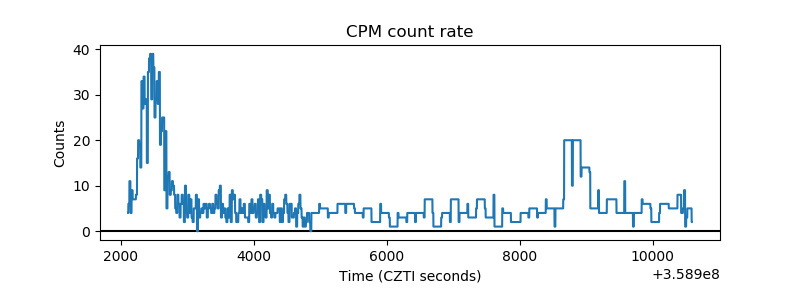 |
| CZT Counter | 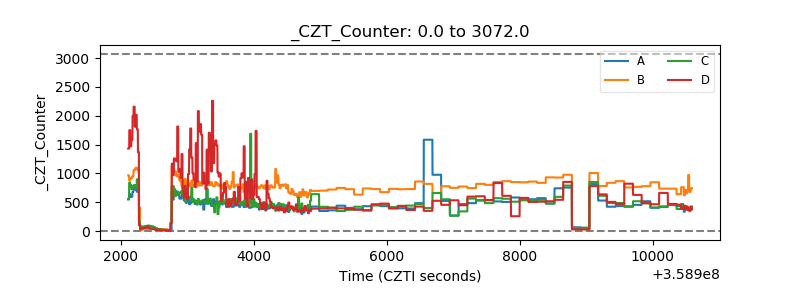 |
| +2.5 Volts monitor |  |
| +5 Volts monitor |  |
| _ROLL_ROT | 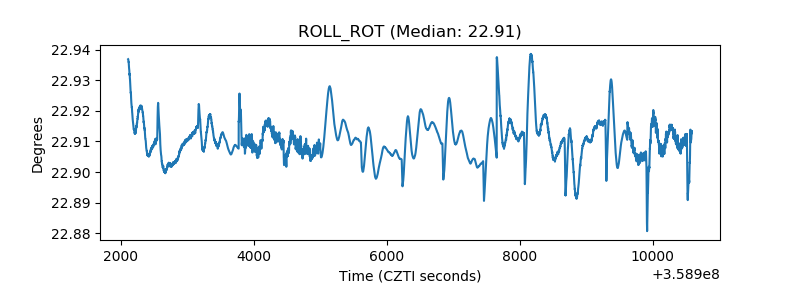 |
| _Roll_DEC | 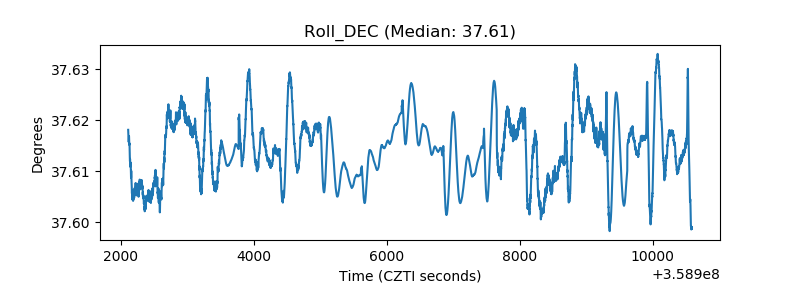 |
| _Roll_RA | 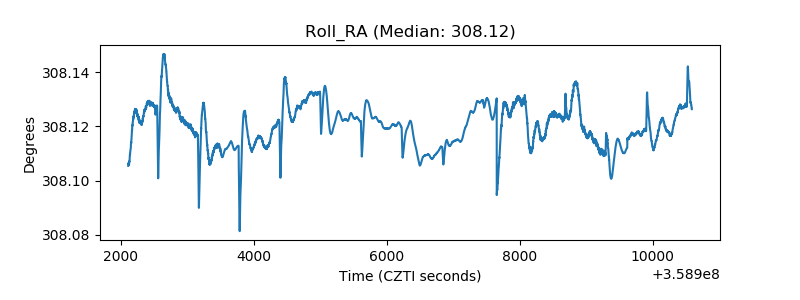 |
| Veto Counter | 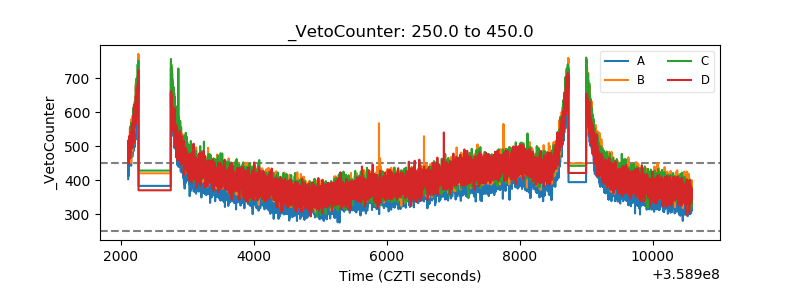 |