| Param | Original file | Final file |
|---|---|---|
| Filename | modeM0/AS1A10_121T02_9000004378_30461cztM0_level2.evt | modeM0/AS1A10_121T02_9000004378_30461cztM0_level2_quad_clean.evt |
| Size (bytes) | 613,828,800 | 106,079,040 |
| Size | 585.4 MB | 101.2 MB |
| Events in quadrant A | 3,545,867 | 682,628 |
| Events in quadrant B | 5,756,959 | 681,964 |
| Events in quadrant C | 3,836,736 | 668,035 |
| Events in quadrant D | 4,944,185 | 659,794 |
| Mode M0 | |||
|---|---|---|---|
| Quadrant | BADHDUFLAG | Total packets | Discarded packets |
| A | 0 | 15654 | 1 |
| B | 0 | 22727 | 2 |
| C | 0 | 16301 | 1 |
| D | 0 | 20183 | 1 |
| Mode SS | |||
|---|---|---|---|
| Quadrant | BADHDUFLAG | Total packets | Discarded packets |
| A | 0 | 152 | 0 |
| B | 0 | 152 | 0 |
| C | 0 | 152 | 0 |
| D | 0 | 152 | 0 |
| Mode M9 | |||
|---|---|---|---|
| Quadrant | BADHDUFLAG | Total packets | Discarded packets |
| A | 0 | 3 | 0 |
| B | 0 | 3 | 0 |
| C | 0 | 3 | 0 |
| D | 0 | 3 | 0 |
| Quadrant | Total seconds | Saturated seconds | Saturation percentage |
|---|---|---|---|
| A | 7472 | 72 | 0.963597% |
| B | 7471 | 174 | 2.329005% |
| C | 7472 | 185 | 2.475910% |
| D | 7472 | 372 | 4.978587% |
Noise dominated data is calculated using 1-second bins in cleaned event files. If a bin has >2000 counts, and if more than 50% of those come from <1% of pixels, then it is considered to be noise-dominated and hence unusable.
| Quadrant | # 1 sec bins | Bins with >0 counts | Bins with >2000 counts | High rate bins dominated by noise | Noise dominated (total time) | Noise dominated (detector-on time) | Marked lightcurve |
|---|---|---|---|---|---|---|---|
| A | 7792 | 7474 | 9 | 9 | 0.12% | 0.12% | 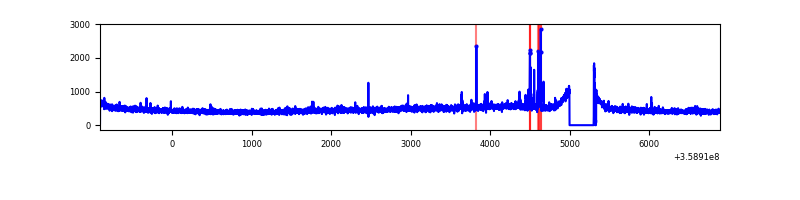 |
| B | 7791 | 7473 | 5 | 5 | 0.06% | 0.07% | 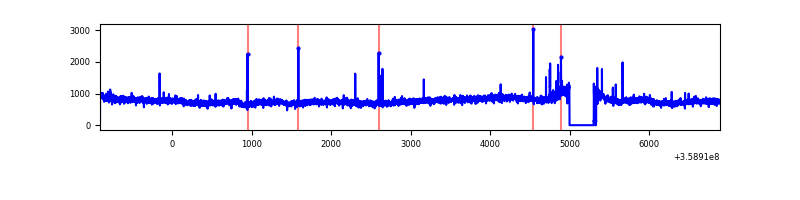 |
| C | 7792 | 7474 | 6 | 6 | 0.08% | 0.08% | 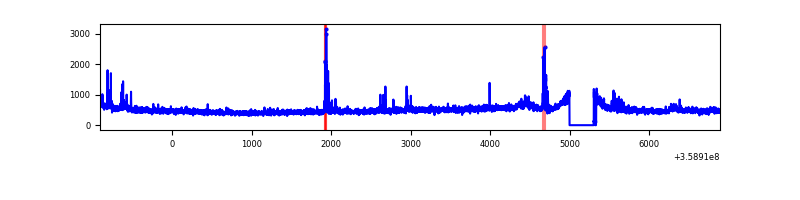 |
| D | 7792 | 7474 | 136 | 136 | 1.75% | 1.82% | 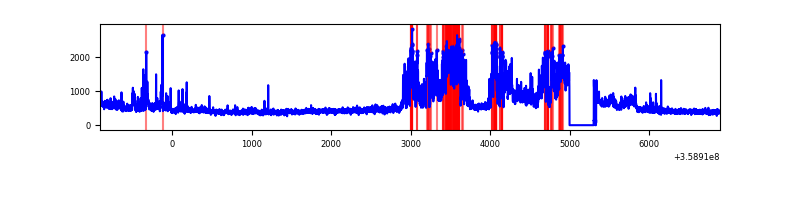 |
Top three noisy pixels from each quadrant. If the there are fewer than three noisy pixels in the level2.evt file, extra rows are filled as -1
| Pixel properties | Quadrant properties | ||||||
|---|---|---|---|---|---|---|---|
| Quadrant | DetID | PixID | Counts | Sigma | Mean | Median | Sigma |
| A | 0 | 13 | 59896 | 322.14 | 900 | 881 | 183.2 |
| A | 8 | 192 | 13433 | 68.52 | 900 | 881 | 183.2 |
| A | 13 | 254 | 13284 | 67.7 | 900 | 881 | 183.2 |
| B | 6 | 159 | 2155834 | 12462.91 | 893 | 868 | 172.9 |
| B | 0 | 229 | 33133 | 186.6 | 893 | 868 | 172.9 |
| B | 12 | 111 | 21697 | 120.46 | 893 | 868 | 172.9 |
| C | 14 | 238 | 152215 | 730.82 | 869 | 872 | 207.1 |
| C | 10 | 22 | 117262 | 562.03 | 869 | 872 | 207.1 |
| C | 3 | 233 | 109803 | 526.01 | 869 | 872 | 207.1 |
| D | 13 | 104 | 1448851 | 6457.25 | 859 | 841 | 224.2 |
| D | 8 | 195 | 141759 | 628.41 | 859 | 841 | 224.2 |
| D | 2 | 234 | 35856 | 156.15 | 859 | 841 | 224.2 |
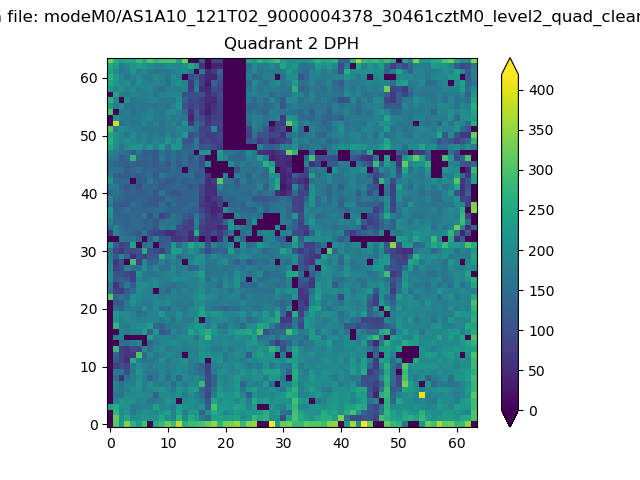
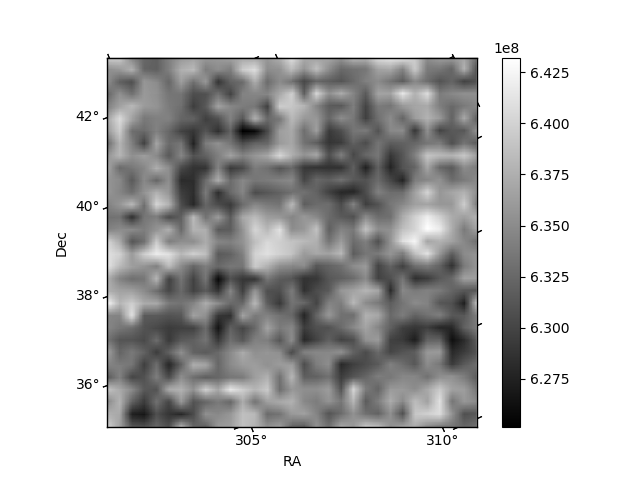
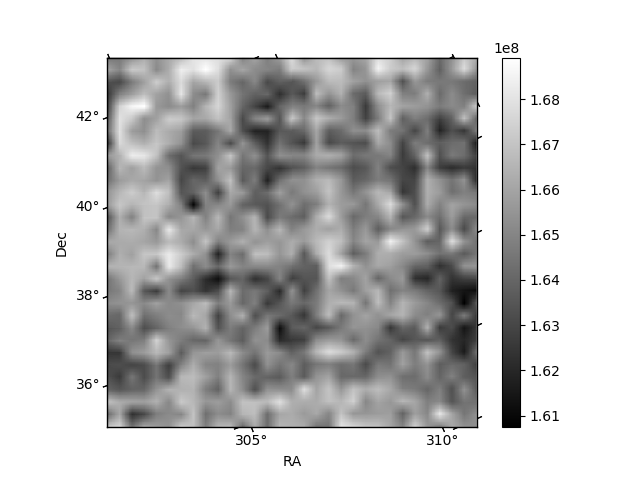
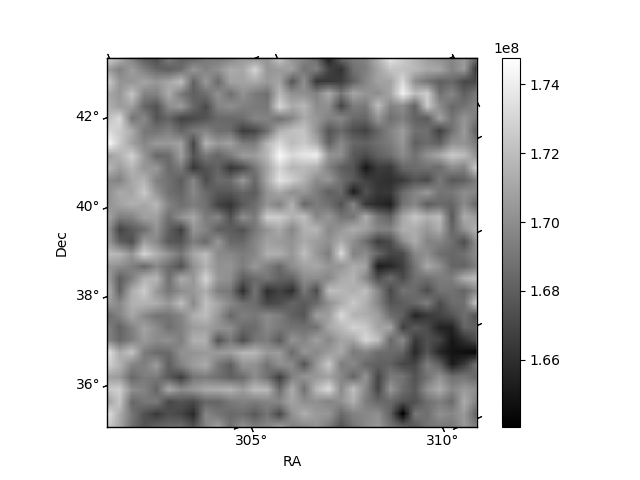
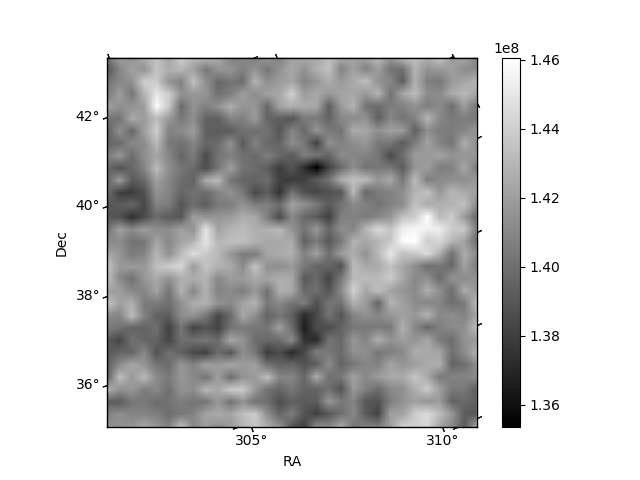
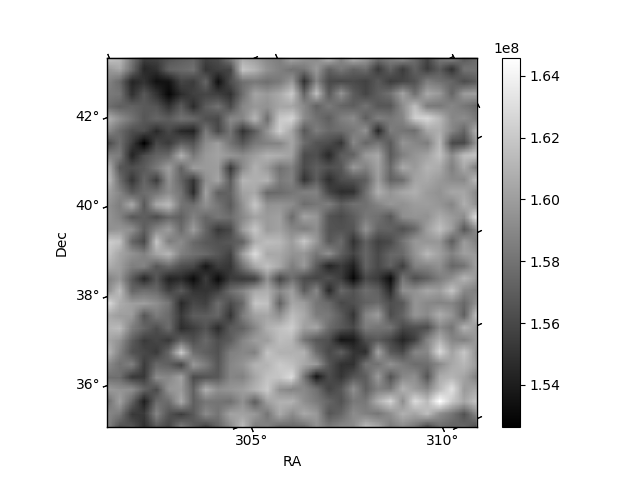
Histogram calculated using DETX and DETY for each event in the final _common_clean file
| Quadrant A | 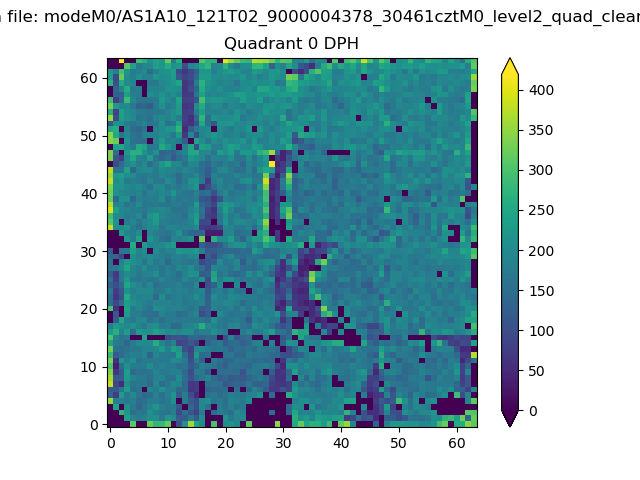 |
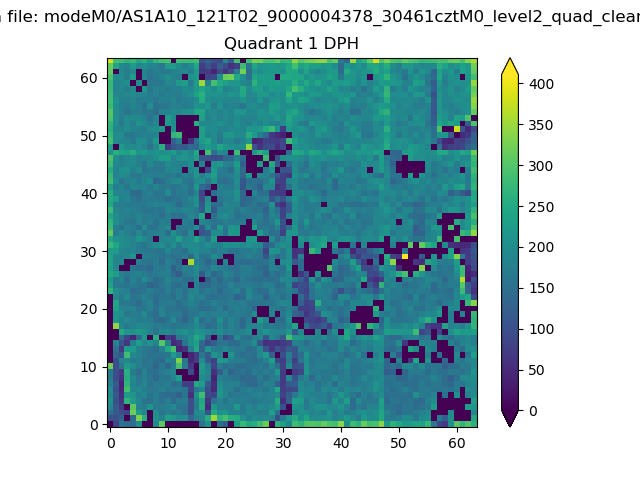 |
Quadrant B |
|---|---|---|---|
| Quadrant D | 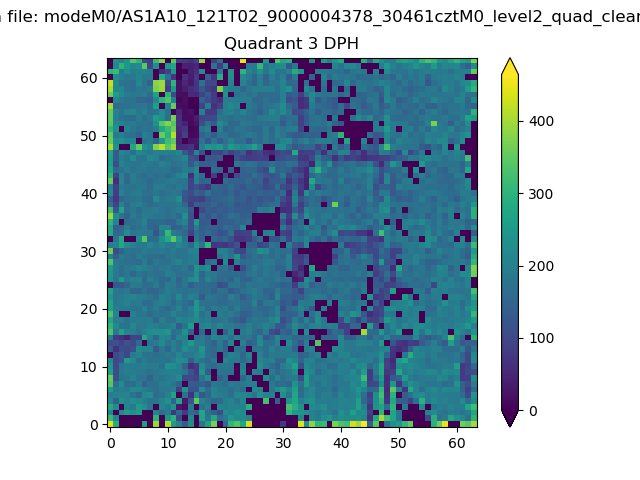 |
 |
Quadrant C |
| Plot type | Count rate plots | Images |
|---|---|---|
| Comparison with Poisson distribution Blue bars denote a histogram of data divided into 1 sec bins. Red curve is a Poisson curve with rate = median count rate of data. |
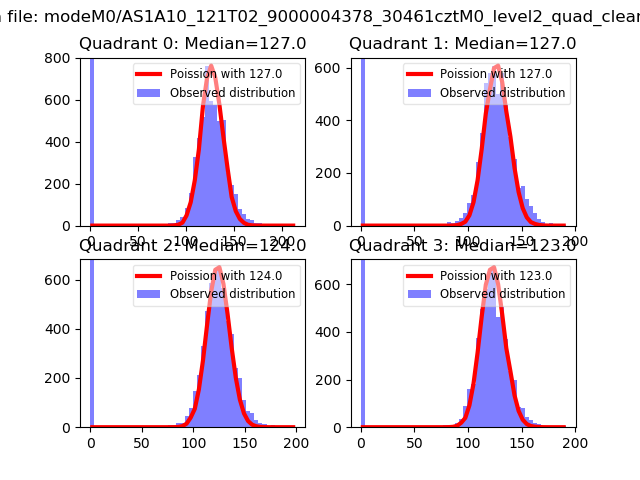 |
 |
| Quadrant-wise count rates Data is divided into 100 sec bins |
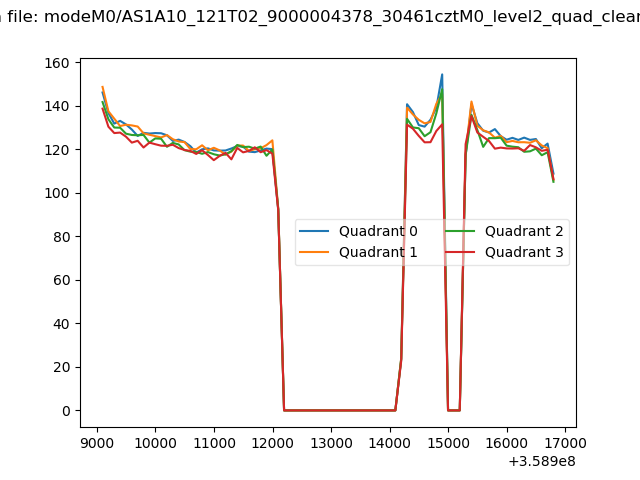 |
|
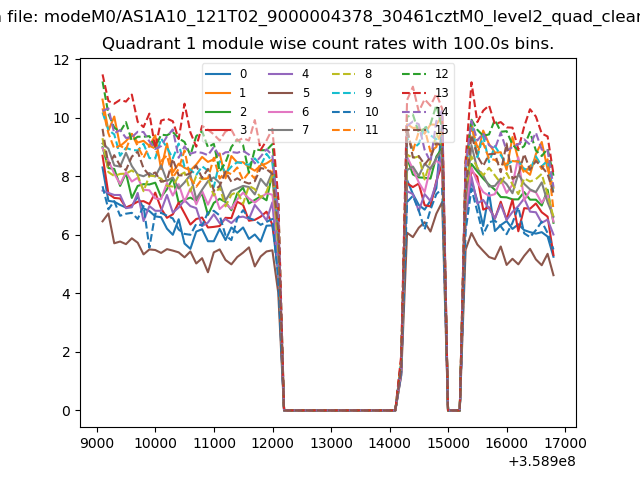
| Module-wise count rates for Quadrant A Data is divided into 100 sec bins |
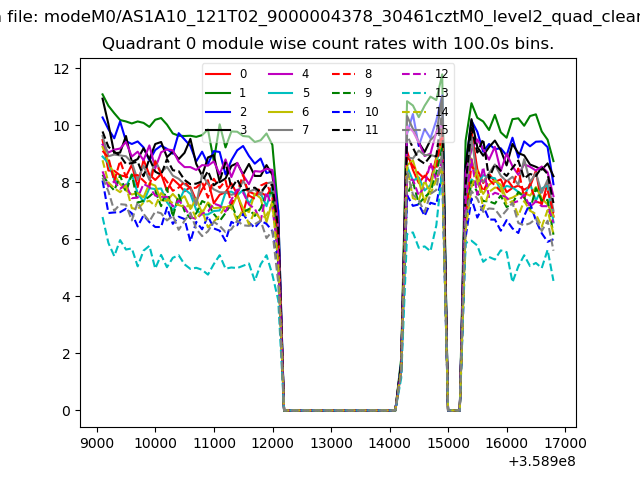 |
 |
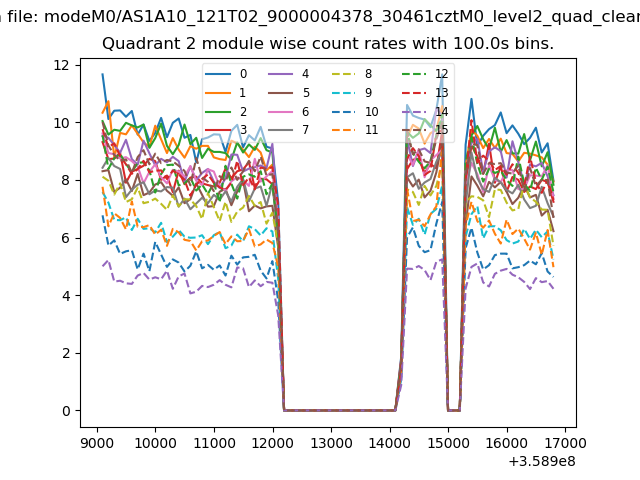
| Module-wise count rates for Quadrant B Data is divided into 100 sec bins |
 |
 |
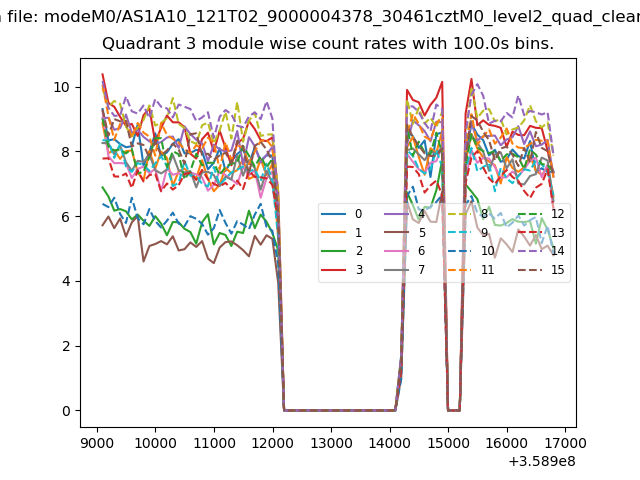
| Module-wise count rates for Quadrant C Data is divided into 100 sec bins |
 |
 |
| Module-wise count rates for Quadrant D Data is divided into 100 sec bins |
 |
 |
| Parameter | Plot |
|---|---|
| CZT HV Monitor | 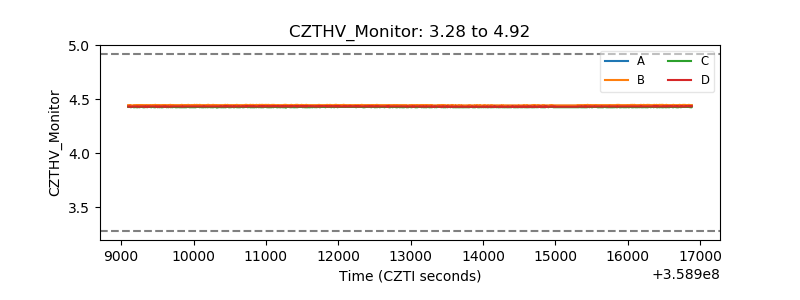 |
| D_VDD | 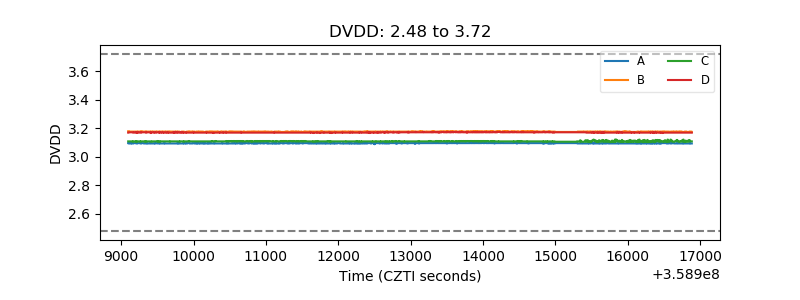 |
| Temperature 1 | 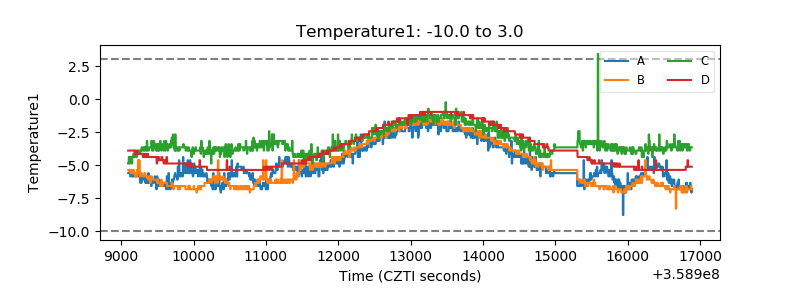 |
| Veto HV Monitor | 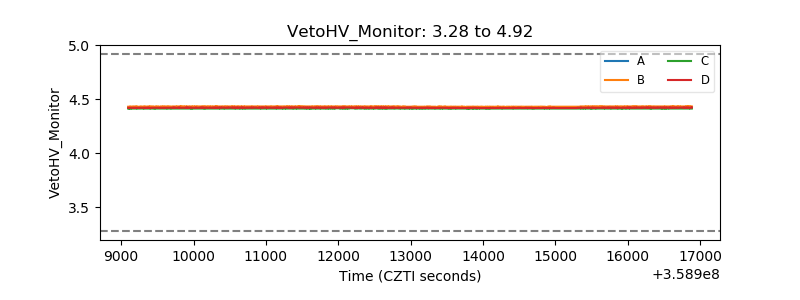 |
| Veto LLD | 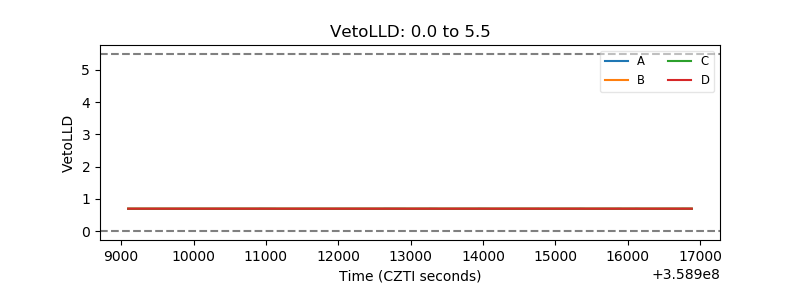 |
| Alpha Counter | 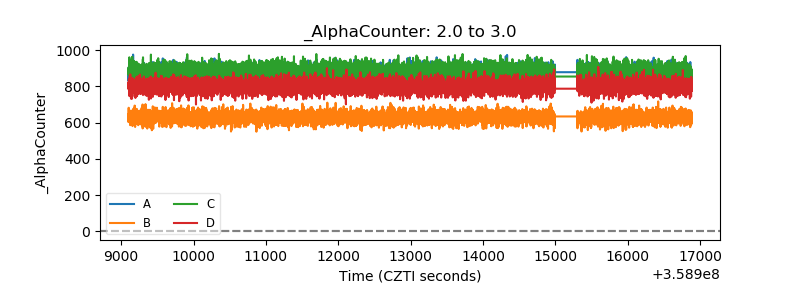 |
| _CPM_Rate | 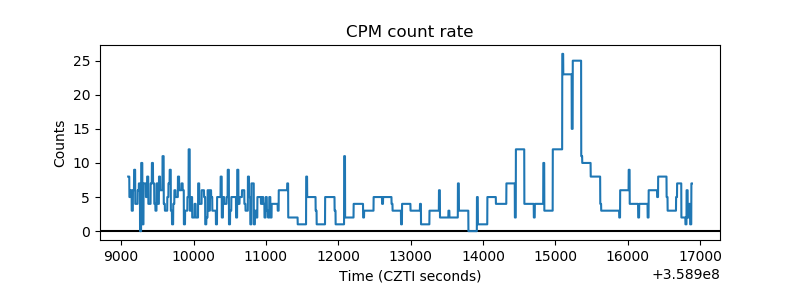 |
| CZT Counter | 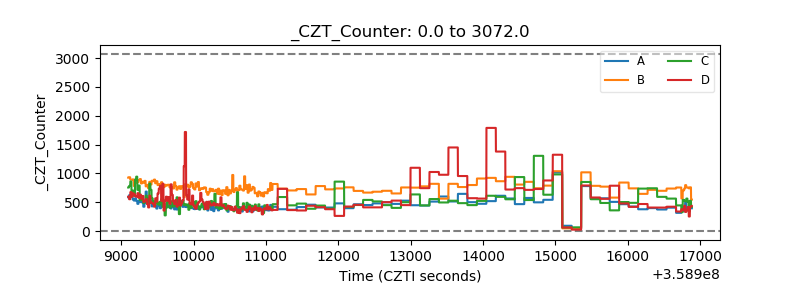 |
| +2.5 Volts monitor |  |
| +5 Volts monitor |  |
| _ROLL_ROT | 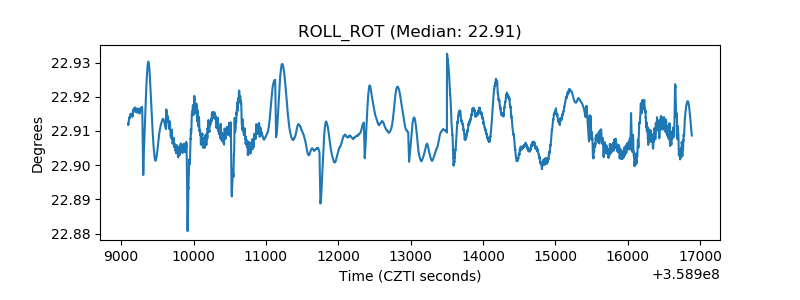 |
| _Roll_DEC | 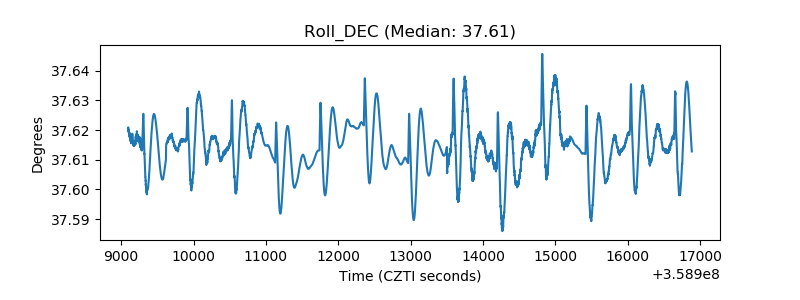 |
| _Roll_RA | 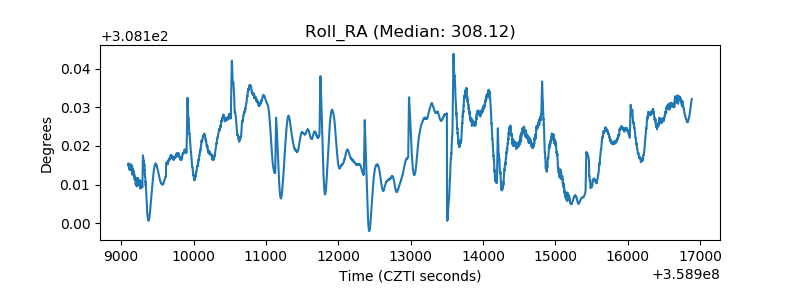 |
| Veto Counter | 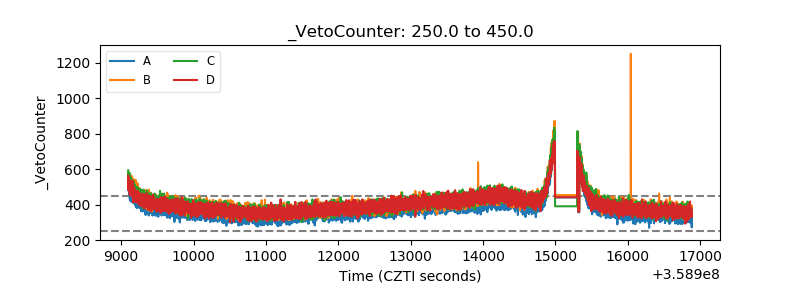 |