| Param | Original file | Final file |
|---|---|---|
| Filename | modeM0/AS1A10_121T02_9000004378_30464cztM0_level2.evt | modeM0/AS1A10_121T02_9000004378_30464cztM0_level2_quad_clean.evt |
| Size (bytes) | 1,181,966,400 | 187,758,720 |
| Size | 1.1 GB | 179.1 MB |
| Events in quadrant A | 7,313,750 | 1,169,826 |
| Events in quadrant B | 11,591,259 | 1,168,366 |
| Events in quadrant C | 7,739,840 | 1,142,434 |
| Events in quadrant D | 8,104,615 | 1,136,390 |
| Mode M0 | |||
|---|---|---|---|
| Quadrant | BADHDUFLAG | Total packets | Discarded packets |
| A | 0 | 31909 | 2 |
| B | 0 | 46732 | 2 |
| C | 0 | 32632 | 2 |
| D | 0 | 35097 | 2 |
| Mode SS | |||
|---|---|---|---|
| Quadrant | BADHDUFLAG | Total packets | Discarded packets |
| A | 0 | 312 | 0 |
| B | 0 | 312 | 0 |
| C | 0 | 312 | 0 |
| D | 0 | 312 | 0 |
| Mode M9 | |||
|---|---|---|---|
| Quadrant | BADHDUFLAG | Total packets | Discarded packets |
| A | 0 | 13 | 0 |
| B | 0 | 13 | 0 |
| C | 0 | 13 | 0 |
| D | 0 | 13 | 0 |
| Quadrant | Total seconds | Saturated seconds | Saturation percentage |
|---|---|---|---|
| A | 15507 | 102 | 0.657767% |
| B | 15507 | 210 | 1.354227% |
| C | 15507 | 203 | 1.309086% |
| D | 15507 | 57 | 0.367576% |
Noise dominated data is calculated using 1-second bins in cleaned event files. If a bin has >2000 counts, and if more than 50% of those come from <1% of pixels, then it is considered to be noise-dominated and hence unusable.
| Quadrant | # 1 sec bins | Bins with >0 counts | Bins with >2000 counts | High rate bins dominated by noise | Noise dominated (total time) | Noise dominated (detector-on time) | Marked lightcurve |
|---|---|---|---|---|---|---|---|
| A | 16692 | 15509 | 12 | 12 | 0.07% | 0.08% | 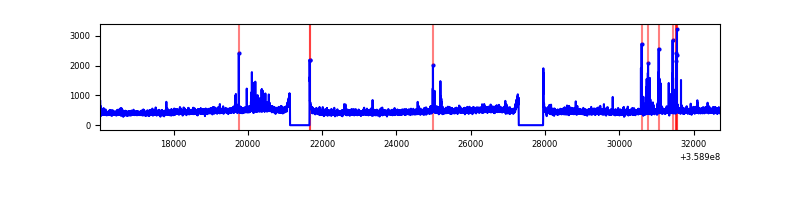 |
| B | 16692 | 15509 | 12 | 12 | 0.07% | 0.08% |  |
| C | 16692 | 15509 | 7 | 7 | 0.04% | 0.05% | 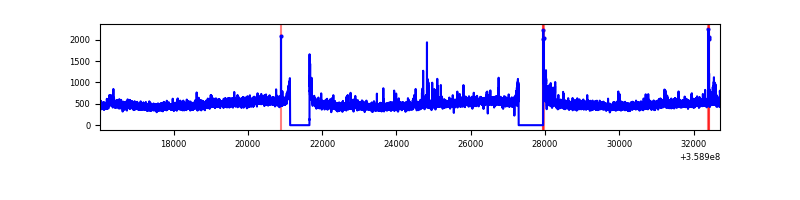 |
| D | 16692 | 15509 | 22 | 22 | 0.13% | 0.14% | 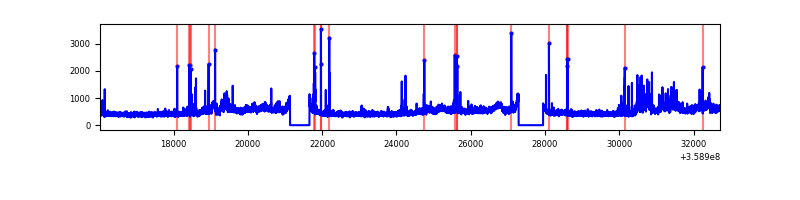 |
Top three noisy pixels from each quadrant. If the there are fewer than three noisy pixels in the level2.evt file, extra rows are filled as -1
| Pixel properties | Quadrant properties | ||||||
|---|---|---|---|---|---|---|---|
| Quadrant | DetID | PixID | Counts | Sigma | Mean | Median | Sigma |
| A | 14 | 239 | 130693 | 350.14 | 1844 | 1806 | 368.1 |
| A | 8 | 192 | 28271 | 71.9 | 1844 | 1806 | 368.1 |
| A | 13 | 254 | 27187 | 68.95 | 1844 | 1806 | 368.1 |
| B | 6 | 159 | 4279081 | 12273.59 | 1824 | 1778 | 348.5 |
| B | 0 | 229 | 44812 | 123.48 | 1824 | 1778 | 348.5 |
| B | 4 | 171 | 44350 | 122.16 | 1824 | 1778 | 348.5 |
| C | 3 | 233 | 458051 | 1105.38 | 1766 | 1776 | 412.8 |
| C | 14 | 238 | 290236 | 698.83 | 1766 | 1776 | 412.8 |
| C | 2 | 114 | 35866 | 82.59 | 1766 | 1776 | 412.8 |
| D | 13 | 104 | 543596 | 1168.91 | 1774 | 1741 | 463.6 |
| D | 8 | 195 | 346215 | 743.11 | 1774 | 1741 | 463.6 |
| D | 12 | 227 | 246638 | 528.3 | 1774 | 1741 | 463.6 |
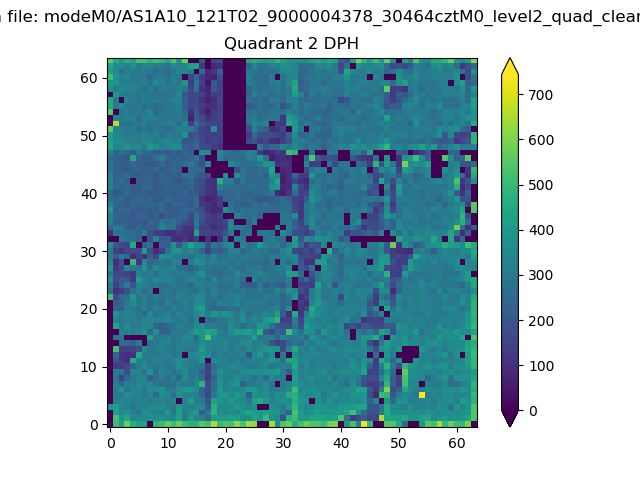
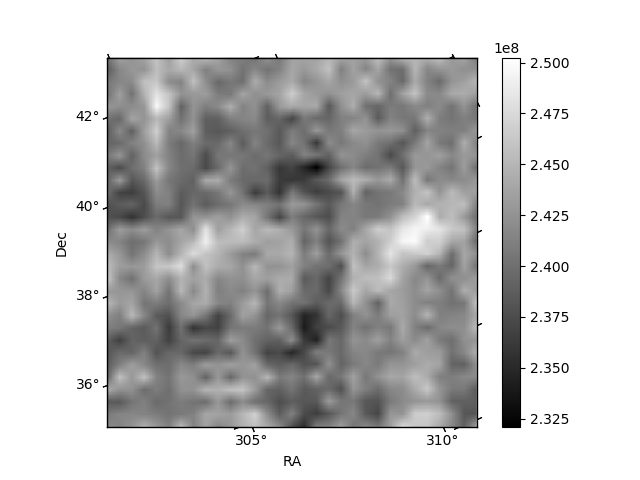
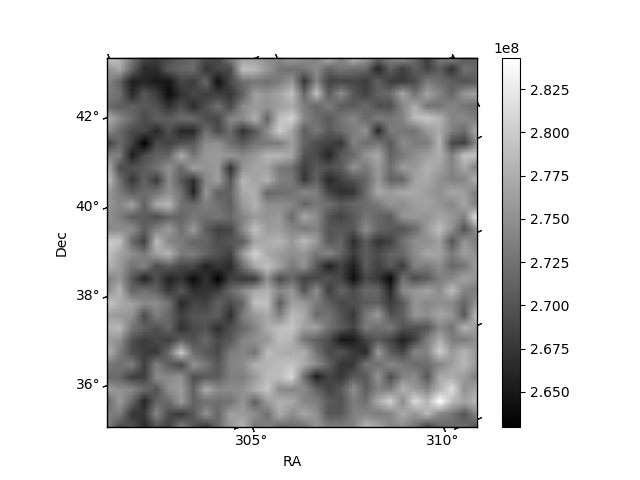
Histogram calculated using DETX and DETY for each event in the final _common_clean file
| Quadrant A |  |
 |
Quadrant B |
|---|---|---|---|
| Quadrant D |  |
 |
Quadrant C |
| Plot type | Count rate plots | Images |
|---|---|---|
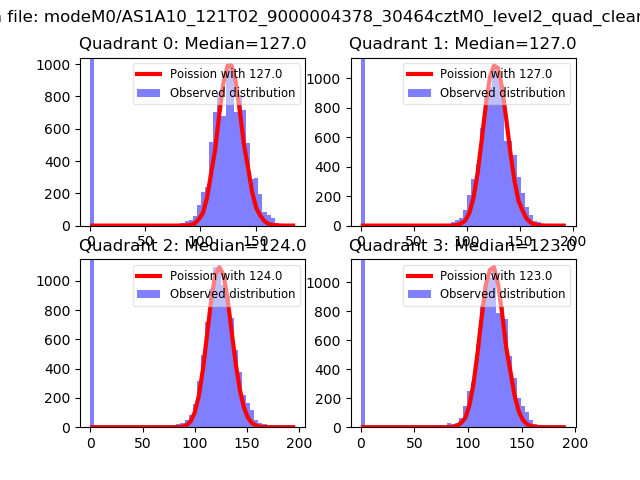
| Comparison with Poisson distribution Blue bars denote a histogram of data divided into 1 sec bins. Red curve is a Poisson curve with rate = median count rate of data. |
 |
 |
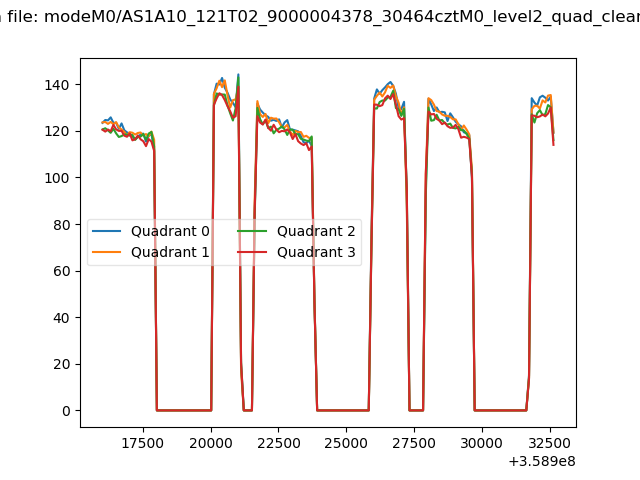
| Quadrant-wise count rates Data is divided into 100 sec bins |
 |
|
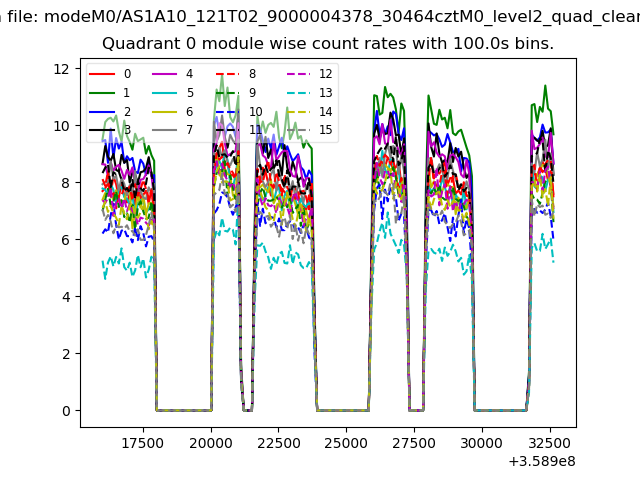
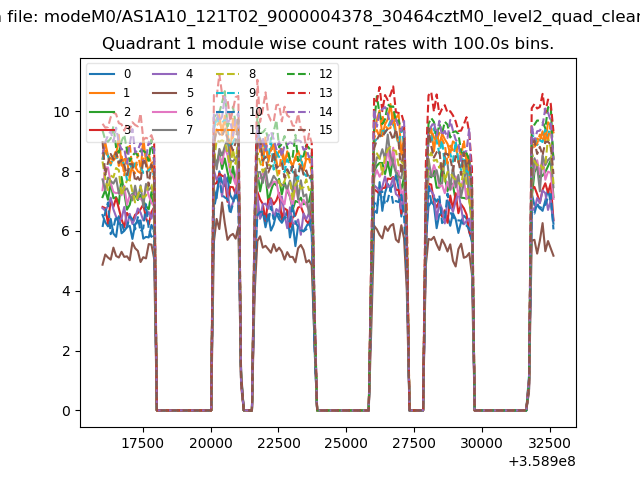
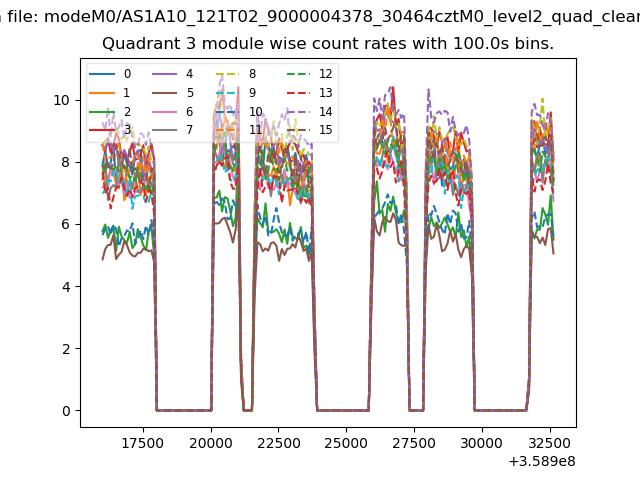
| Module-wise count rates for Quadrant A Data is divided into 100 sec bins |
 |
 |
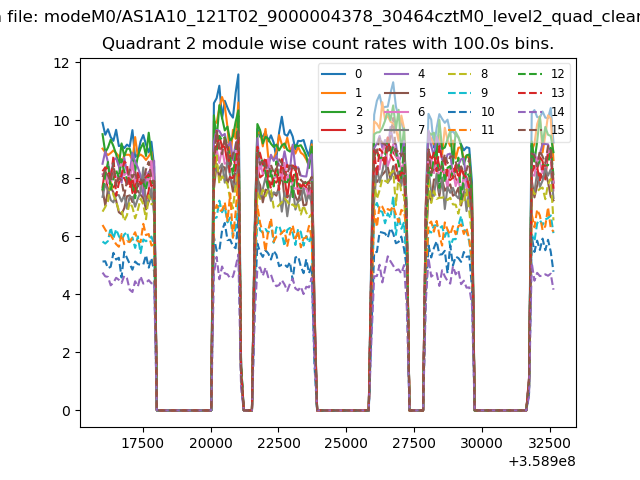
| Module-wise count rates for Quadrant B Data is divided into 100 sec bins |
 |
 |
| Module-wise count rates for Quadrant C Data is divided into 100 sec bins |
 |
 |
| Module-wise count rates for Quadrant D Data is divided into 100 sec bins |
 |
 |
| Parameter | Plot |
|---|---|
| CZT HV Monitor |  |
| D_VDD | 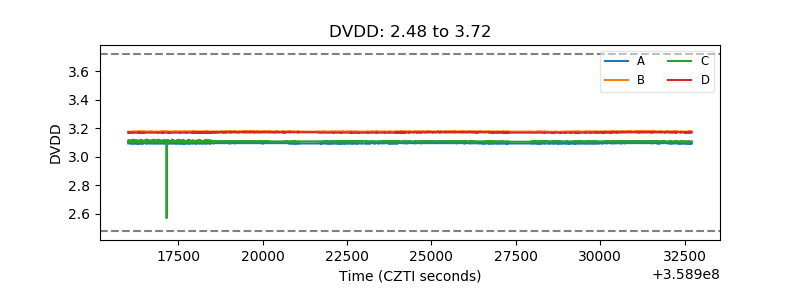 |
| Temperature 1 | 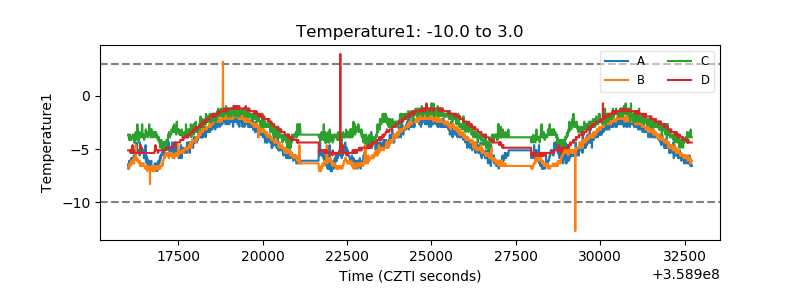 |
| Veto HV Monitor | 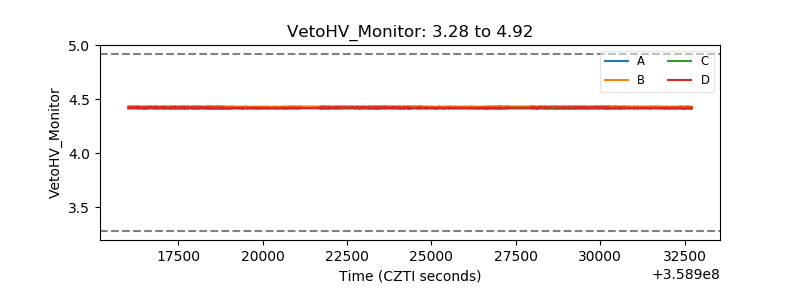 |
| Veto LLD | 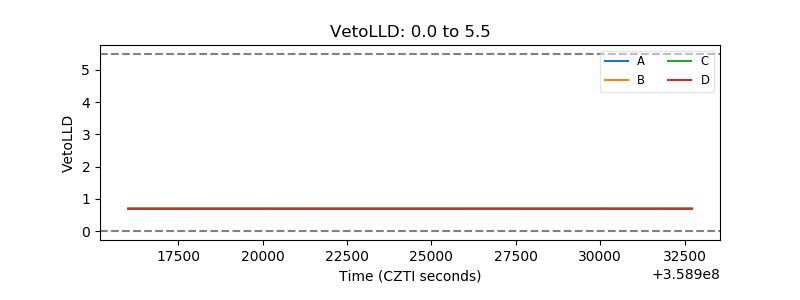 |
| Alpha Counter | 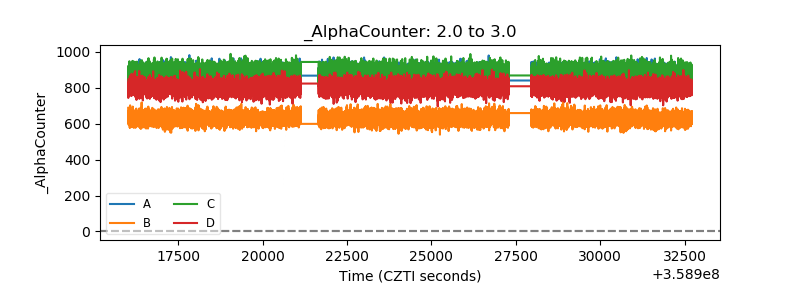 |
| _CPM_Rate | 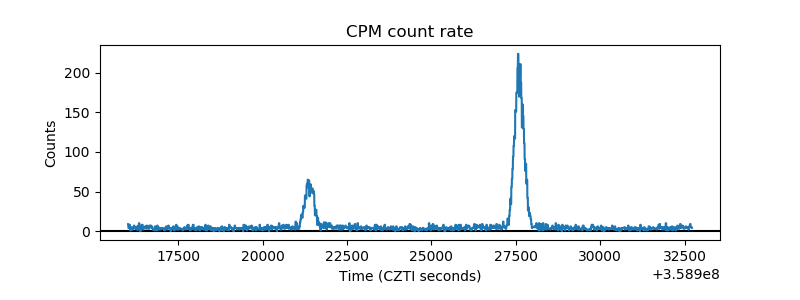 |
| CZT Counter | 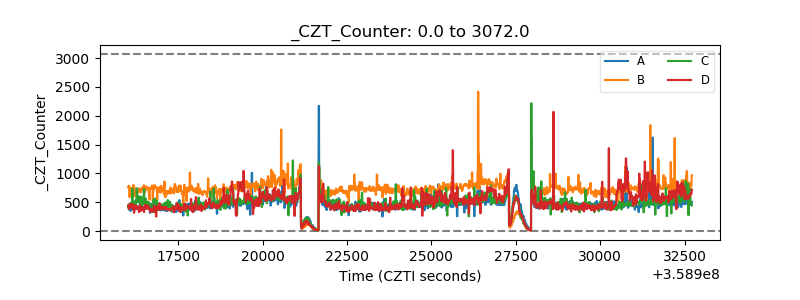 |
| +2.5 Volts monitor |  |
| +5 Volts monitor | 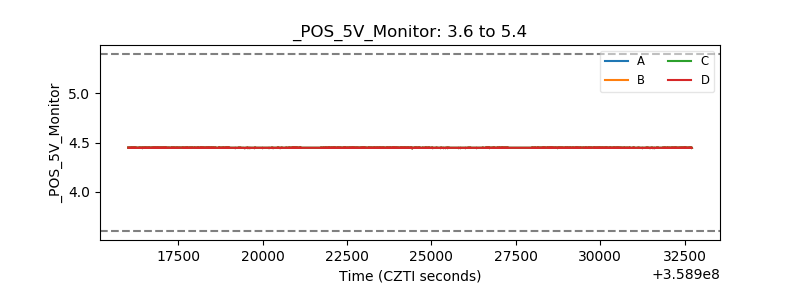 |
| _ROLL_ROT | 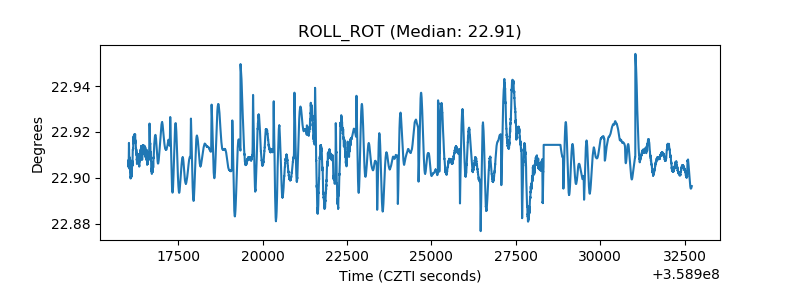 |
| _Roll_DEC | 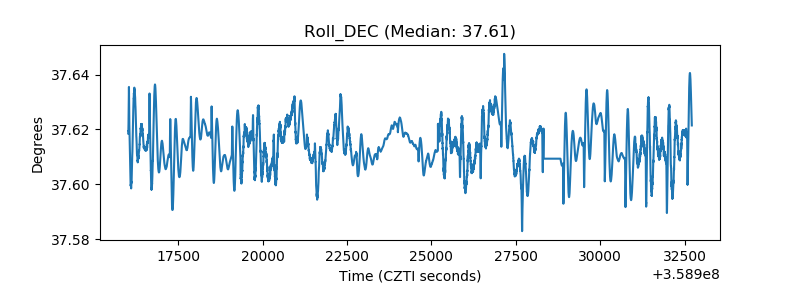 |
| _Roll_RA | 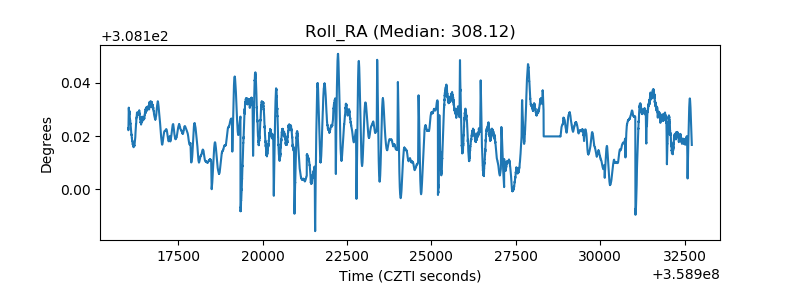 |
| Veto Counter | 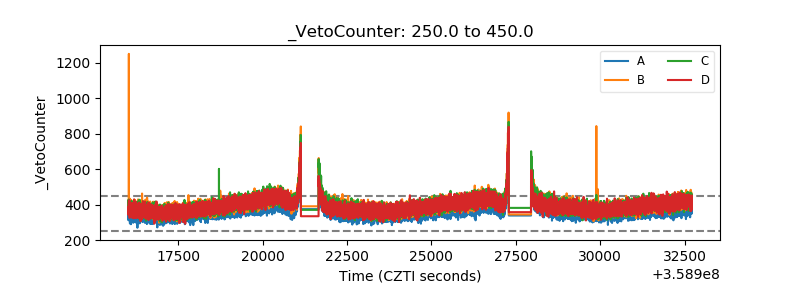 |