| Param | Original file | Final file |
|---|---|---|
| Filename | modeM0/AS1A10_058T03_9000004380_30467cztM0_level2.evt | modeM0/AS1A10_058T03_9000004380_30467cztM0_level2_quad_clean.evt |
| Size (bytes) | 583,272,000 | 96,998,400 |
| Size | 556.3 MB | 92.5 MB |
| Events in quadrant A | 3,562,404 | 630,376 |
| Events in quadrant B | 5,432,764 | 628,381 |
| Events in quadrant C | 4,372,884 | 601,075 |
| Events in quadrant D | 3,831,295 | 598,942 |
| Mode M9 | |||
|---|---|---|---|
| Quadrant | BADHDUFLAG | Total packets | Discarded packets |
| A | 0 | 21 | 0 |
| B | 0 | 21 | 0 |
| C | 0 | 21 | 0 |
| D | 0 | 21 | 0 |
| Mode M0 | |||
|---|---|---|---|
| Quadrant | BADHDUFLAG | Total packets | Discarded packets |
| A | 0 | 14951 | 2 |
| B | 0 | 20947 | 2 |
| C | 0 | 17444 | 2 |
| D | 0 | 15635 | 2 |
| Mode SS | |||
|---|---|---|---|
| Quadrant | BADHDUFLAG | Total packets | Discarded packets |
| A | 0 | 142 | 0 |
| B | 0 | 142 | 0 |
| C | 0 | 142 | 0 |
| D | 0 | 142 | 0 |
| Quadrant | Total seconds | Saturated seconds | Saturation percentage |
|---|---|---|---|
| A | 6868 | 100 | 1.456028% |
| B | 6868 | 148 | 2.154921% |
| C | 6868 | 349 | 5.081538% |
| D | 6869 | 65 | 0.946280% |
Noise dominated data is calculated using 1-second bins in cleaned event files. If a bin has >2000 counts, and if more than 50% of those come from <1% of pixels, then it is considered to be noise-dominated and hence unusable.
| Quadrant | # 1 sec bins | Bins with >0 counts | Bins with >2000 counts | High rate bins dominated by noise | Noise dominated (total time) | Noise dominated (detector-on time) | Marked lightcurve |
|---|---|---|---|---|---|---|---|
| A | 8998 | 6869 | 1 | 1 | 0.01% | 0.01% | 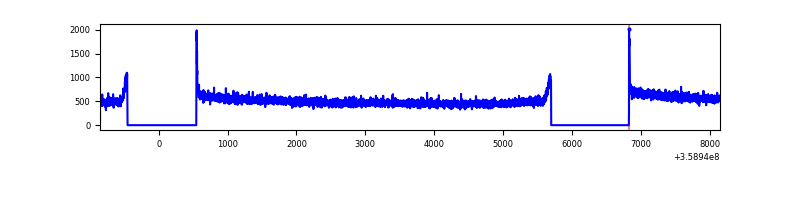 |
| B | 8998 | 6869 | 2 | 2 | 0.02% | 0.03% | 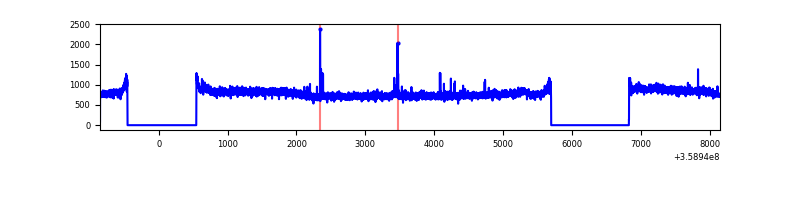 |
| C | 8998 | 6869 | 67 | 67 | 0.74% | 0.98% | 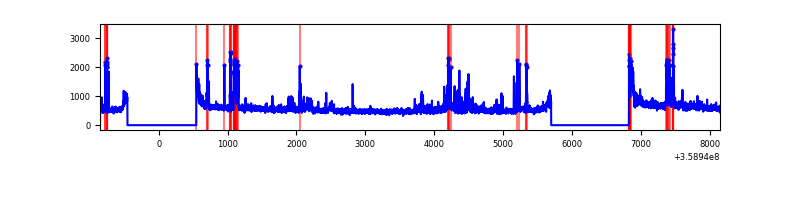 |
| D | 8999 | 6870 | 4 | 4 | 0.04% | 0.06% | 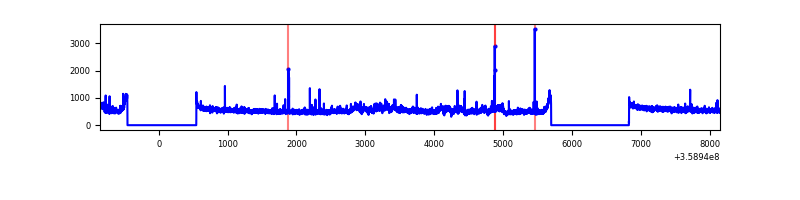 |
Top three noisy pixels from each quadrant. If the there are fewer than three noisy pixels in the level2.evt file, extra rows are filled as -1
| Pixel properties | Quadrant properties | ||||||
|---|---|---|---|---|---|---|---|
| Quadrant | DetID | PixID | Counts | Sigma | Mean | Median | Sigma |
| A | 8 | 192 | 24794 | 130.73 | 916 | 898 | 182.8 |
| A | 13 | 254 | 12093 | 61.25 | 916 | 898 | 182.8 |
| A | 3 | 137 | 8881 | 43.67 | 916 | 898 | 182.8 |
| B | 6 | 159 | 1872678 | 10937.73 | 899 | 878 | 171.1 |
| B | 0 | 229 | 23164 | 130.23 | 899 | 878 | 171.1 |
| B | 12 | 111 | 20869 | 116.82 | 899 | 878 | 171.1 |
| C | 3 | 233 | 351790 | 1759.81 | 862 | 869 | 199.4 |
| C | 15 | 208 | 344268 | 1722.09 | 862 | 869 | 199.4 |
| C | 14 | 238 | 144667 | 721.12 | 862 | 869 | 199.4 |
| D | 13 | 104 | 276663 | 1311.15 | 887 | 866 | 210.3 |
| D | 8 | 195 | 139275 | 658.0 | 887 | 866 | 210.3 |
| D | 2 | 250 | 29904 | 138.05 | 887 | 866 | 210.3 |
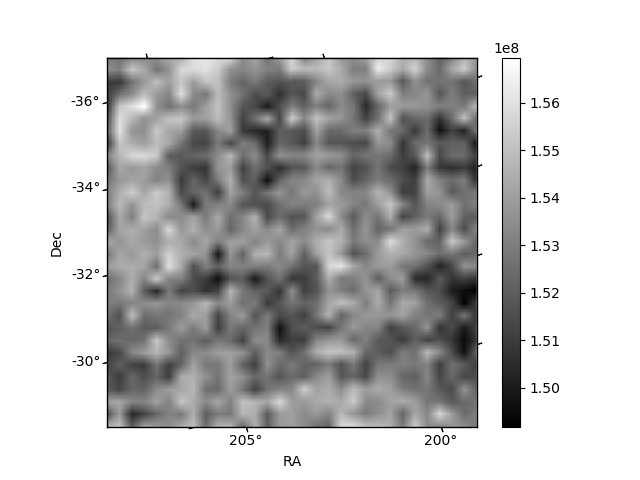
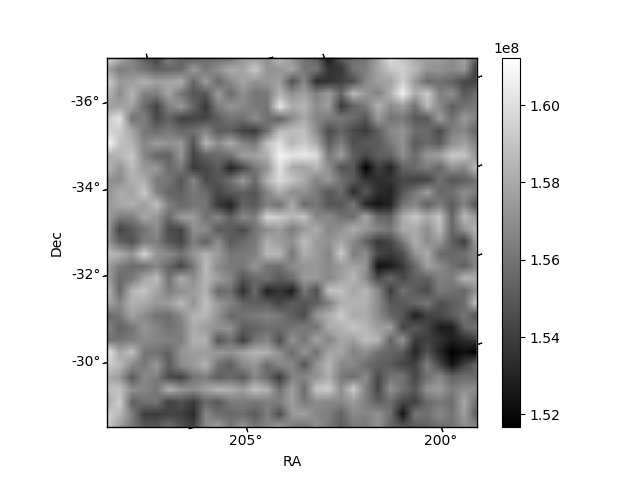
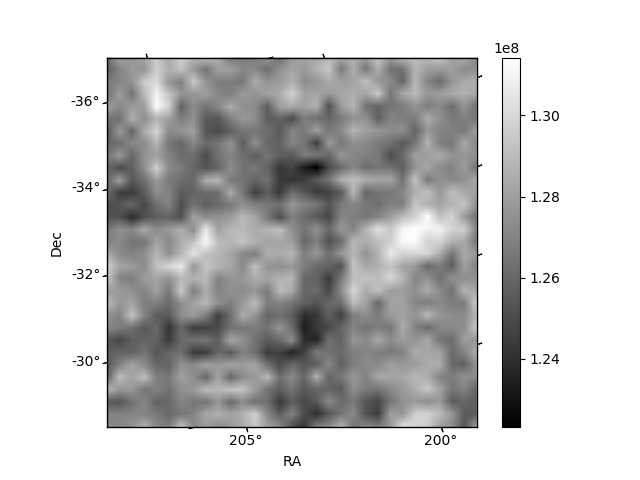
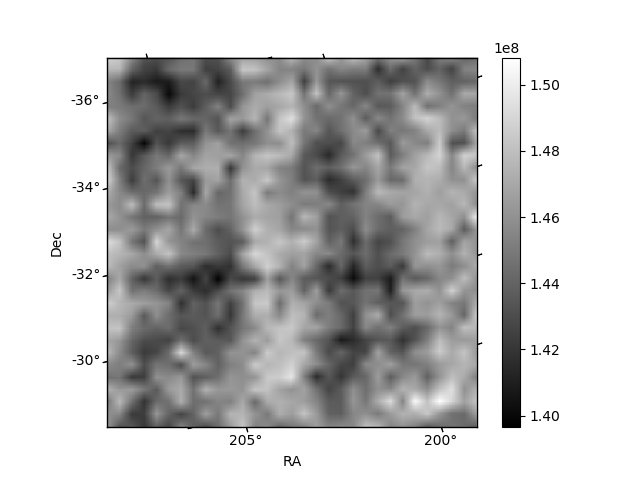
Histogram calculated using DETX and DETY for each event in the final _common_clean file
| Quadrant A | 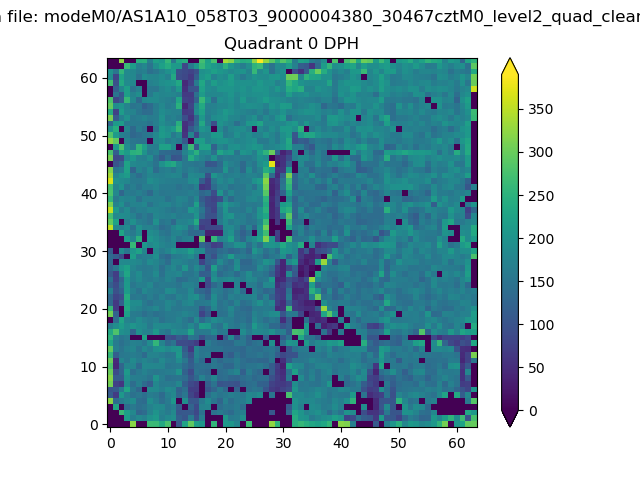 |
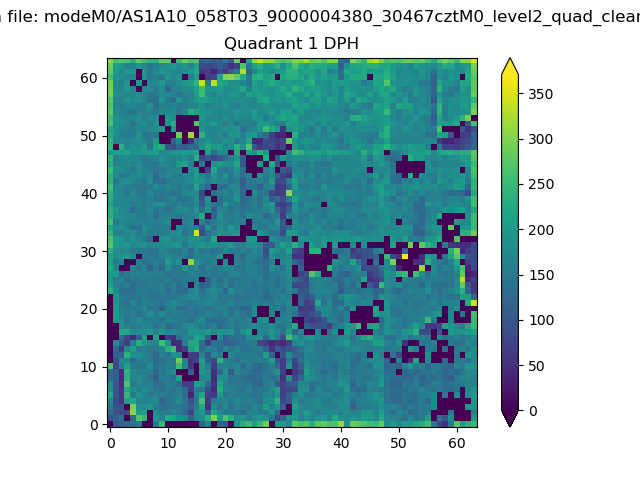 |
Quadrant B |
|---|---|---|---|
| Quadrant D | 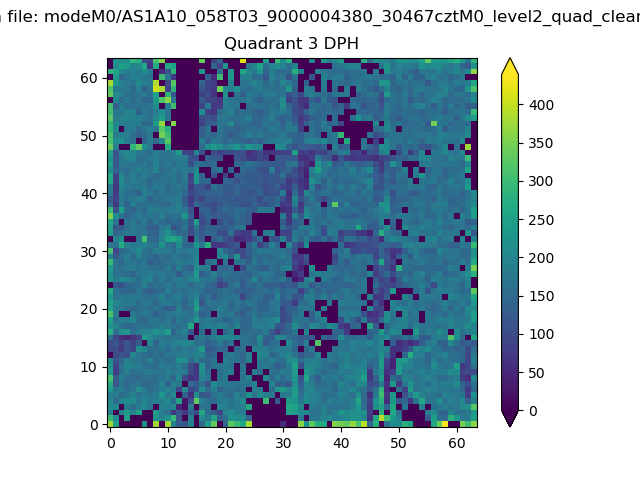 |
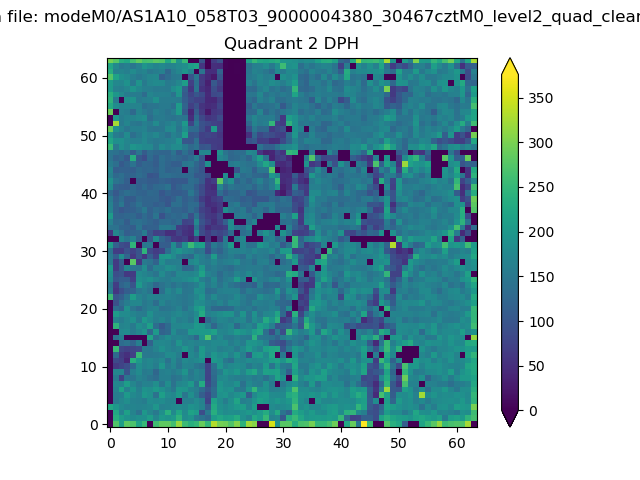 |
Quadrant C |
| Plot type | Count rate plots | Images |
|---|---|---|
| Comparison with Poisson distribution Blue bars denote a histogram of data divided into 1 sec bins. Red curve is a Poisson curve with rate = median count rate of data. |
 |
 |
| Quadrant-wise count rates Data is divided into 100 sec bins |
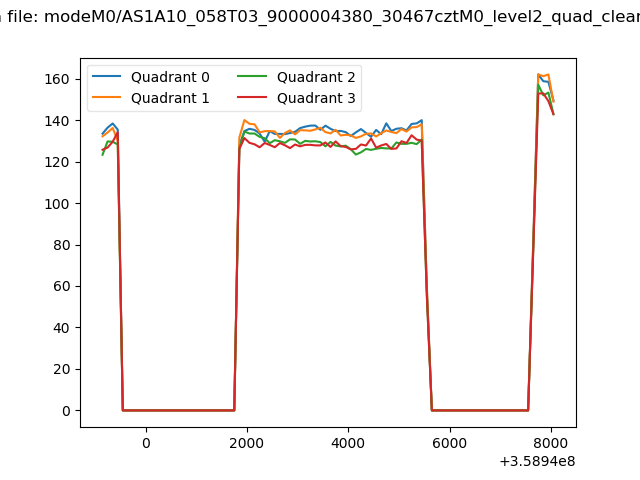 |
|
| Module-wise count rates for Quadrant A Data is divided into 100 sec bins |
 |
 |
| Module-wise count rates for Quadrant B Data is divided into 100 sec bins |
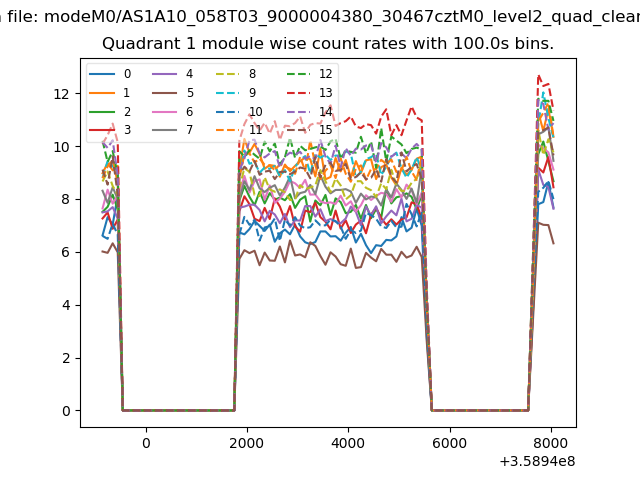 |
 |
| Module-wise count rates for Quadrant C Data is divided into 100 sec bins |
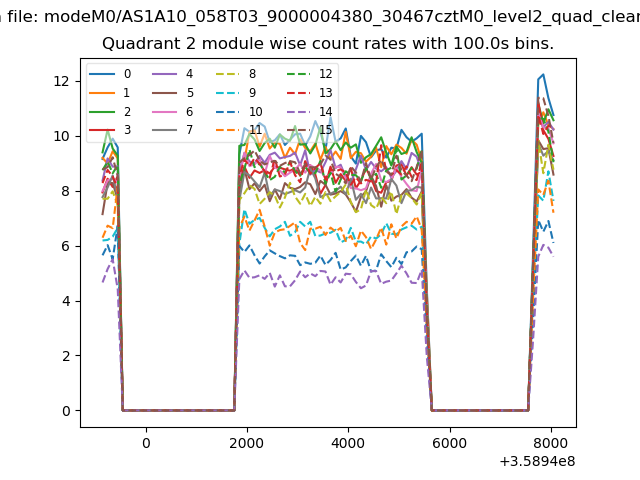 |
 |
| Module-wise count rates for Quadrant D Data is divided into 100 sec bins |
 |
 |
| Parameter | Plot |
|---|---|
| CZT HV Monitor | 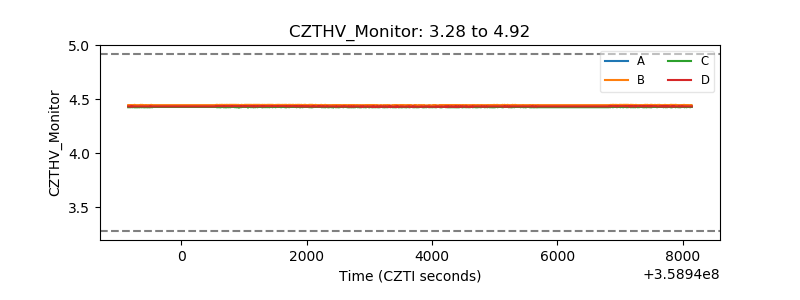 |
| D_VDD | 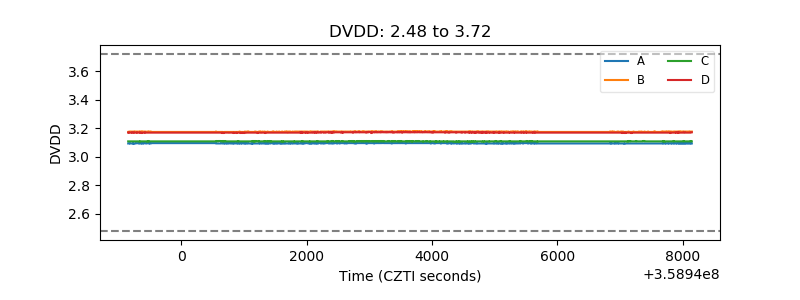 |
| Temperature 1 | 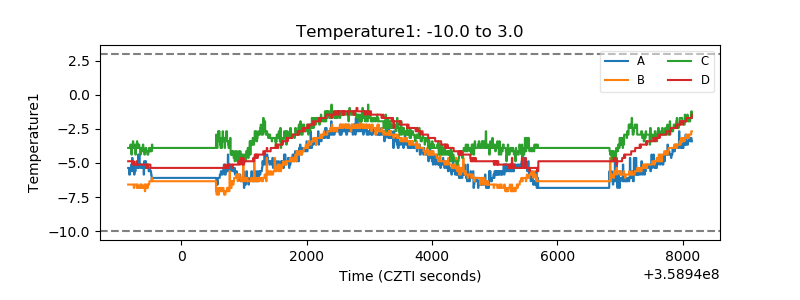 |
| Veto HV Monitor | 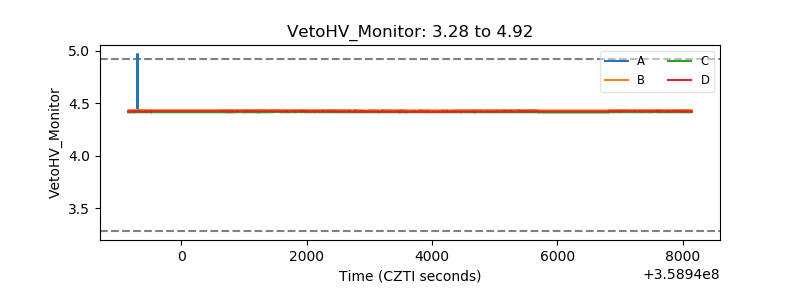 |
| Veto LLD | 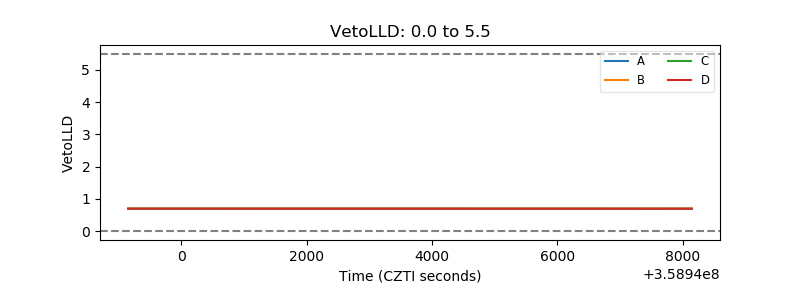 |
| Alpha Counter | 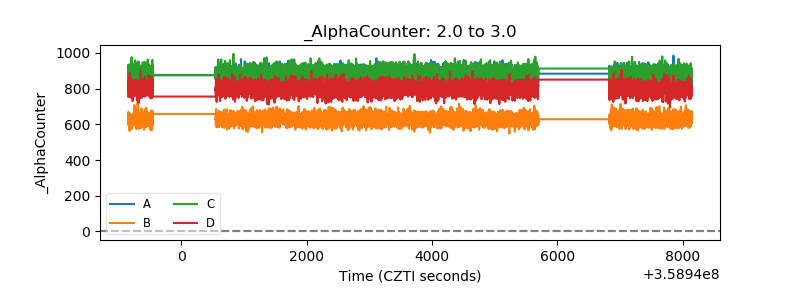 |
| _CPM_Rate | 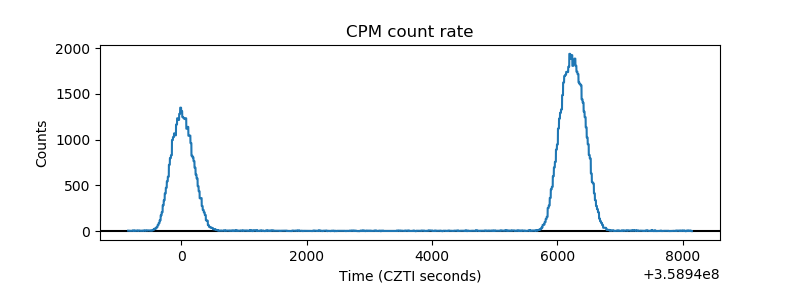 |
| CZT Counter | 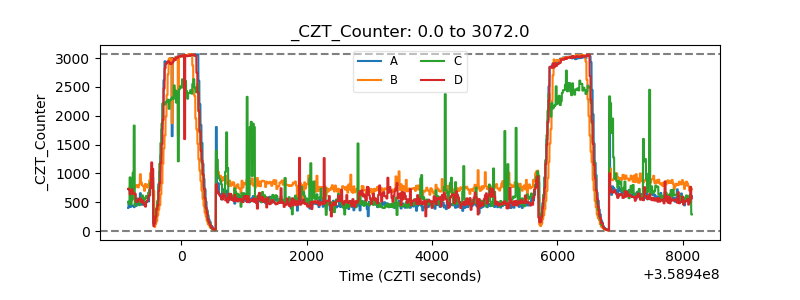 |
| +2.5 Volts monitor |  |
| +5 Volts monitor |  |
| _ROLL_ROT |  |
| _Roll_DEC | 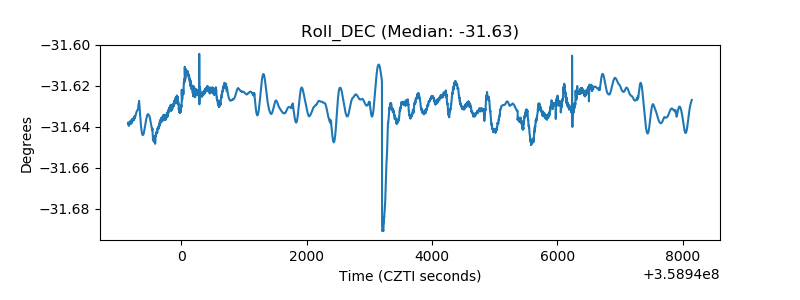 |
| _Roll_RA | 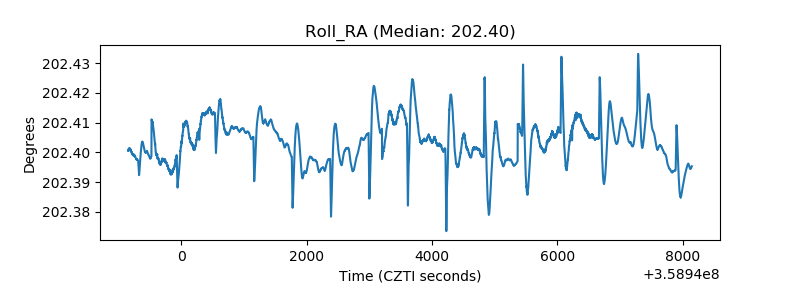 |
| Veto Counter |  |