| Param | Original file | Final file |
|---|---|---|
| Filename | modeM0/AS1A10_058T03_9000004380_30469cztM0_level2.evt | modeM0/AS1A10_058T03_9000004380_30469cztM0_level2_quad_clean.evt |
| Size (bytes) | 532,529,280 | 116,098,560 |
| Size | 507.9 MB | 110.7 MB |
| Events in quadrant A | 3,393,704 | 807,230 |
| Events in quadrant B | 4,906,091 | 802,206 |
| Events in quadrant C | 3,565,661 | 748,288 |
| Events in quadrant D | 3,857,653 | 741,359 |
| Mode M9 | |||
|---|---|---|---|
| Quadrant | BADHDUFLAG | Total packets | Discarded packets |
| A | 0 | 13 | 0 |
| B | 0 | 13 | 0 |
| C | 0 | 13 | 0 |
| D | 0 | 13 | 0 |
| Mode M0 | |||
|---|---|---|---|
| Quadrant | BADHDUFLAG | Total packets | Discarded packets |
| A | 0 | 14054 | 1 |
| B | 0 | 18469 | 1 |
| C | 0 | 14565 | 1 |
| D | 0 | 15711 | 3 |
| Mode SS | |||
|---|---|---|---|
| Quadrant | BADHDUFLAG | Total packets | Discarded packets |
| A | 0 | 122 | 0 |
| B | 0 | 122 | 0 |
| C | 0 | 122 | 0 |
| D | 0 | 122 | 0 |
| Quadrant | Total seconds | Saturated seconds | Saturation percentage |
|---|---|---|---|
| A | 5973 | 96 | 1.607233% |
| B | 5973 | 137 | 2.293655% |
| C | 5974 | 275 | 4.603281% |
| D | 5973 | 149 | 2.494559% |
Noise dominated data is calculated using 1-second bins in cleaned event files. If a bin has >2000 counts, and if more than 50% of those come from <1% of pixels, then it is considered to be noise-dominated and hence unusable.
| Quadrant | # 1 sec bins | Bins with >0 counts | Bins with >2000 counts | High rate bins dominated by noise | Noise dominated (total time) | Noise dominated (detector-on time) | Marked lightcurve |
|---|---|---|---|---|---|---|---|
| A | 7248 | 5974 | 8 | 8 | 0.11% | 0.13% | 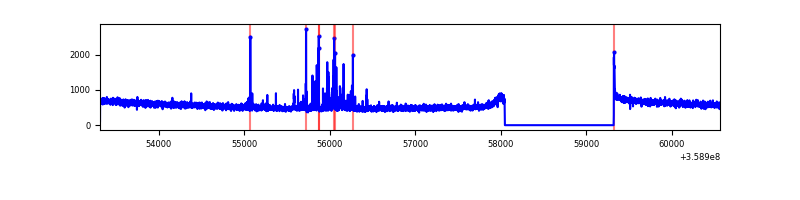 |
| B | 7248 | 5974 | 1 | 1 | 0.01% | 0.02% | 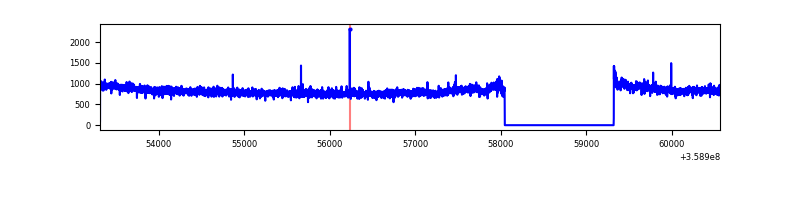 |
| C | 7249 | 5975 | 18 | 18 | 0.25% | 0.30% | 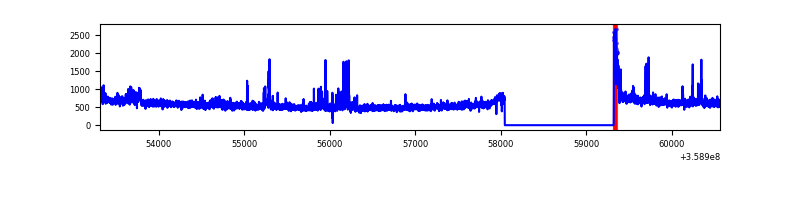 |
| D | 7248 | 5974 | 100 | 100 | 1.38% | 1.67% | 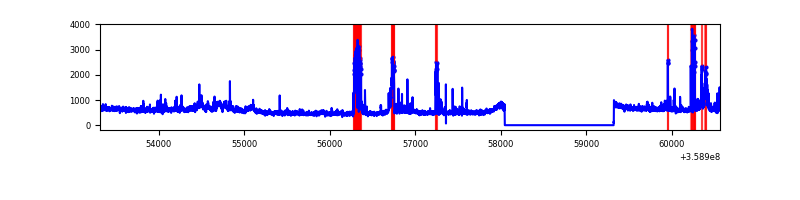 |
Top three noisy pixels from each quadrant. If the there are fewer than three noisy pixels in the level2.evt file, extra rows are filled as -1
| Pixel properties | Quadrant properties | ||||||
|---|---|---|---|---|---|---|---|
| Quadrant | DetID | PixID | Counts | Sigma | Mean | Median | Sigma |
| A | 0 | 13 | 104394 | 622.79 | 850 | 838 | 166.3 |
| A | 13 | 254 | 11215 | 62.41 | 850 | 838 | 166.3 |
| A | 8 | 192 | 11176 | 62.17 | 850 | 838 | 166.3 |
| B | 6 | 159 | 1626103 | 10627.58 | 826 | 811 | 152.9 |
| B | 0 | 229 | 29549 | 187.91 | 826 | 811 | 152.9 |
| B | 12 | 111 | 18176 | 113.55 | 826 | 811 | 152.9 |
| C | 14 | 238 | 157405 | 871.86 | 782 | 788 | 179.6 |
| C | 3 | 233 | 111540 | 616.53 | 782 | 788 | 179.6 |
| C | 15 | 208 | 75243 | 414.48 | 782 | 788 | 179.6 |
| D | 13 | 104 | 462289 | 2431.16 | 808 | 789 | 189.8 |
| D | 8 | 195 | 138363 | 724.73 | 808 | 789 | 189.8 |
| D | 7 | 238 | 85021 | 443.73 | 808 | 789 | 189.8 |
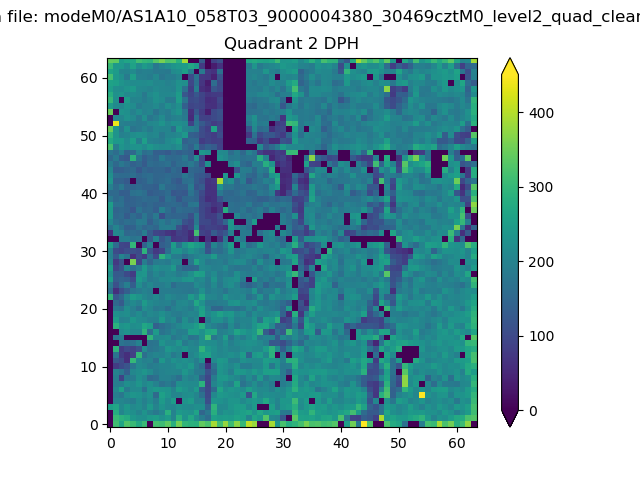
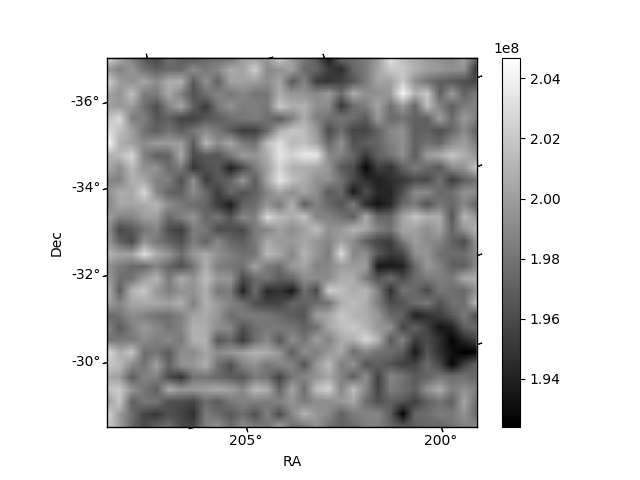
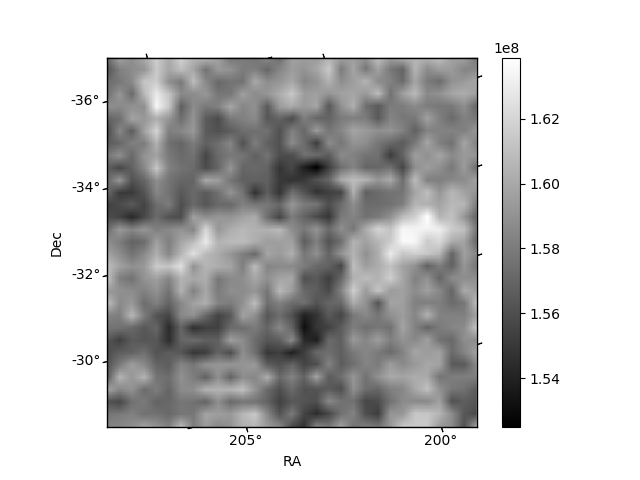
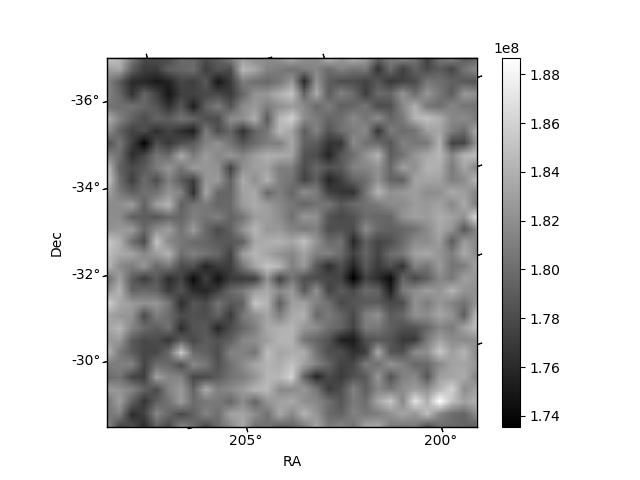
Histogram calculated using DETX and DETY for each event in the final _common_clean file
| Quadrant A | 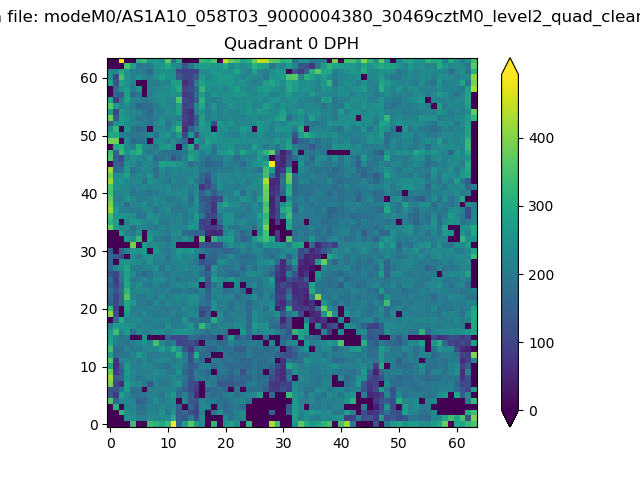 |
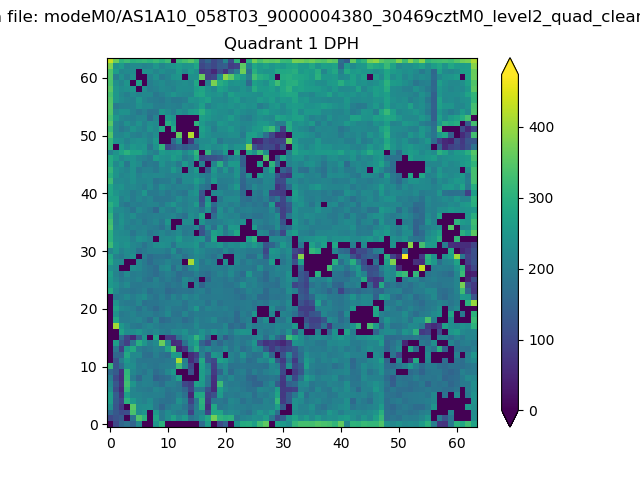 |
Quadrant B |
|---|---|---|---|
| Quadrant D | 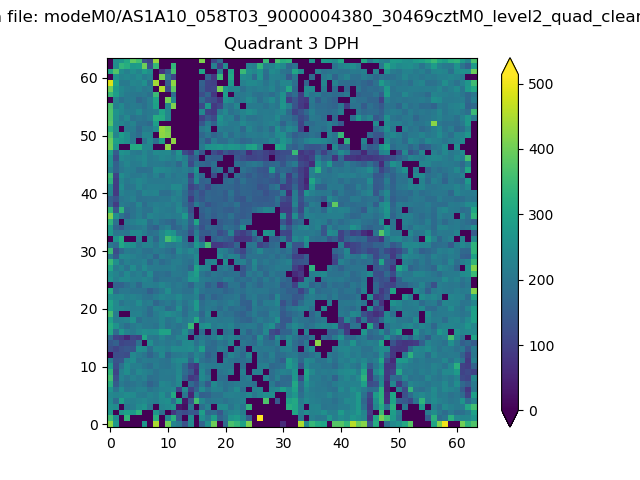 |
 |
Quadrant C |
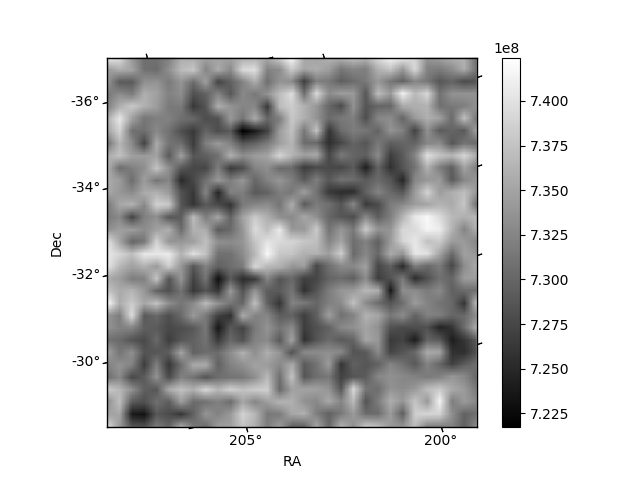
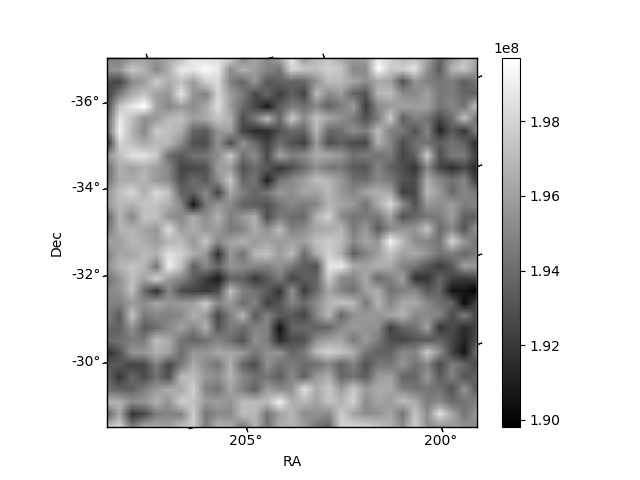
| Plot type | Count rate plots | Images |
|---|---|---|
| Comparison with Poisson distribution Blue bars denote a histogram of data divided into 1 sec bins. Red curve is a Poisson curve with rate = median count rate of data. |
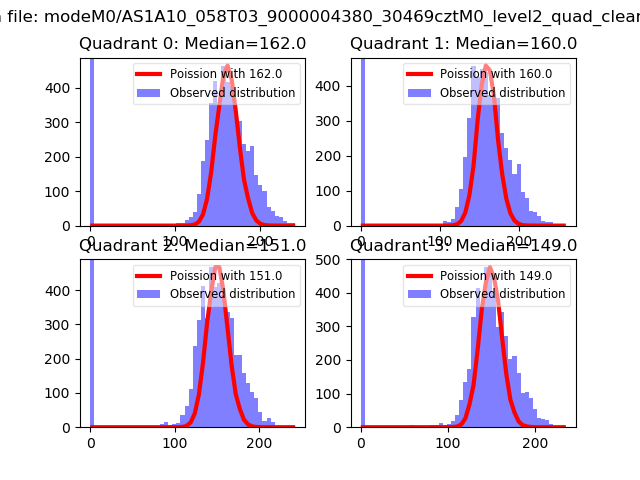 |
 |
| Quadrant-wise count rates Data is divided into 100 sec bins |
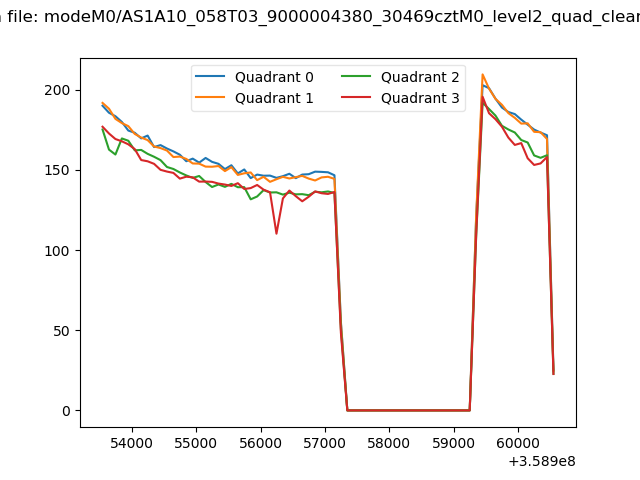 |
|
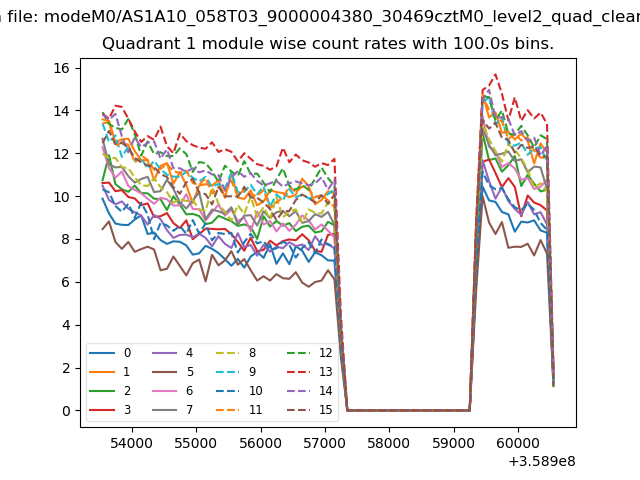
| Module-wise count rates for Quadrant A Data is divided into 100 sec bins |
 |
 |
| Module-wise count rates for Quadrant B Data is divided into 100 sec bins |
 |
 |
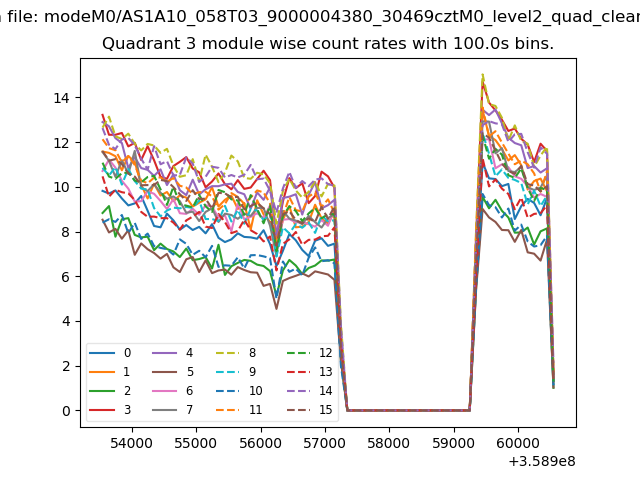
| Module-wise count rates for Quadrant C Data is divided into 100 sec bins |
 |
 |
| Module-wise count rates for Quadrant D Data is divided into 100 sec bins |
 |
 |
| Parameter | Plot |
|---|---|
| CZT HV Monitor | 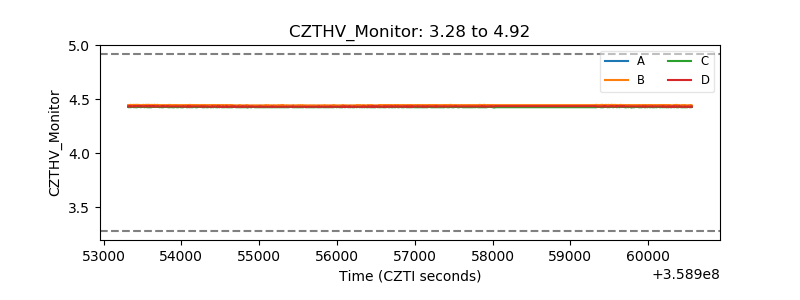 |
| D_VDD | 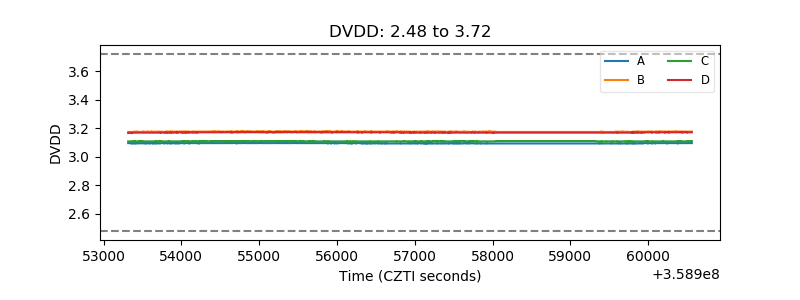 |
| Temperature 1 | 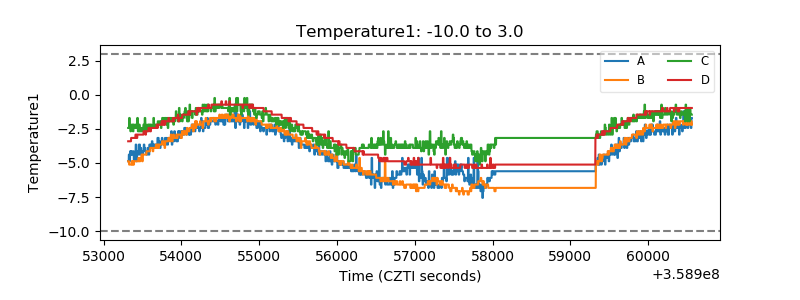 |
| Veto HV Monitor |  |
| Veto LLD | 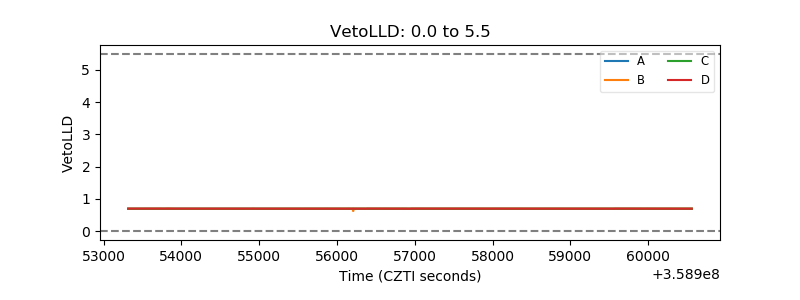 |
| Alpha Counter | 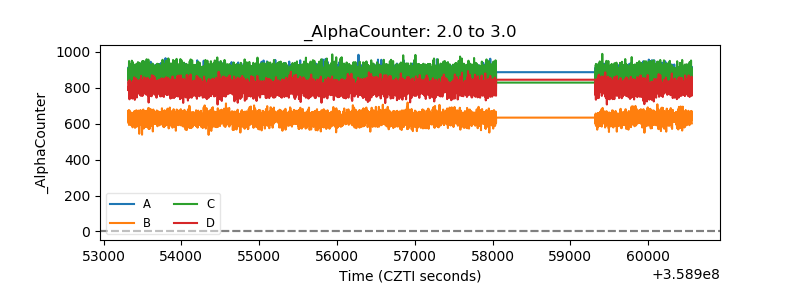 |
| _CPM_Rate | 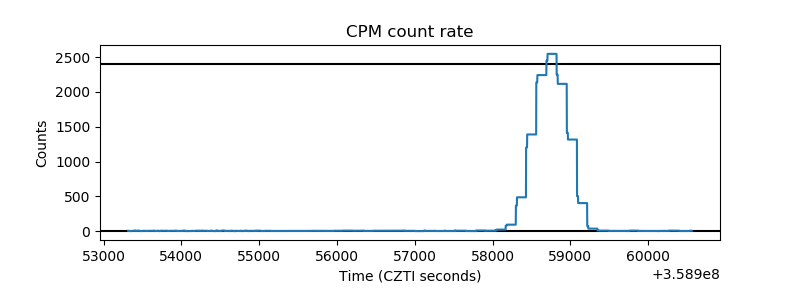 |
| CZT Counter | 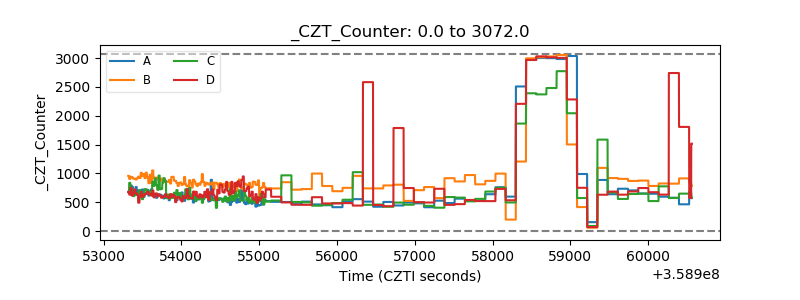 |
| +2.5 Volts monitor | 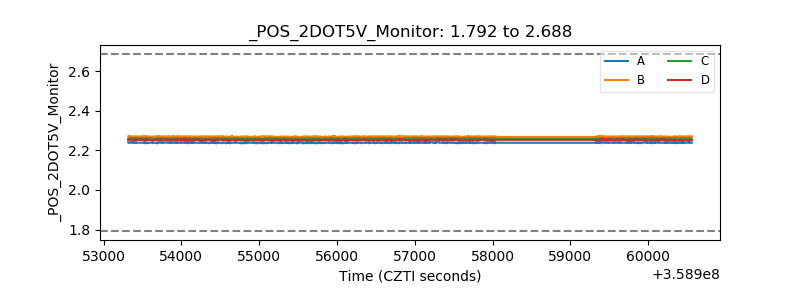 |
| +5 Volts monitor | 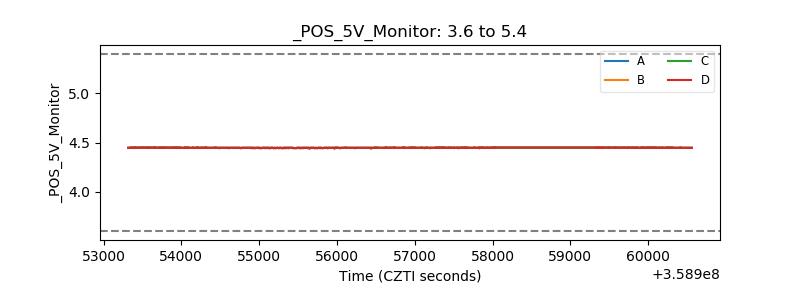 |
| _ROLL_ROT | 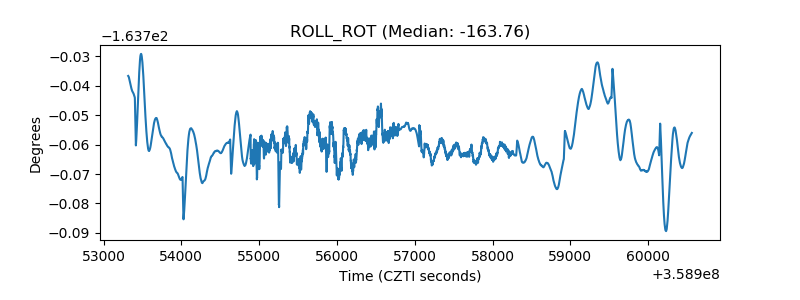 |
| _Roll_DEC | 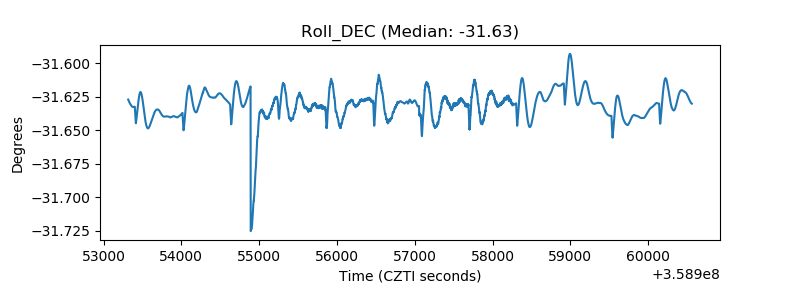 |
| _Roll_RA | 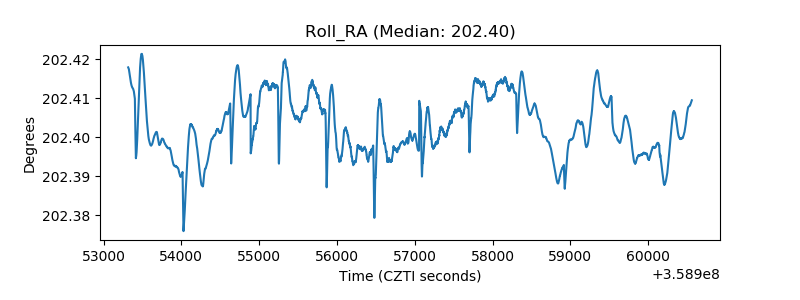 |
| Veto Counter | 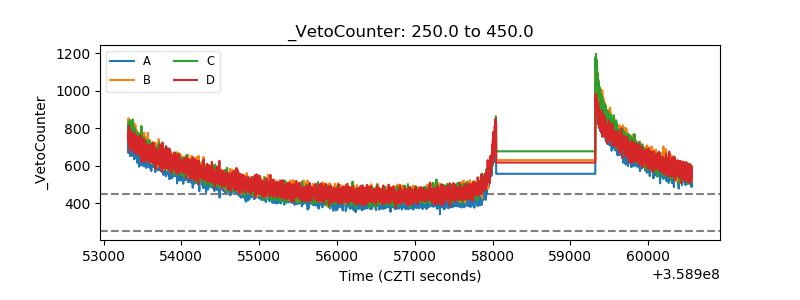 |