| Param | Original file | Final file |
|---|---|---|
| Filename | modeM0/AS1A10_058T03_9000004380_30471cztM0_level2.evt | modeM0/AS1A10_058T03_9000004380_30471cztM0_level2_quad_clean.evt |
| Size (bytes) | 547,643,520 | 102,441,600 |
| Size | 522.3 MB | 97.7 MB |
| Events in quadrant A | 3,258,568 | 703,923 |
| Events in quadrant B | 4,955,005 | 695,071 |
| Events in quadrant C | 3,961,978 | 630,596 |
| Events in quadrant D | 3,990,256 | 640,551 |
| Mode M9 | |||
|---|---|---|---|
| Quadrant | BADHDUFLAG | Total packets | Discarded packets |
| A | 0 | 12 | 0 |
| B | 0 | 12 | 0 |
| C | 0 | 12 | 0 |
| D | 0 | 12 | 0 |
| Mode M0 | |||
|---|---|---|---|
| Quadrant | BADHDUFLAG | Total packets | Discarded packets |
| A | 0 | 13508 | 2 |
| B | 0 | 18941 | 1 |
| C | 0 | 15729 | 1 |
| D | 0 | 15785 | 1 |
| Mode SS | |||
|---|---|---|---|
| Quadrant | BADHDUFLAG | Total packets | Discarded packets |
| A | 0 | 128 | 0 |
| B | 0 | 128 | 0 |
| C | 0 | 128 | 0 |
| D | 0 | 128 | 0 |
| Quadrant | Total seconds | Saturated seconds | Saturation percentage |
|---|---|---|---|
| A | 6184 | 112 | 1.811125% |
| B | 6185 | 155 | 2.506063% |
| C | 6185 | 515 | 8.326597% |
| D | 6185 | 124 | 2.004850% |
Noise dominated data is calculated using 1-second bins in cleaned event files. If a bin has >2000 counts, and if more than 50% of those come from <1% of pixels, then it is considered to be noise-dominated and hence unusable.
| Quadrant | # 1 sec bins | Bins with >0 counts | Bins with >2000 counts | High rate bins dominated by noise | Noise dominated (total time) | Noise dominated (detector-on time) | Marked lightcurve |
|---|---|---|---|---|---|---|---|
| A | 7419 | 6185 | 9 | 9 | 0.12% | 0.15% | 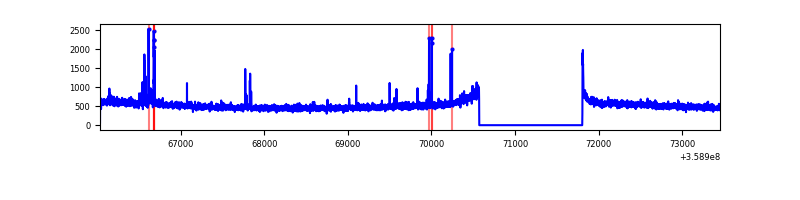 |
| B | 7420 | 6186 | 5 | 5 | 0.07% | 0.08% | 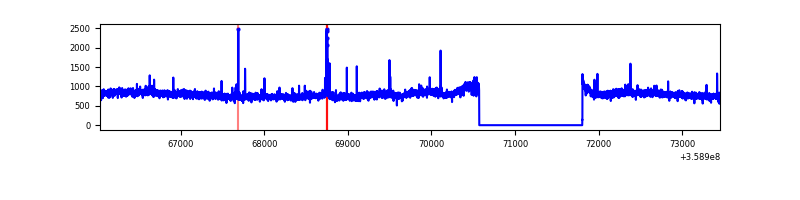 |
| C | 7420 | 6186 | 109 | 109 | 1.47% | 1.76% | 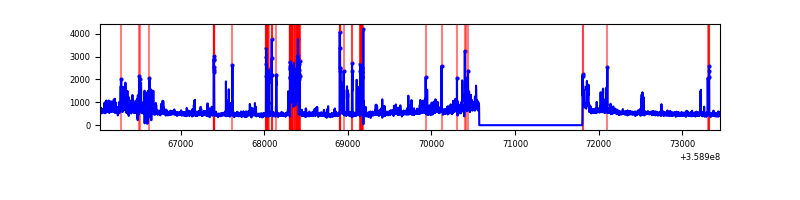 |
| D | 7420 | 6186 | 69 | 69 | 0.93% | 1.12% | 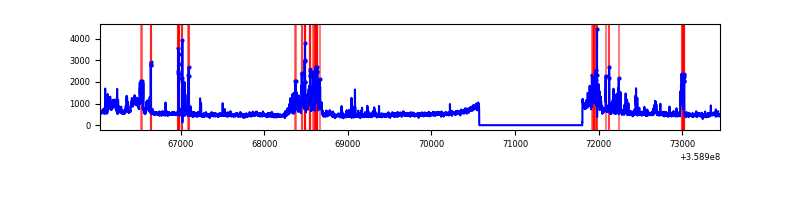 |
Top three noisy pixels from each quadrant. If the there are fewer than three noisy pixels in the level2.evt file, extra rows are filled as -1
| Pixel properties | Quadrant properties | ||||||
|---|---|---|---|---|---|---|---|
| Quadrant | DetID | PixID | Counts | Sigma | Mean | Median | Sigma |
| A | 0 | 13 | 68419 | 417.26 | 815 | 803 | 162.0 |
| A | 12 | 96 | 34736 | 209.4 | 815 | 803 | 162.0 |
| A | 13 | 254 | 12246 | 70.61 | 815 | 803 | 162.0 |
| B | 6 | 159 | 1732296 | 11440.64 | 797 | 780 | 151.3 |
| B | 0 | 230 | 38399 | 248.56 | 797 | 780 | 151.3 |
| B | 0 | 229 | 36577 | 236.52 | 797 | 780 | 151.3 |
| C | 15 | 208 | 665635 | 3932.16 | 735 | 739 | 169.1 |
| C | 14 | 238 | 205304 | 1209.79 | 735 | 739 | 169.1 |
| C | 14 | 254 | 112531 | 661.13 | 735 | 739 | 169.1 |
| D | 13 | 104 | 645524 | 3326.77 | 768 | 752 | 193.8 |
| D | 8 | 195 | 168826 | 867.19 | 768 | 752 | 193.8 |
| D | 7 | 238 | 147015 | 754.66 | 768 | 752 | 193.8 |
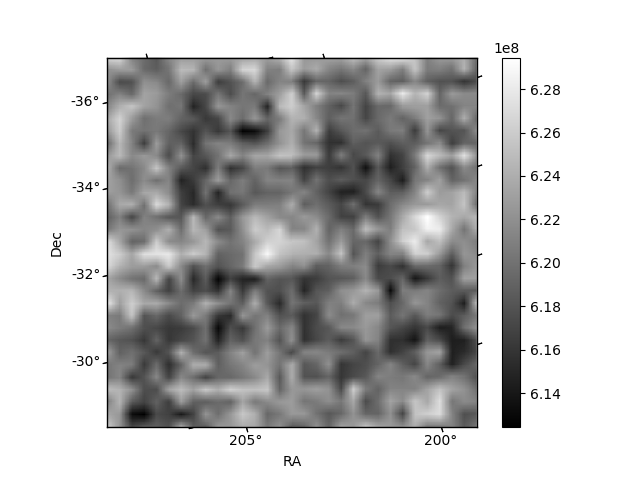
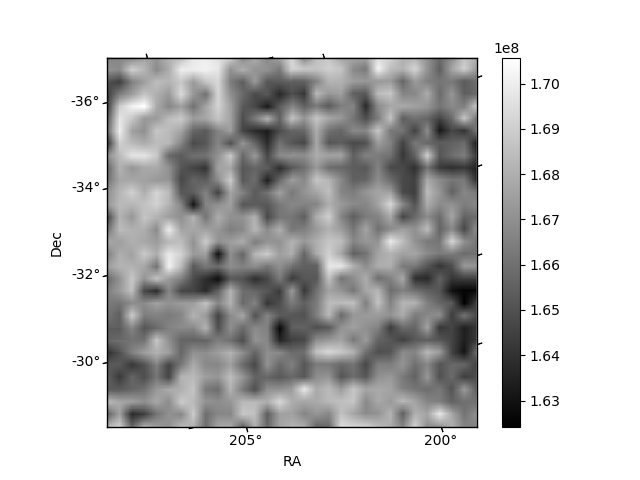
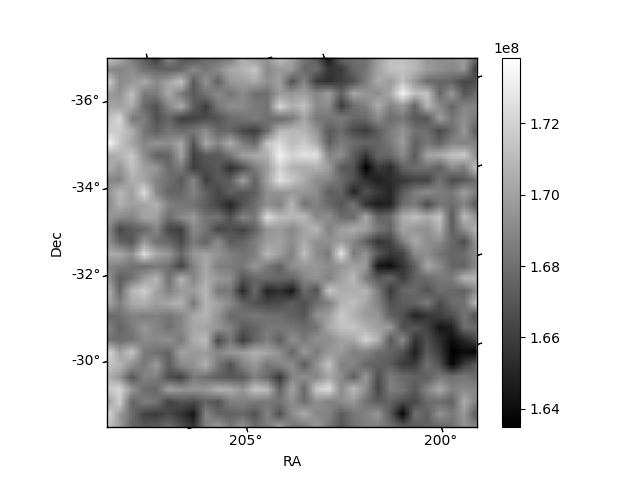
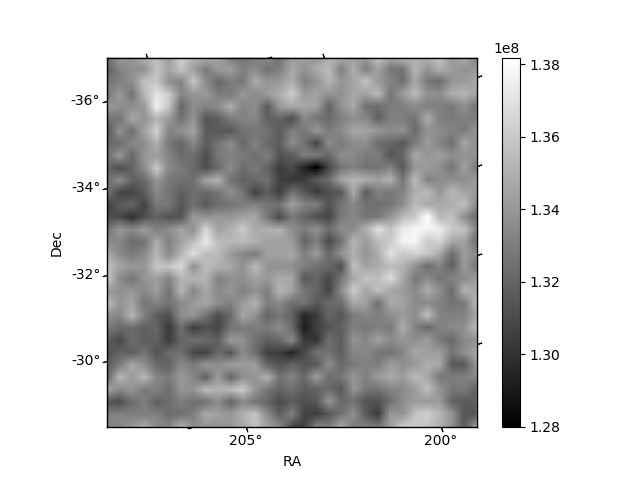
Histogram calculated using DETX and DETY for each event in the final _common_clean file
| Quadrant A | 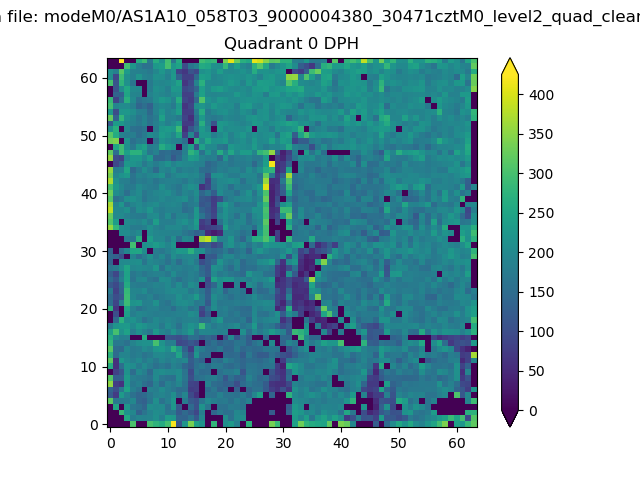 |
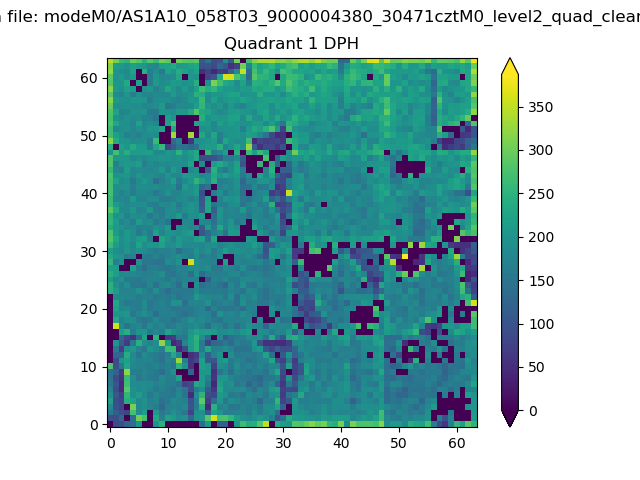 |
Quadrant B |
|---|---|---|---|
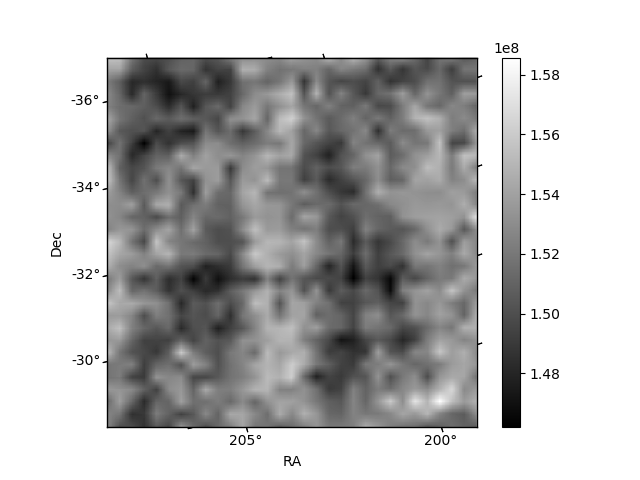
| Quadrant D | 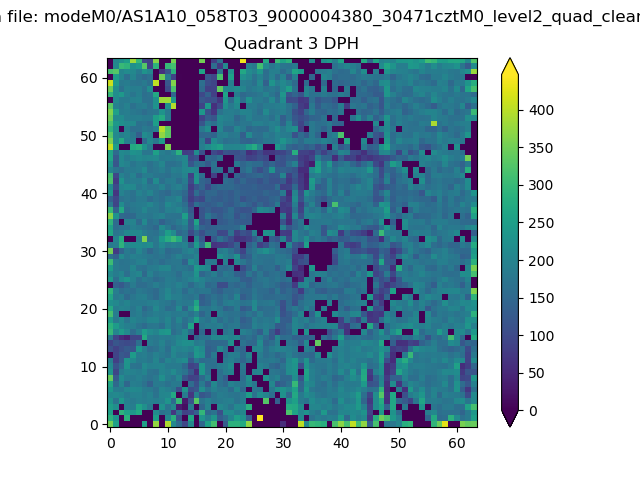 |
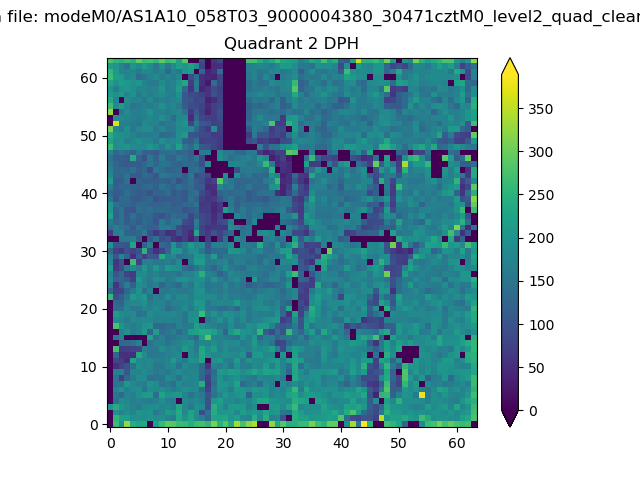 |
Quadrant C |
| Plot type | Count rate plots | Images |
|---|---|---|
| Comparison with Poisson distribution Blue bars denote a histogram of data divided into 1 sec bins. Red curve is a Poisson curve with rate = median count rate of data. |
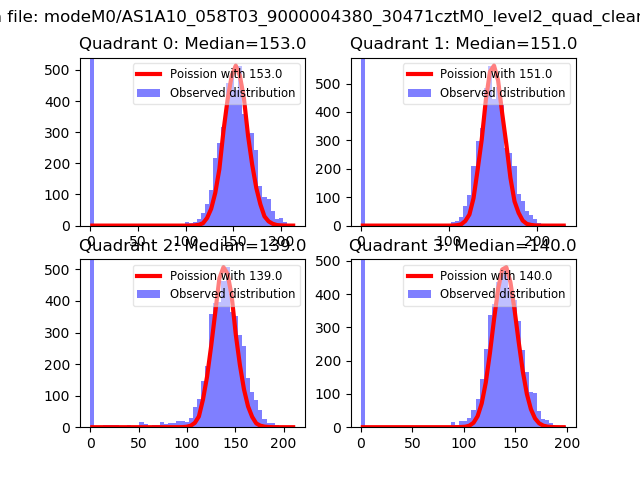 |
 |
| Quadrant-wise count rates Data is divided into 100 sec bins |
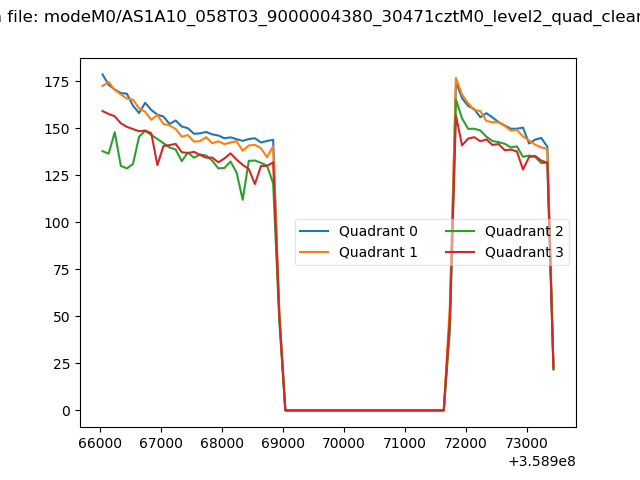 |
|
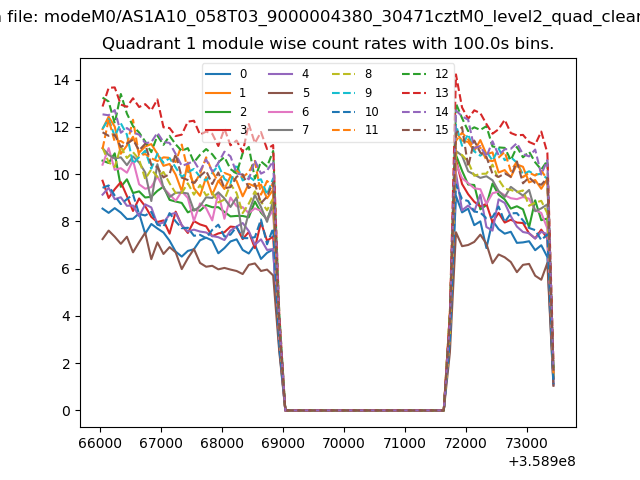
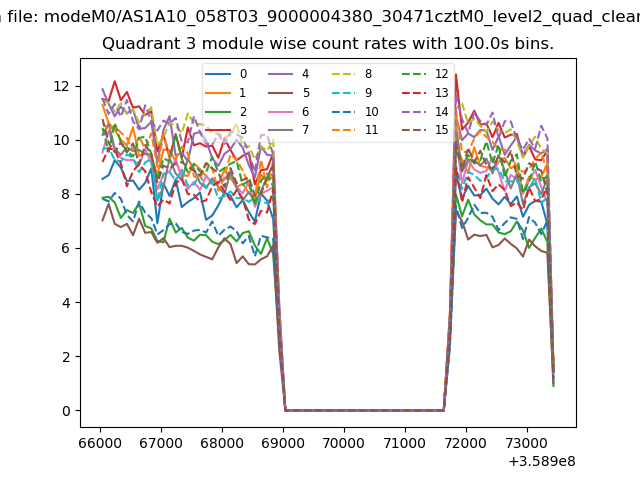
| Module-wise count rates for Quadrant A Data is divided into 100 sec bins |
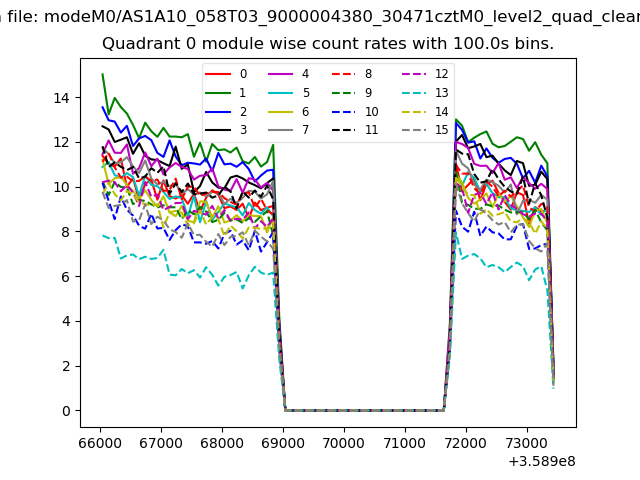 |
 |
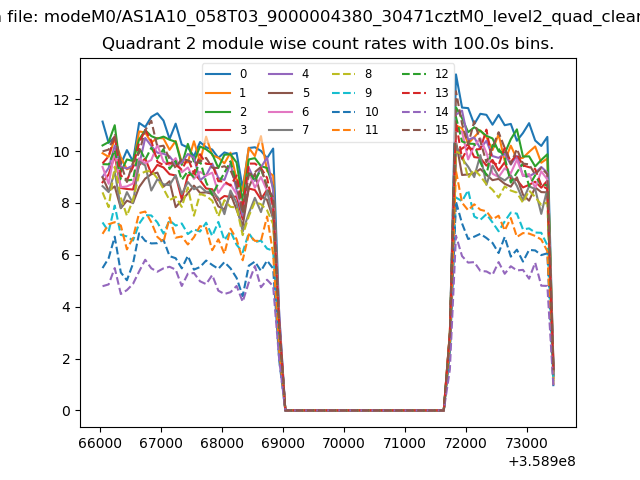
| Module-wise count rates for Quadrant B Data is divided into 100 sec bins |
 |
 |
| Module-wise count rates for Quadrant C Data is divided into 100 sec bins |
 |
 |
| Module-wise count rates for Quadrant D Data is divided into 100 sec bins |
 |
 |
| Parameter | Plot |
|---|---|
| CZT HV Monitor | 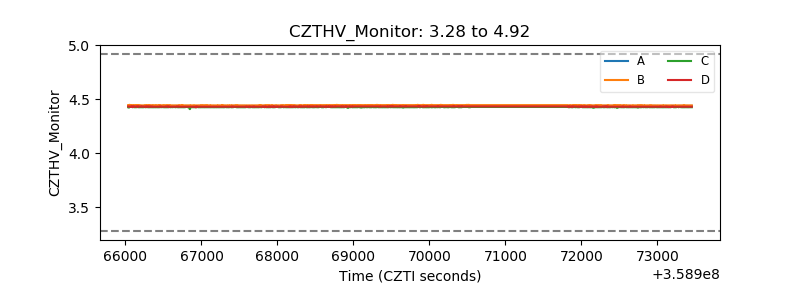 |
| D_VDD | 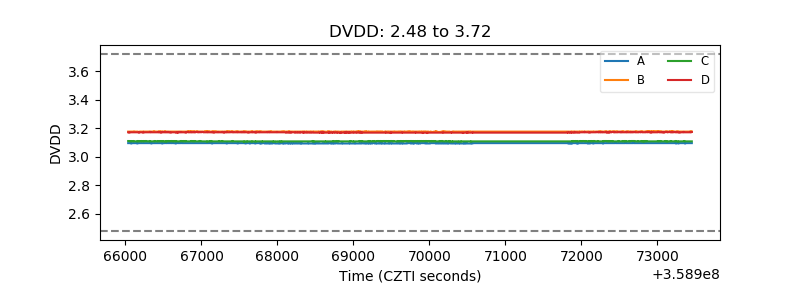 |
| Temperature 1 | 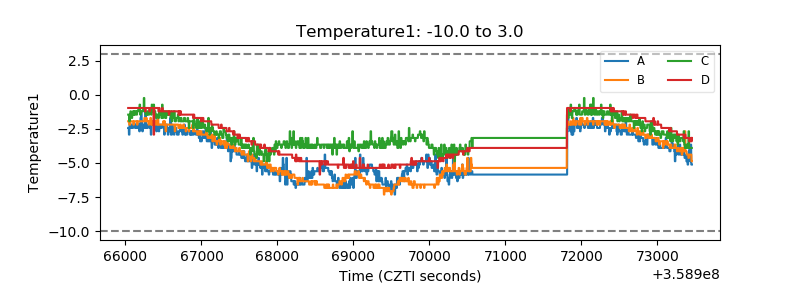 |
| Veto HV Monitor | 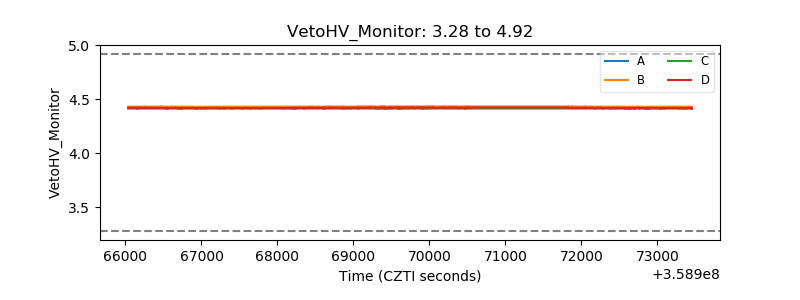 |
| Veto LLD | 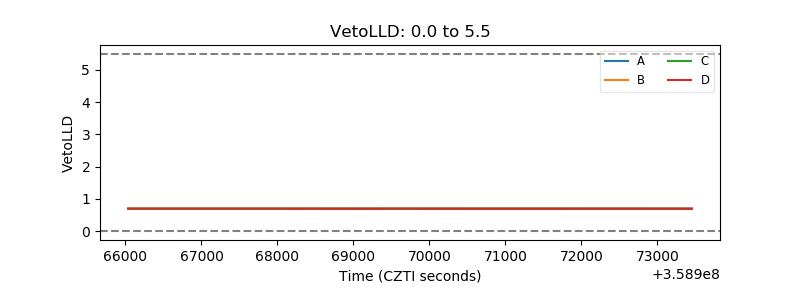 |
| Alpha Counter | 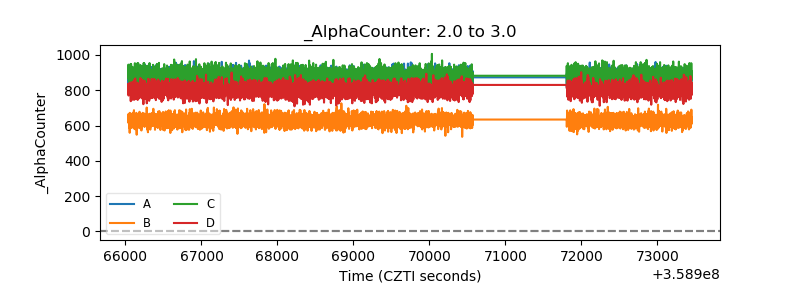 |
| _CPM_Rate | 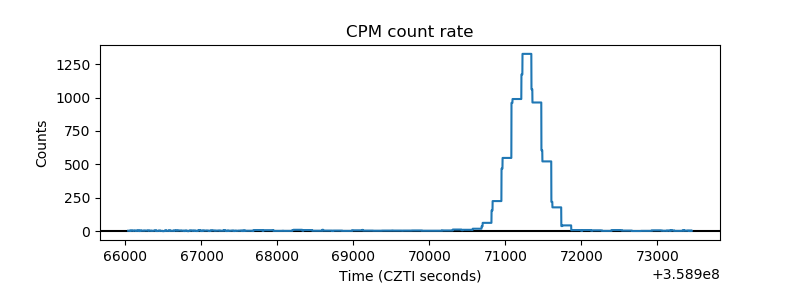 |
| CZT Counter | 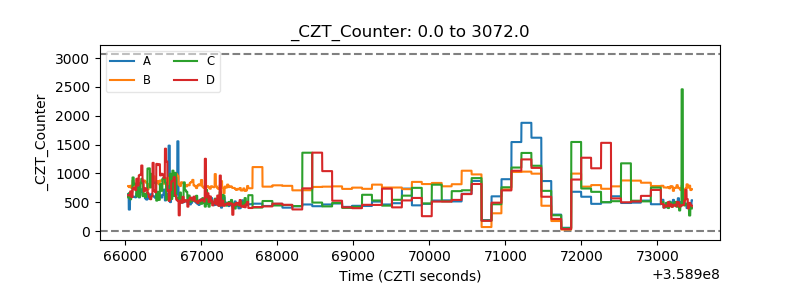 |
| +2.5 Volts monitor |  |
| +5 Volts monitor |  |
| _ROLL_ROT | 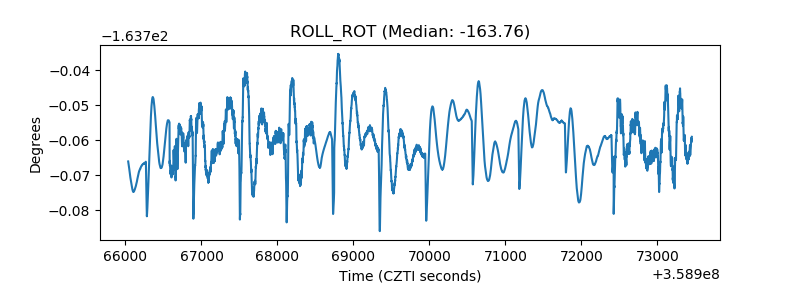 |
| _Roll_DEC | 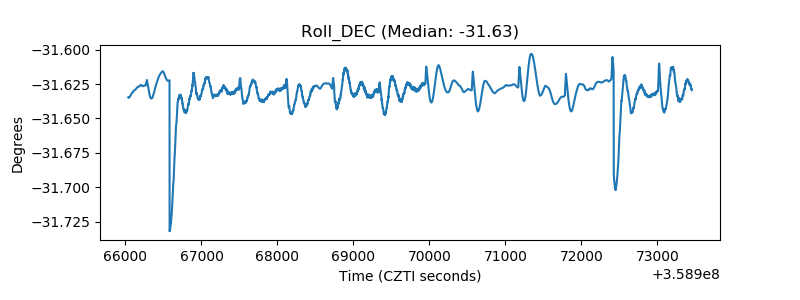 |
| _Roll_RA | 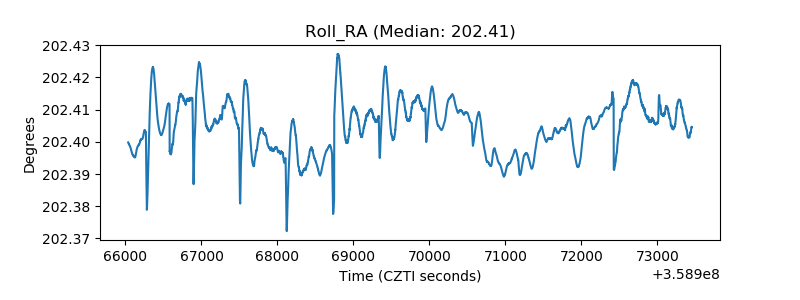 |
| Veto Counter | 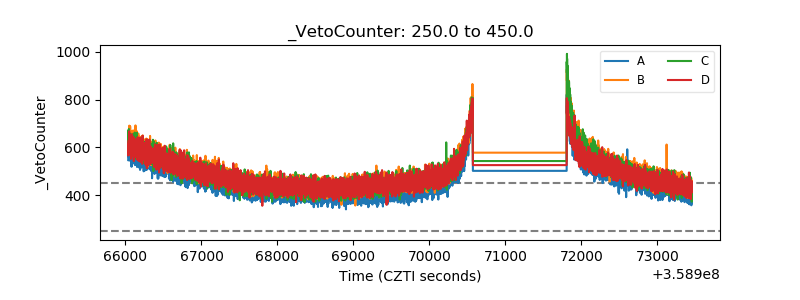 |