| Param | Original file | Final file |
|---|---|---|
| Filename | modeM0/AS1A10_058T03_9000004380_30472cztM0_level2.evt | modeM0/AS1A10_058T03_9000004380_30472cztM0_level2_quad_clean.evt |
| Size (bytes) | 591,698,880 | 99,325,440 |
| Size | 564.3 MB | 94.7 MB |
| Events in quadrant A | 3,350,878 | 666,711 |
| Events in quadrant B | 5,310,616 | 660,389 |
| Events in quadrant C | 4,397,432 | 606,834 |
| Events in quadrant D | 4,407,318 | 606,889 |
| Mode M9 | |||
|---|---|---|---|
| Quadrant | BADHDUFLAG | Total packets | Discarded packets |
| A | 0 | 13 | 0 |
| B | 0 | 14 | 0 |
| C | 0 | 14 | 0 |
| D | 0 | 14 | 0 |
| Mode M0 | |||
|---|---|---|---|
| Quadrant | BADHDUFLAG | Total packets | Discarded packets |
| A | 0 | 14208 | 2 |
| B | 0 | 20562 | 2 |
| C | 0 | 17288 | 2 |
| D | 0 | 17478 | 2 |
| Mode SS | |||
|---|---|---|---|
| Quadrant | BADHDUFLAG | Total packets | Discarded packets |
| A | 0 | 134 | 0 |
| B | 0 | 134 | 0 |
| C | 0 | 134 | 0 |
| D | 0 | 134 | 0 |
| Quadrant | Total seconds | Saturated seconds | Saturation percentage |
|---|---|---|---|
| A | 6707 | 81 | 1.207693% |
| B | 6707 | 142 | 2.117191% |
| C | 6707 | 382 | 5.695542% |
| D | 6706 | 156 | 2.326275% |
Noise dominated data is calculated using 1-second bins in cleaned event files. If a bin has >2000 counts, and if more than 50% of those come from <1% of pixels, then it is considered to be noise-dominated and hence unusable.
| Quadrant | # 1 sec bins | Bins with >0 counts | Bins with >2000 counts | High rate bins dominated by noise | Noise dominated (total time) | Noise dominated (detector-on time) | Marked lightcurve |
|---|---|---|---|---|---|---|---|
| A | 7722 | 6708 | 1 | 1 | 0.01% | 0.01% | 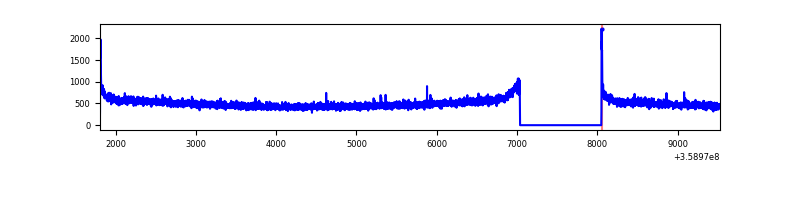 |
| B | 7722 | 6708 | 10 | 10 | 0.13% | 0.15% | 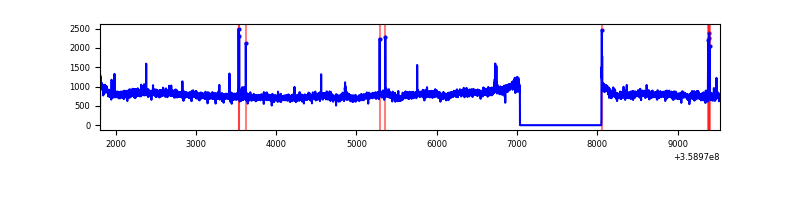 |
| C | 7722 | 6708 | 193 | 193 | 2.50% | 2.88% | 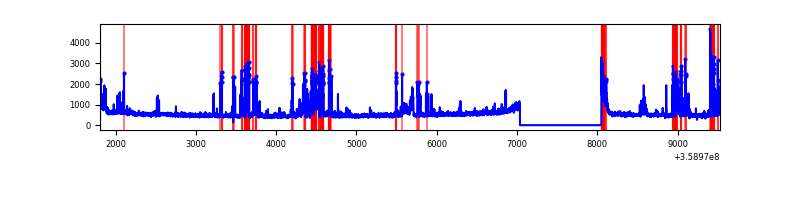 |
| D | 7721 | 6707 | 106 | 106 | 1.37% | 1.58% | 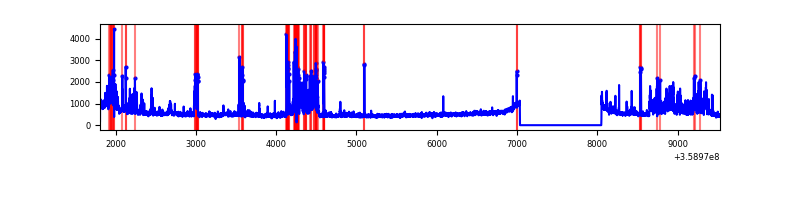 |
Top three noisy pixels from each quadrant. If the there are fewer than three noisy pixels in the level2.evt file, extra rows are filled as -1
| Pixel properties | Quadrant properties | ||||||
|---|---|---|---|---|---|---|---|
| Quadrant | DetID | PixID | Counts | Sigma | Mean | Median | Sigma |
| A | 8 | 192 | 23496 | 131.44 | 862 | 848 | 172.3 |
| A | 13 | 254 | 12502 | 67.64 | 862 | 848 | 172.3 |
| A | 3 | 137 | 8428 | 43.99 | 862 | 848 | 172.3 |
| B | 6 | 159 | 1894853 | 11638.4 | 845 | 826 | 162.7 |
| B | 4 | 171 | 36451 | 218.91 | 845 | 826 | 162.7 |
| B | 0 | 229 | 26313 | 156.61 | 845 | 826 | 162.7 |
| C | 15 | 208 | 836391 | 4512.67 | 795 | 801 | 185.2 |
| C | 14 | 238 | 146537 | 787.06 | 795 | 801 | 185.2 |
| C | 0 | 10 | 126786 | 680.39 | 795 | 801 | 185.2 |
| D | 8 | 195 | 517993 | 2687.78 | 814 | 793 | 192.4 |
| D | 13 | 104 | 470155 | 2439.17 | 814 | 793 | 192.4 |
| D | 7 | 238 | 241843 | 1252.68 | 814 | 793 | 192.4 |
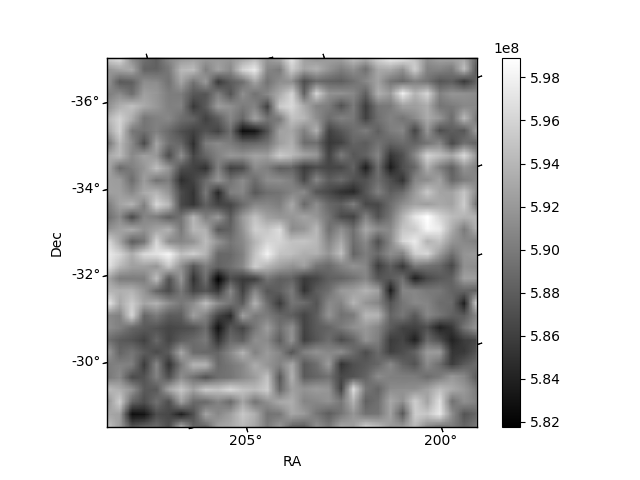
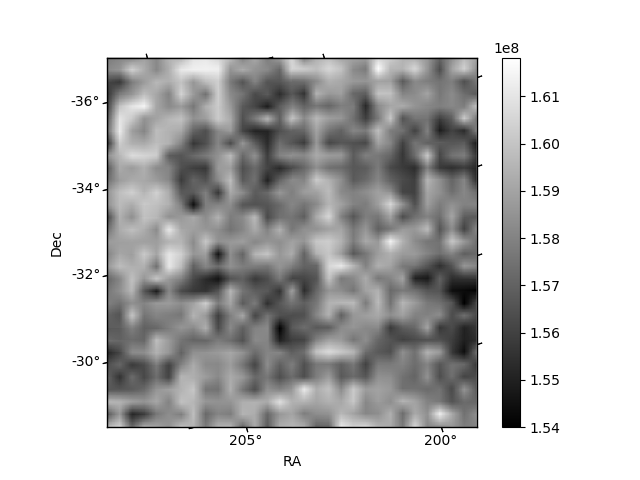
Histogram calculated using DETX and DETY for each event in the final _common_clean file
| Quadrant A | 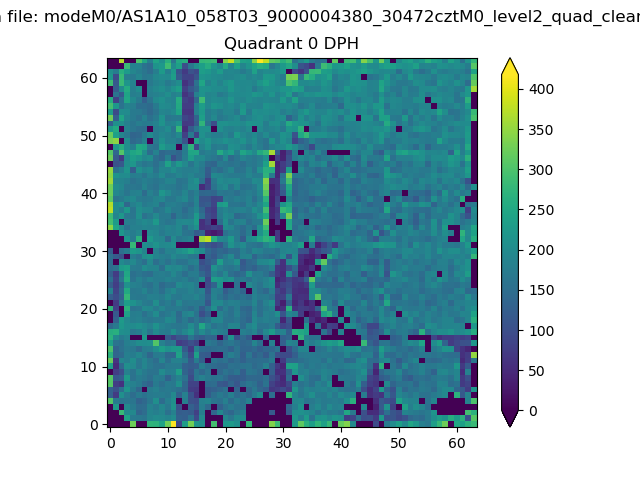 |
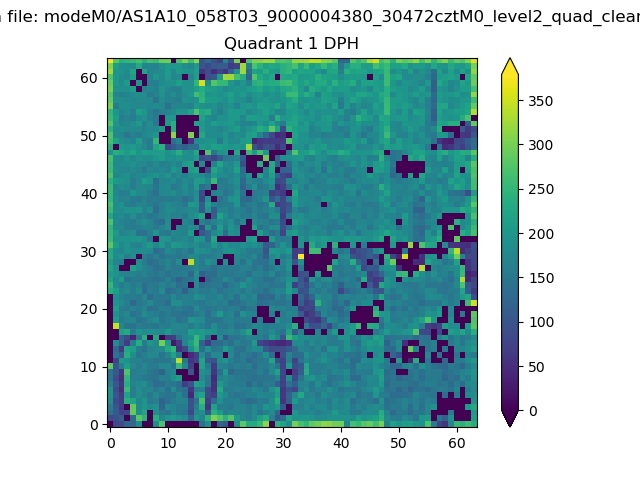 |
Quadrant B |
|---|---|---|---|
| Quadrant D | 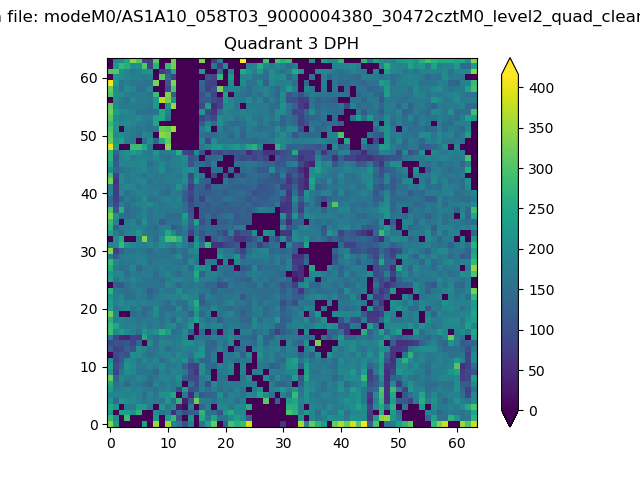 |
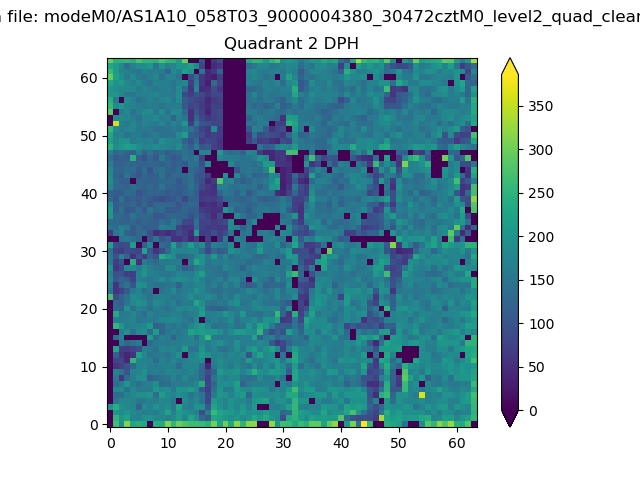 |
Quadrant C |
| Plot type | Count rate plots | Images |
|---|---|---|
| Comparison with Poisson distribution Blue bars denote a histogram of data divided into 1 sec bins. Red curve is a Poisson curve with rate = median count rate of data. |
 |
 |
| Quadrant-wise count rates Data is divided into 100 sec bins |
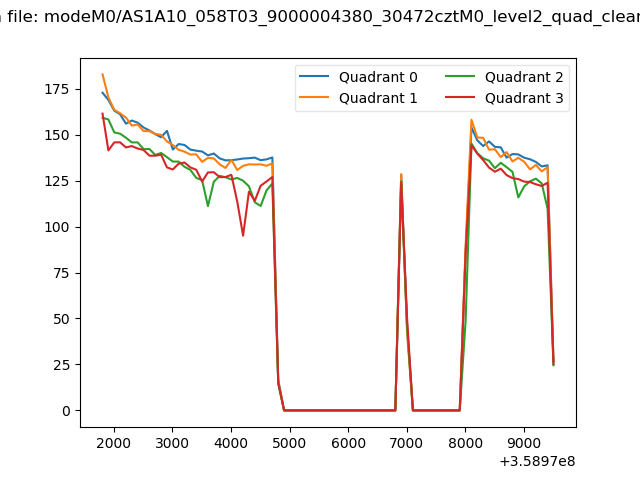 |
|
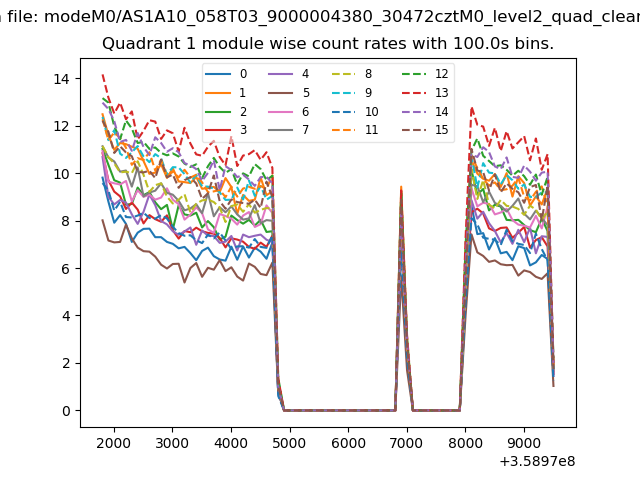
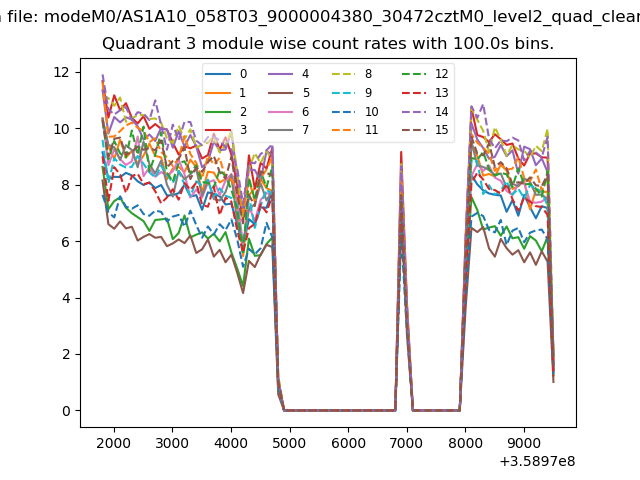
| Module-wise count rates for Quadrant A Data is divided into 100 sec bins |
 |
 |
| Module-wise count rates for Quadrant B Data is divided into 100 sec bins |
 |
 |
| Module-wise count rates for Quadrant C Data is divided into 100 sec bins |
 |
 |
| Module-wise count rates for Quadrant D Data is divided into 100 sec bins |
 |
 |
| Parameter | Plot |
|---|---|
| CZT HV Monitor |  |
| D_VDD | 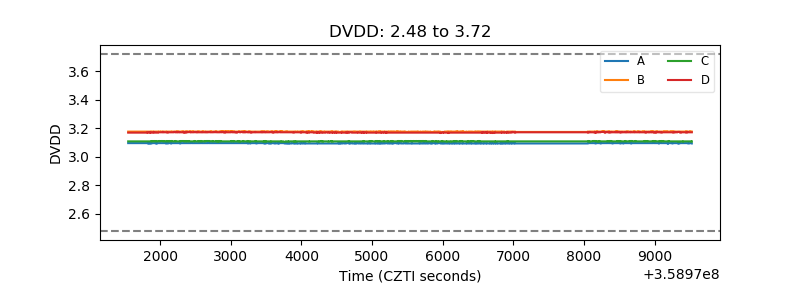 |
| Temperature 1 | 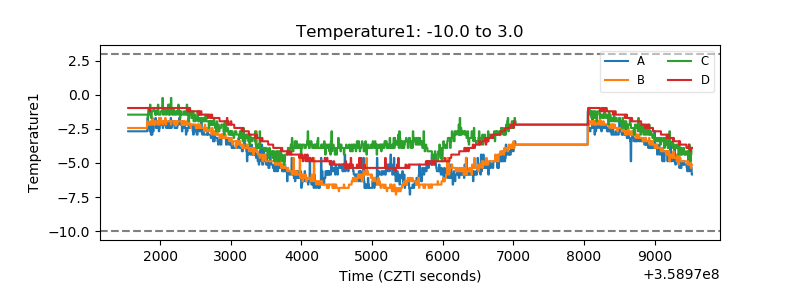 |
| Veto HV Monitor | 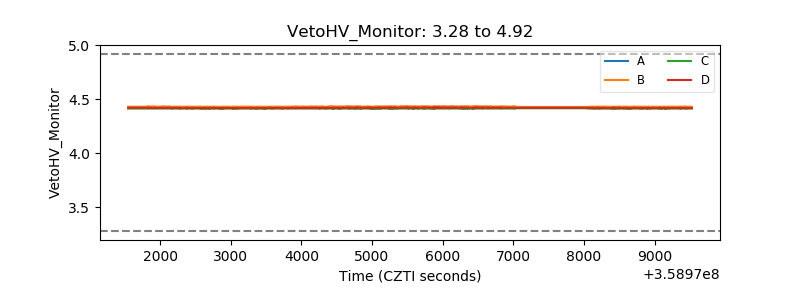 |
| Veto LLD | 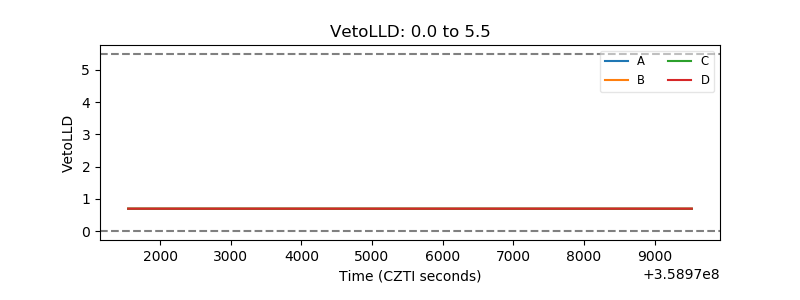 |
| Alpha Counter | 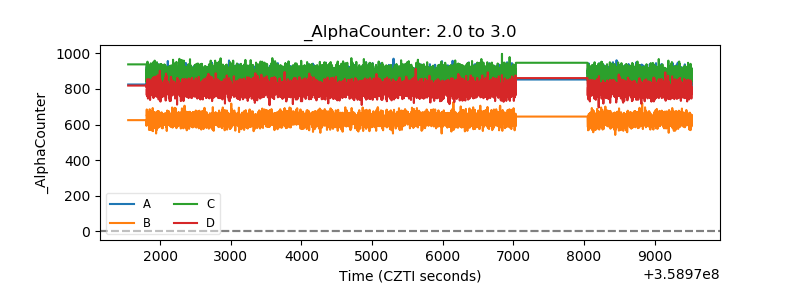 |
| _CPM_Rate | 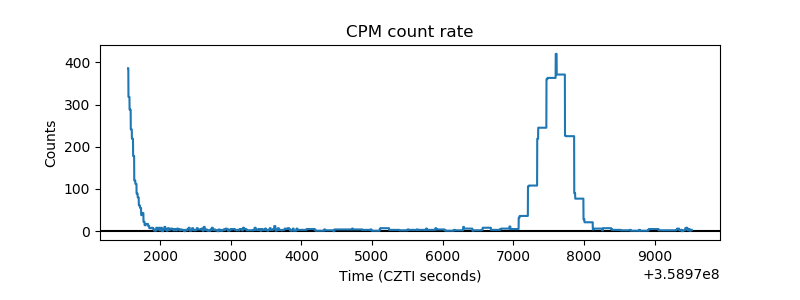 |
| CZT Counter | 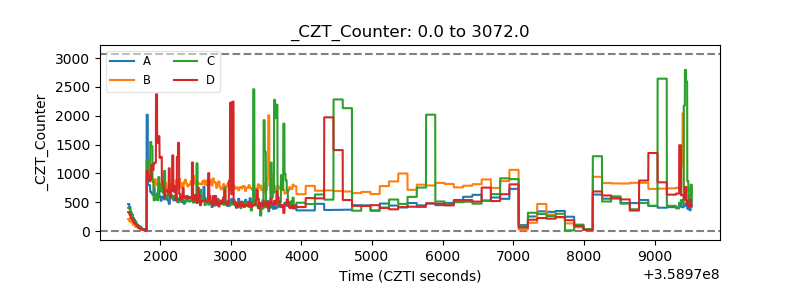 |
| +2.5 Volts monitor |  |
| +5 Volts monitor |  |
| _ROLL_ROT | 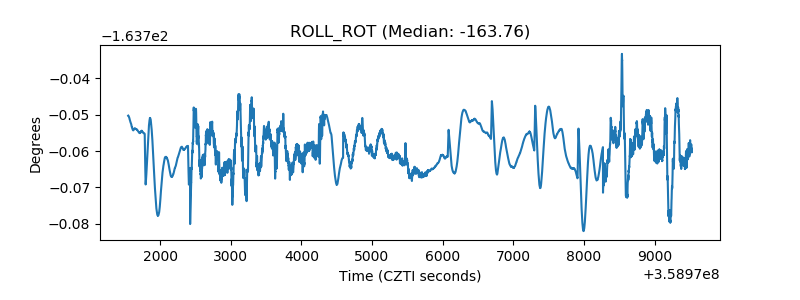 |
| _Roll_DEC | 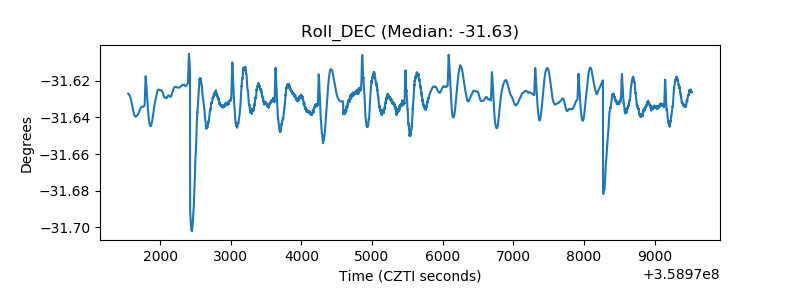 |
| _Roll_RA | 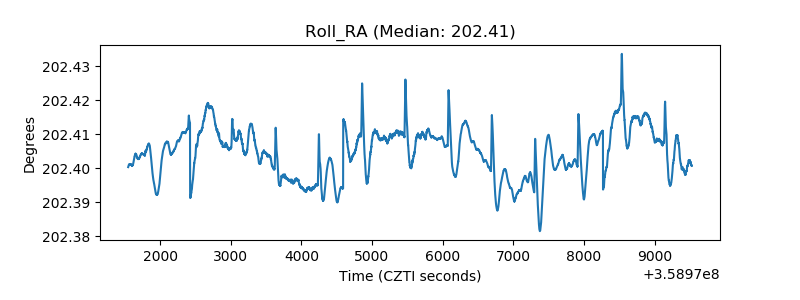 |
| Veto Counter |  |