| Param | Original file | Final file |
|---|---|---|
| Filename | modeM0/AS1A10_058T03_9000004380_30473cztM0_level2.evt | modeM0/AS1A10_058T03_9000004380_30473cztM0_level2_quad_clean.evt |
| Size (bytes) | 594,887,040 | 99,760,320 |
| Size | 567.3 MB | 95.1 MB |
| Events in quadrant A | 3,358,289 | 661,531 |
| Events in quadrant B | 5,423,222 | 655,678 |
| Events in quadrant C | 4,470,171 | 610,750 |
| Events in quadrant D | 4,296,427 | 611,316 |
| Mode M9 | |||
|---|---|---|---|
| Quadrant | BADHDUFLAG | Total packets | Discarded packets |
| A | 0 | 9 | 0 |
| B | 0 | 10 | 0 |
| C | 0 | 10 | 0 |
| D | 0 | 10 | 0 |
| Mode M0 | |||
|---|---|---|---|
| Quadrant | BADHDUFLAG | Total packets | Discarded packets |
| A | 0 | 14466 | 2 |
| B | 0 | 21125 | 2 |
| C | 0 | 17727 | 2 |
| D | 0 | 17325 | 2 |
| Mode SS | |||
|---|---|---|---|
| Quadrant | BADHDUFLAG | Total packets | Discarded packets |
| A | 0 | 138 | 0 |
| B | 0 | 138 | 0 |
| C | 0 | 138 | 0 |
| D | 0 | 138 | 0 |
| Quadrant | Total seconds | Saturated seconds | Saturation percentage |
|---|---|---|---|
| A | 6923 | 54 | 0.780009% |
| B | 6923 | 132 | 1.906688% |
| C | 6923 | 401 | 5.792287% |
| D | 6923 | 140 | 2.022245% |
Noise dominated data is calculated using 1-second bins in cleaned event files. If a bin has >2000 counts, and if more than 50% of those come from <1% of pixels, then it is considered to be noise-dominated and hence unusable.
| Quadrant | # 1 sec bins | Bins with >0 counts | Bins with >2000 counts | High rate bins dominated by noise | Noise dominated (total time) | Noise dominated (detector-on time) | Marked lightcurve |
|---|---|---|---|---|---|---|---|
| A | 7583 | 6924 | 2 | 2 | 0.03% | 0.03% | 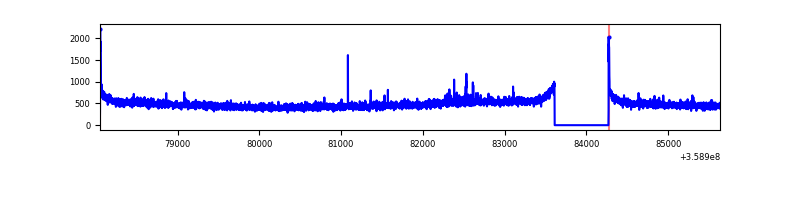 |
| B | 7583 | 6924 | 9 | 9 | 0.12% | 0.13% | 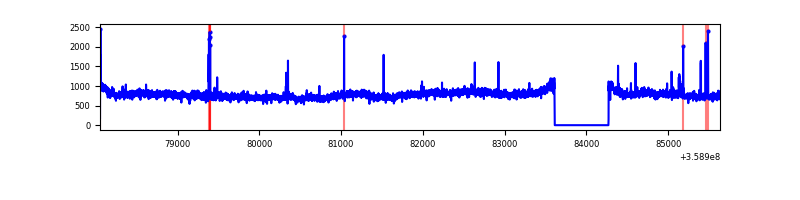 |
| C | 7583 | 6924 | 172 | 172 | 2.27% | 2.48% | 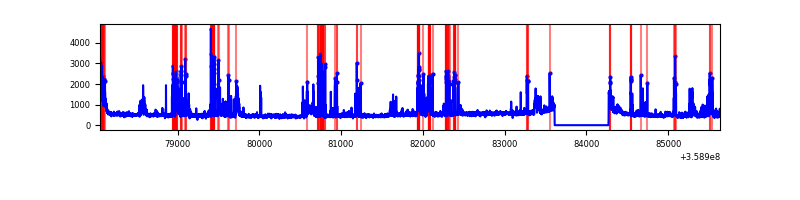 |
| D | 7583 | 6924 | 118 | 118 | 1.56% | 1.70% | 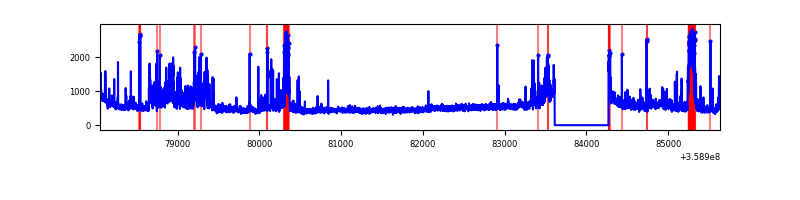 |
Top three noisy pixels from each quadrant. If the there are fewer than three noisy pixels in the level2.evt file, extra rows are filled as -1
| Pixel properties | Quadrant properties | ||||||
|---|---|---|---|---|---|---|---|
| Quadrant | DetID | PixID | Counts | Sigma | Mean | Median | Sigma |
| A | 8 | 192 | 24026 | 134.15 | 859 | 842 | 172.8 |
| A | 12 | 96 | 18884 | 104.39 | 859 | 842 | 172.8 |
| A | 13 | 254 | 12829 | 69.36 | 859 | 842 | 172.8 |
| B | 6 | 159 | 1977714 | 12024.72 | 846 | 828 | 164.4 |
| B | 0 | 229 | 39118 | 232.91 | 846 | 828 | 164.4 |
| B | 4 | 171 | 32472 | 192.48 | 846 | 828 | 164.4 |
| C | 15 | 208 | 854419 | 4586.09 | 795 | 799 | 186.1 |
| C | 3 | 233 | 140350 | 749.74 | 795 | 799 | 186.1 |
| C | 14 | 238 | 134910 | 720.51 | 795 | 799 | 186.1 |
| D | 8 | 195 | 538139 | 2783.84 | 816 | 796 | 193.0 |
| D | 13 | 104 | 483450 | 2500.51 | 816 | 796 | 193.0 |
| D | 2 | 250 | 49784 | 253.79 | 816 | 796 | 193.0 |
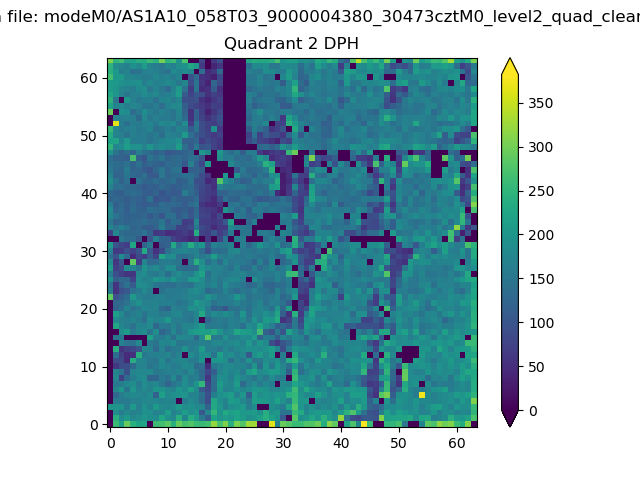
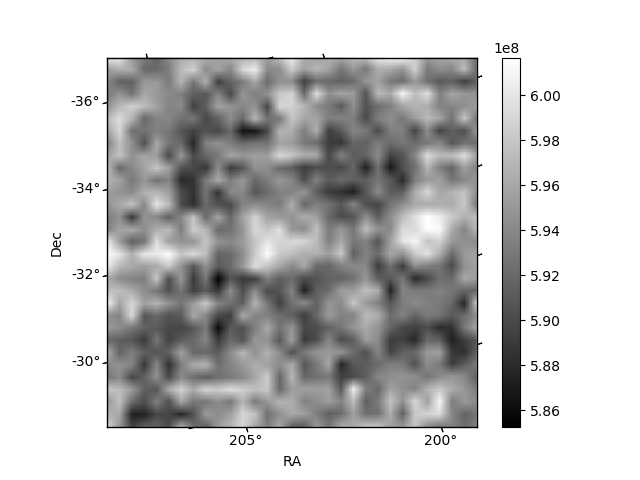
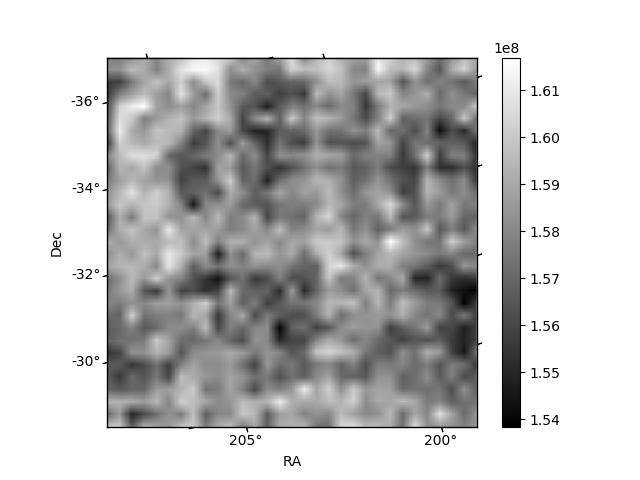
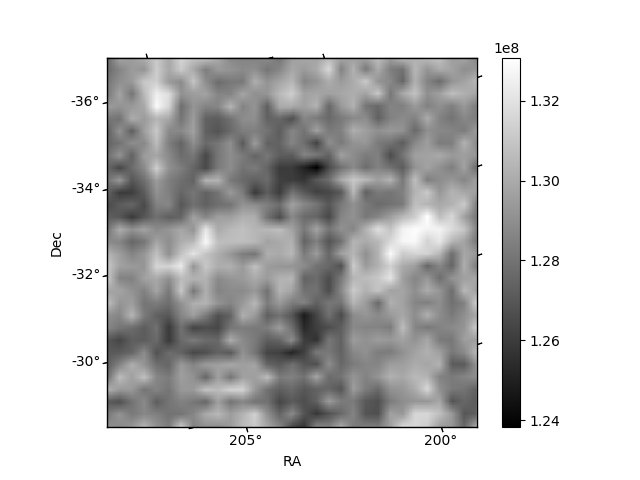
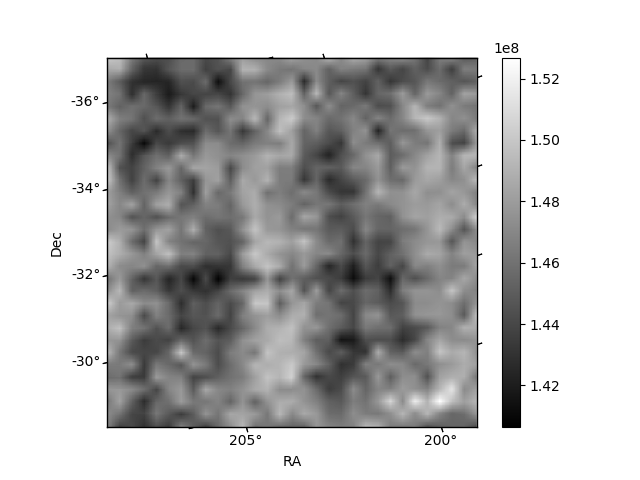
Histogram calculated using DETX and DETY for each event in the final _common_clean file
| Quadrant A | 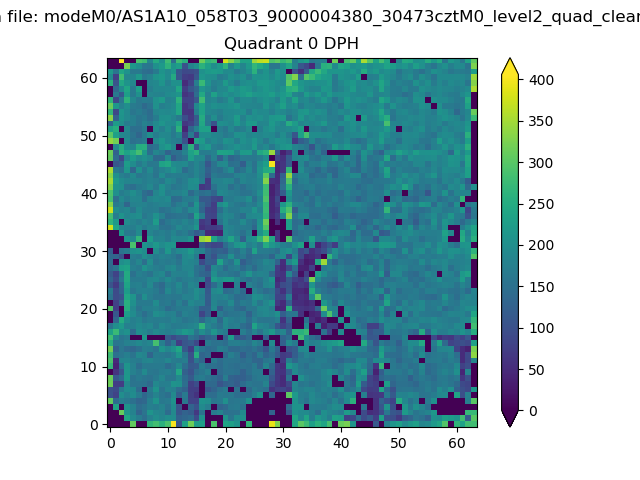 |
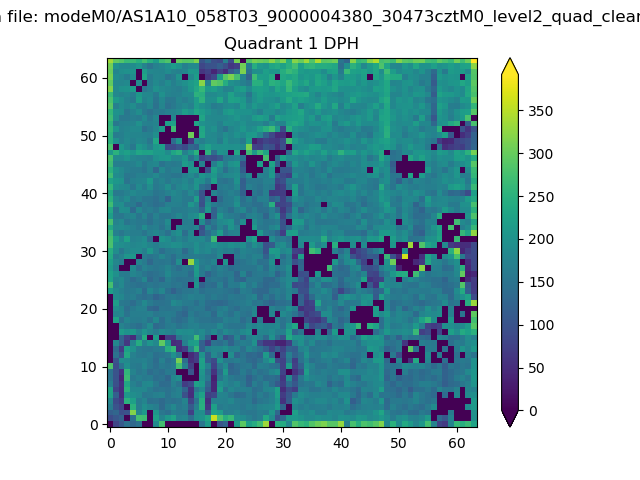 |
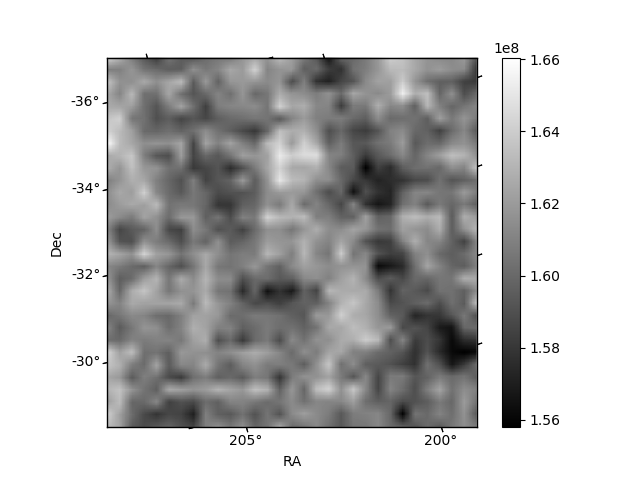
Quadrant B |
|---|---|---|---|
| Quadrant D | 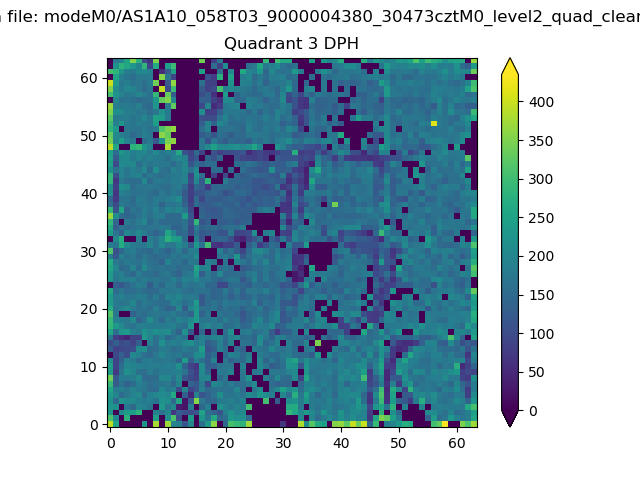 |
 |
Quadrant C |
| Plot type | Count rate plots | Images |
|---|---|---|
| Comparison with Poisson distribution Blue bars denote a histogram of data divided into 1 sec bins. Red curve is a Poisson curve with rate = median count rate of data. |
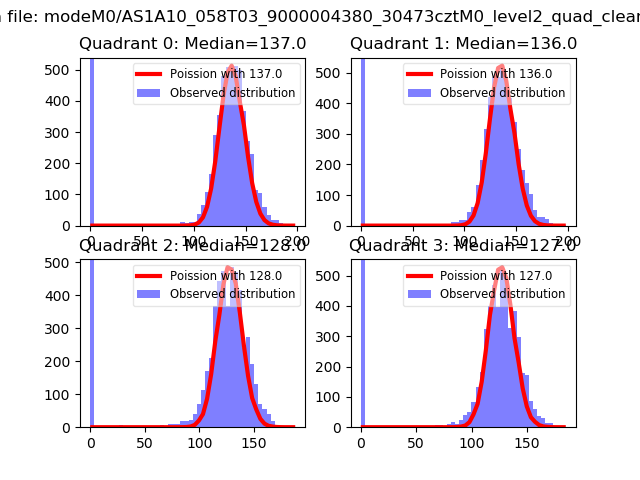 |
 |
| Quadrant-wise count rates Data is divided into 100 sec bins |
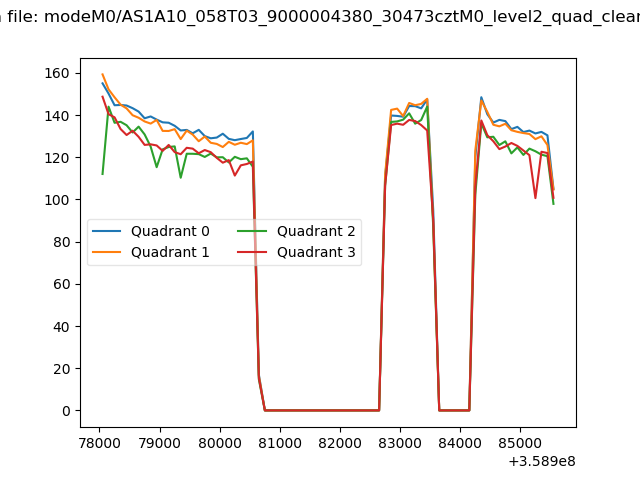 |
|
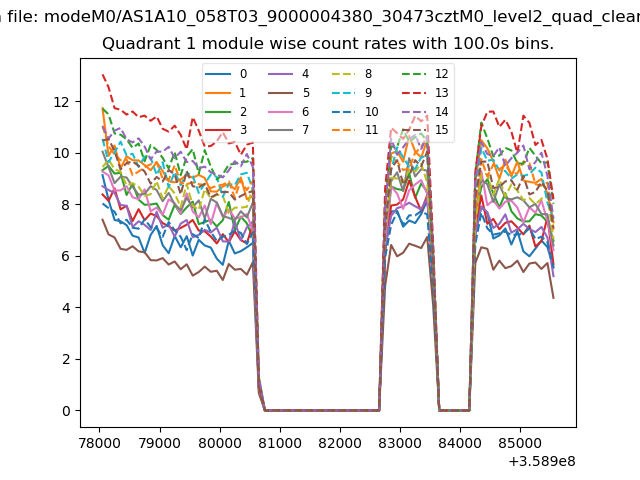
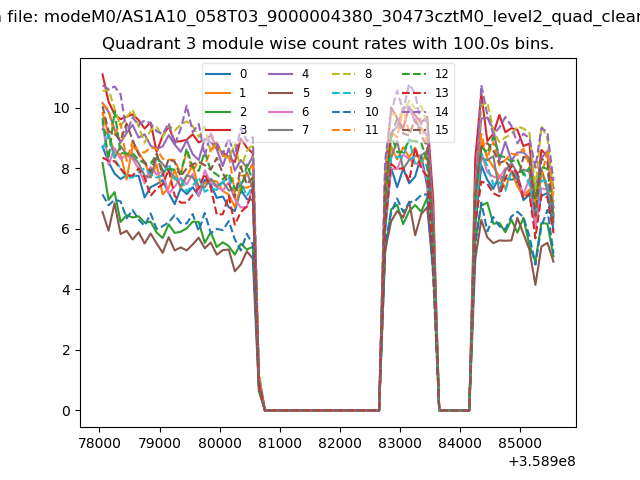
| Module-wise count rates for Quadrant A Data is divided into 100 sec bins |
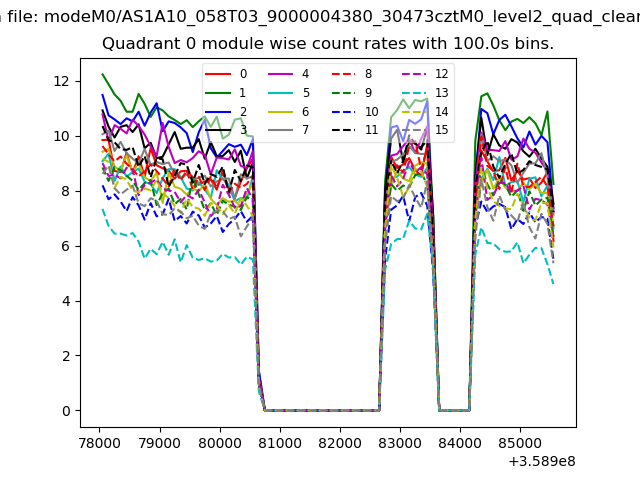 |
 |
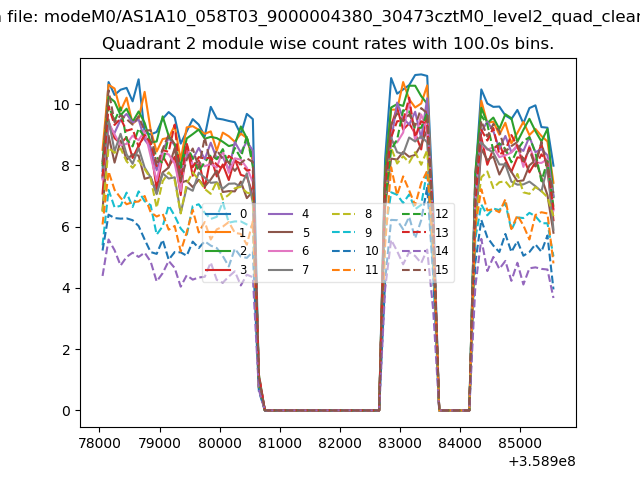
| Module-wise count rates for Quadrant B Data is divided into 100 sec bins |
 |
 |
| Module-wise count rates for Quadrant C Data is divided into 100 sec bins |
 |
 |
| Module-wise count rates for Quadrant D Data is divided into 100 sec bins |
 |
 |
| Parameter | Plot |
|---|---|
| CZT HV Monitor | 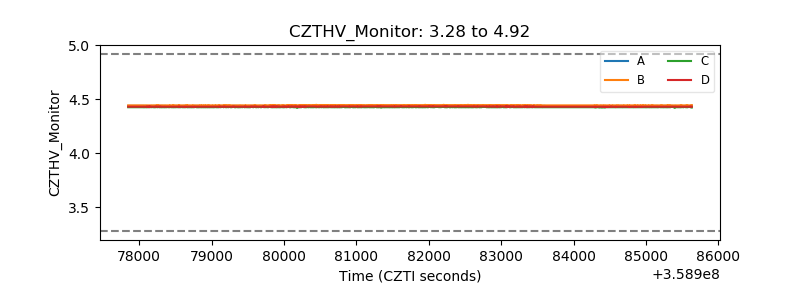 |
| D_VDD | 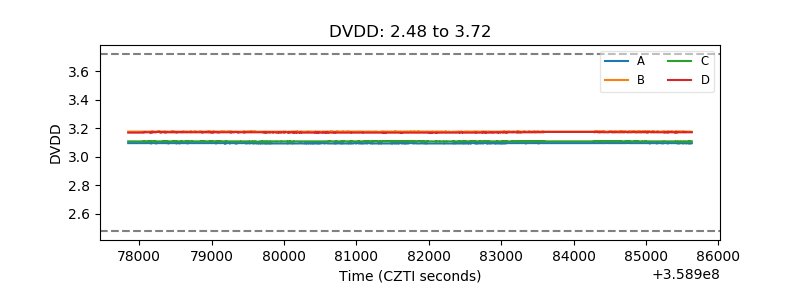 |
| Temperature 1 | 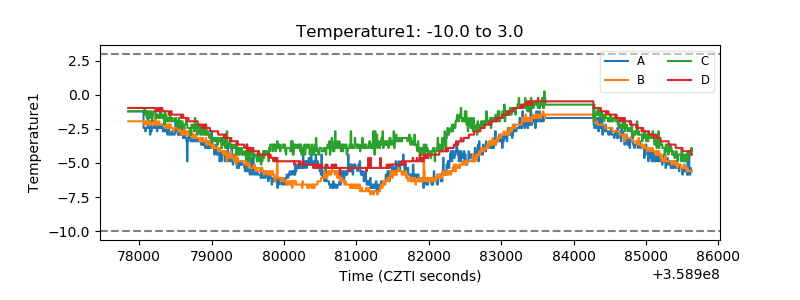 |
| Veto HV Monitor | 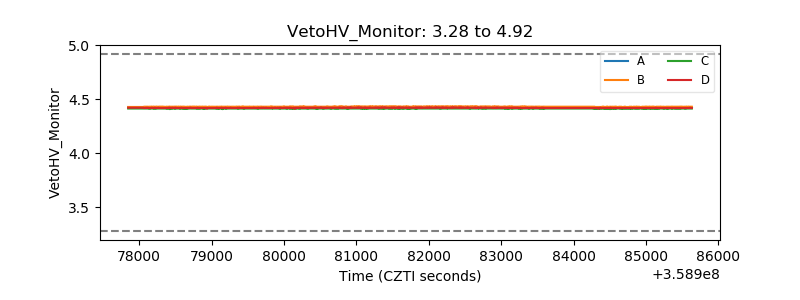 |
| Veto LLD | 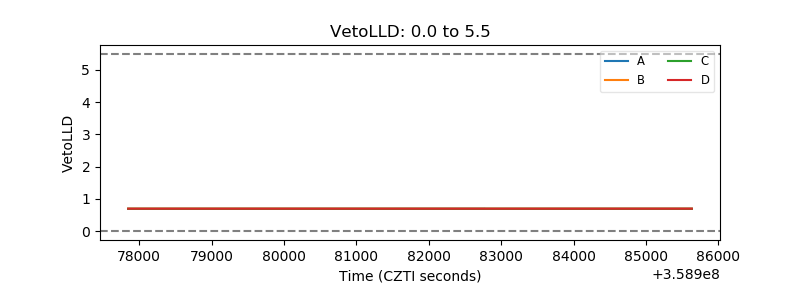 |
| Alpha Counter |  |
| _CPM_Rate |  |
| CZT Counter | 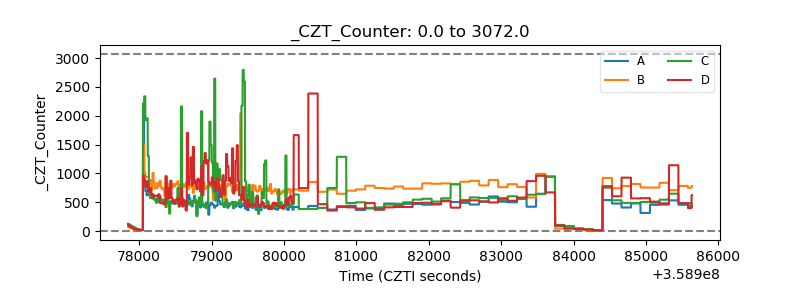 |
| +2.5 Volts monitor |  |
| +5 Volts monitor |  |
| _ROLL_ROT |  |
| _Roll_DEC | 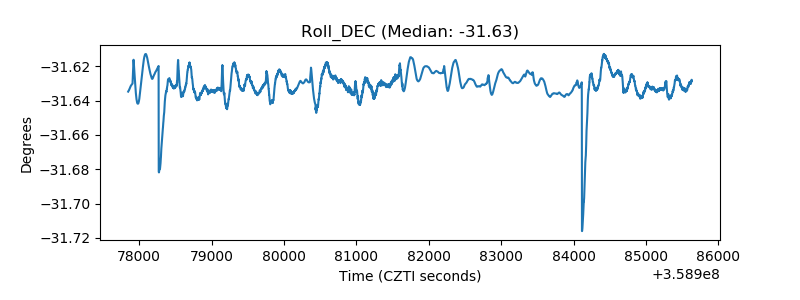 |
| _Roll_RA | 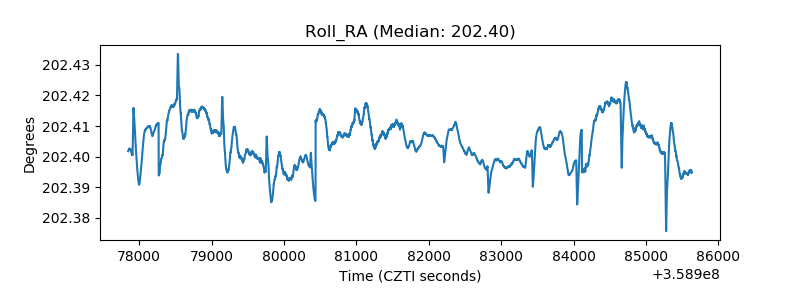 |
| Veto Counter | 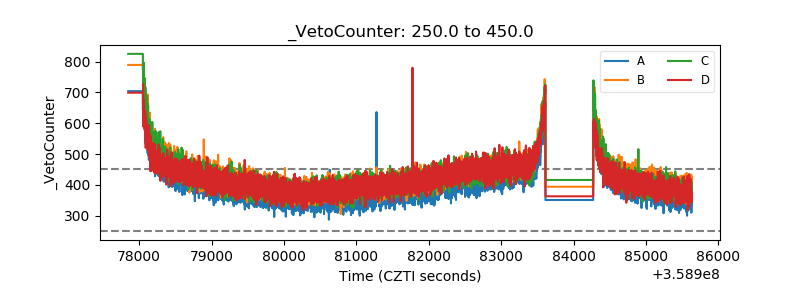 |