| Param | Original file | Final file |
|---|---|---|
| Filename | modeM0/AS1A10_058T03_9000004380_30474cztM0_level2.evt | modeM0/AS1A10_058T03_9000004380_30474cztM0_level2_quad_clean.evt |
| Size (bytes) | 648,642,240 | 108,475,200 |
| Size | 618.6 MB | 103.5 MB |
| Events in quadrant A | 3,549,566 | 721,557 |
| Events in quadrant B | 5,822,553 | 714,791 |
| Events in quadrant C | 4,147,474 | 677,101 |
| Events in quadrant D | 5,618,111 | 650,679 |
| Mode M9 | |||
|---|---|---|---|
| Quadrant | BADHDUFLAG | Total packets | Discarded packets |
| A | 0 | 4 | 0 |
| B | 0 | 4 | 0 |
| C | 0 | 4 | 0 |
| D | 0 | 4 | 0 |
| Mode M0 | |||
|---|---|---|---|
| Quadrant | BADHDUFLAG | Total packets | Discarded packets |
| A | 0 | 15465 | 2 |
| B | 0 | 22828 | 2 |
| C | 0 | 17326 | 2 |
| D | 0 | 21782 | 3 |
| Mode SS | |||
|---|---|---|---|
| Quadrant | BADHDUFLAG | Total packets | Discarded packets |
| A | 0 | 152 | 0 |
| B | 0 | 152 | 0 |
| C | 0 | 152 | 0 |
| D | 0 | 152 | 0 |
| Quadrant | Total seconds | Saturated seconds | Saturation percentage |
|---|---|---|---|
| A | 7490 | 58 | 0.774366% |
| B | 7491 | 172 | 2.296089% |
| C | 7491 | 164 | 2.189294% |
| D | 7490 | 487 | 6.502003% |
Noise dominated data is calculated using 1-second bins in cleaned event files. If a bin has >2000 counts, and if more than 50% of those come from <1% of pixels, then it is considered to be noise-dominated and hence unusable.
| Quadrant | # 1 sec bins | Bins with >0 counts | Bins with >2000 counts | High rate bins dominated by noise | Noise dominated (total time) | Noise dominated (detector-on time) | Marked lightcurve |
|---|---|---|---|---|---|---|---|
| A | 7800 | 7492 | 2 | 2 | 0.03% | 0.03% | 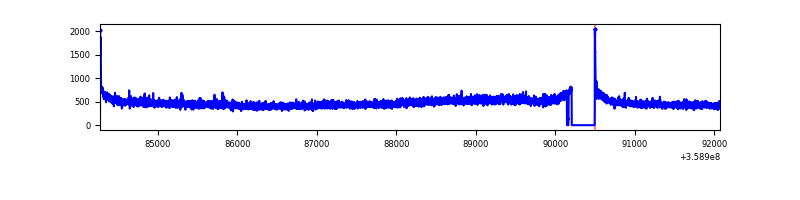 |
| B | 7801 | 7493 | 8 | 8 | 0.10% | 0.11% | 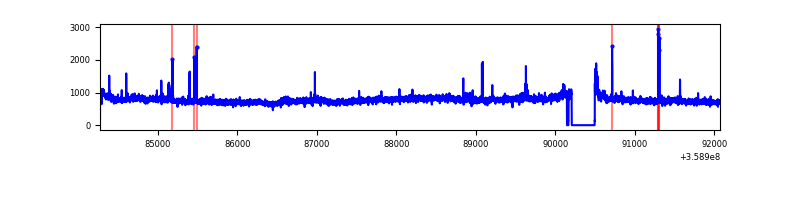 |
| C | 7801 | 7493 | 18 | 18 | 0.23% | 0.24% | 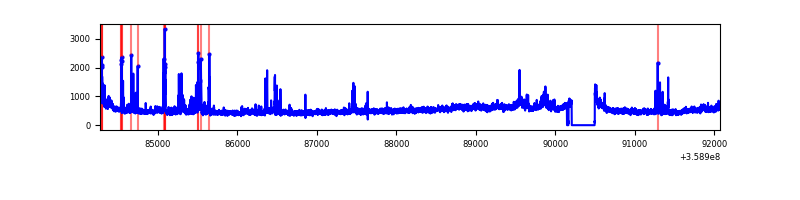 |
| D | 7800 | 7492 | 444 | 444 | 5.69% | 5.93% | 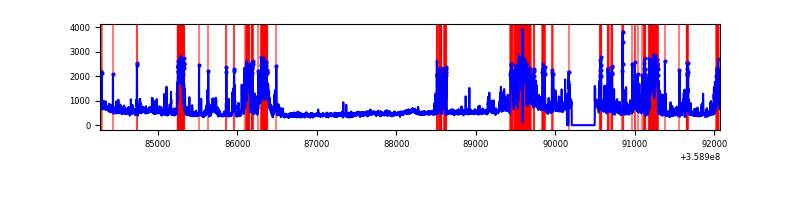 |
Top three noisy pixels from each quadrant. If the there are fewer than three noisy pixels in the level2.evt file, extra rows are filled as -1
| Pixel properties | Quadrant properties | ||||||
|---|---|---|---|---|---|---|---|
| Quadrant | DetID | PixID | Counts | Sigma | Mean | Median | Sigma |
| A | 8 | 192 | 23603 | 123.8 | 912 | 894 | 183.4 |
| A | 13 | 254 | 14800 | 75.81 | 912 | 894 | 183.4 |
| A | 3 | 137 | 9254 | 45.58 | 912 | 894 | 183.4 |
| B | 6 | 159 | 2148053 | 12429.61 | 899 | 877 | 172.7 |
| B | 4 | 171 | 29917 | 168.11 | 899 | 877 | 172.7 |
| B | 0 | 229 | 26901 | 150.65 | 899 | 877 | 172.7 |
| C | 3 | 233 | 348766 | 1727.55 | 859 | 865 | 201.4 |
| C | 15 | 208 | 196915 | 973.51 | 859 | 865 | 201.4 |
| C | 14 | 238 | 142868 | 705.14 | 859 | 865 | 201.4 |
| D | 13 | 104 | 1673775 | 8236.68 | 853 | 831 | 203.1 |
| D | 8 | 195 | 208975 | 1024.79 | 853 | 831 | 203.1 |
| D | 13 | 249 | 126465 | 618.55 | 853 | 831 | 203.1 |
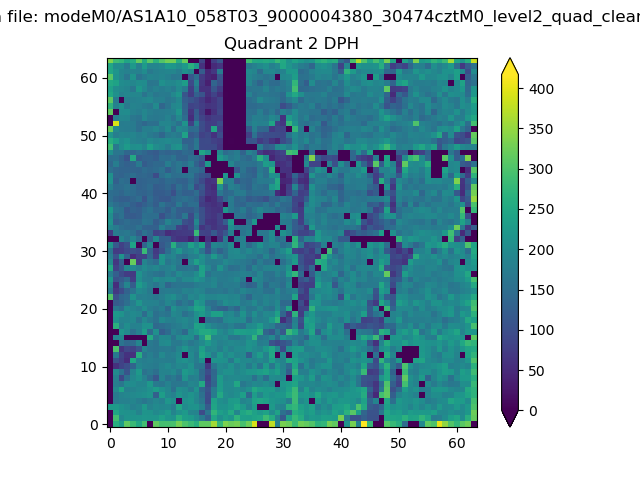
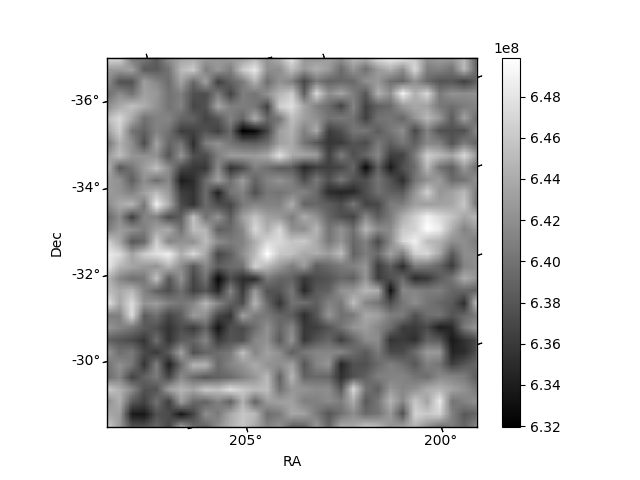
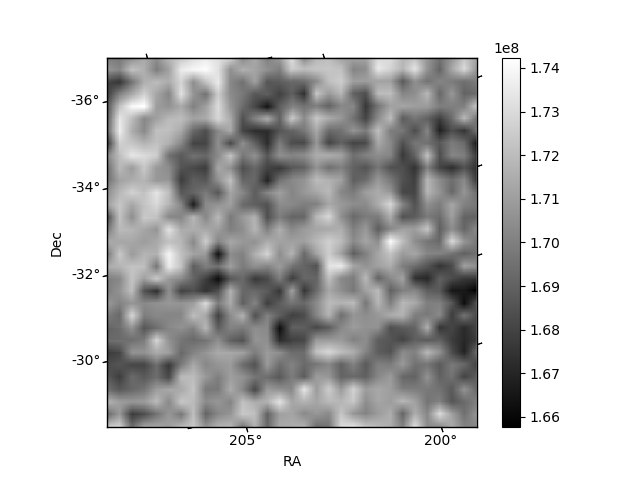
Histogram calculated using DETX and DETY for each event in the final _common_clean file
| Quadrant A | 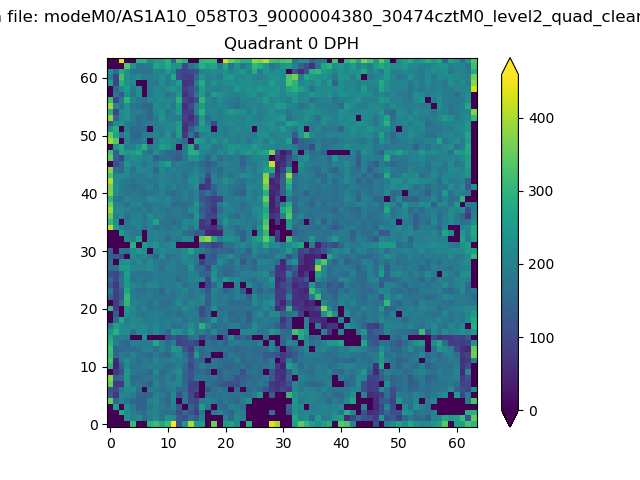 |
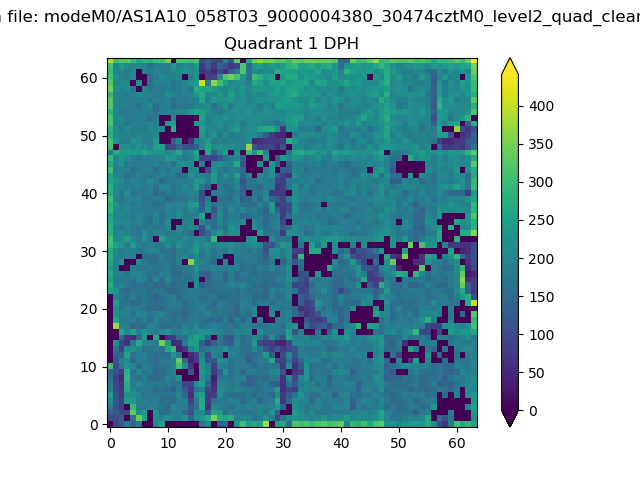 |
Quadrant B |
|---|---|---|---|
| Quadrant D | 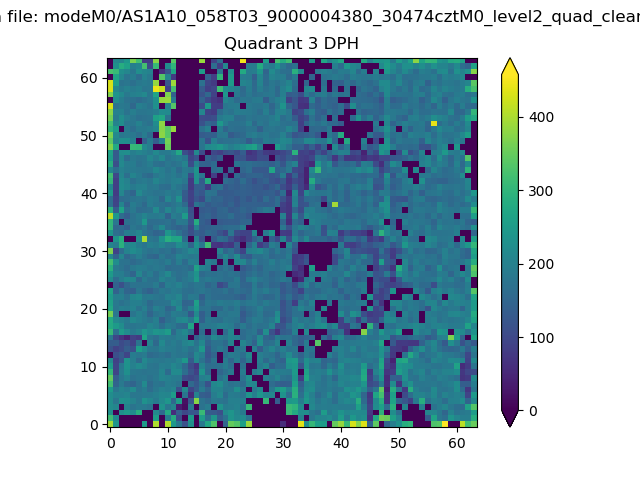 |
 |
Quadrant C |
| Plot type | Count rate plots | Images |
|---|---|---|
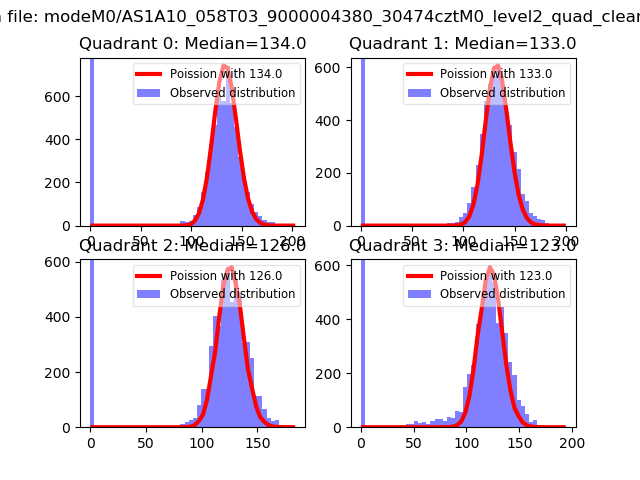
| Comparison with Poisson distribution Blue bars denote a histogram of data divided into 1 sec bins. Red curve is a Poisson curve with rate = median count rate of data. |
 |
 |
| Quadrant-wise count rates Data is divided into 100 sec bins |
 |
|
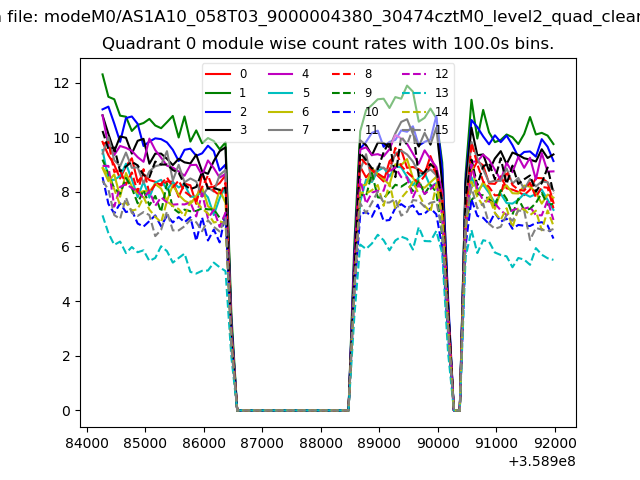
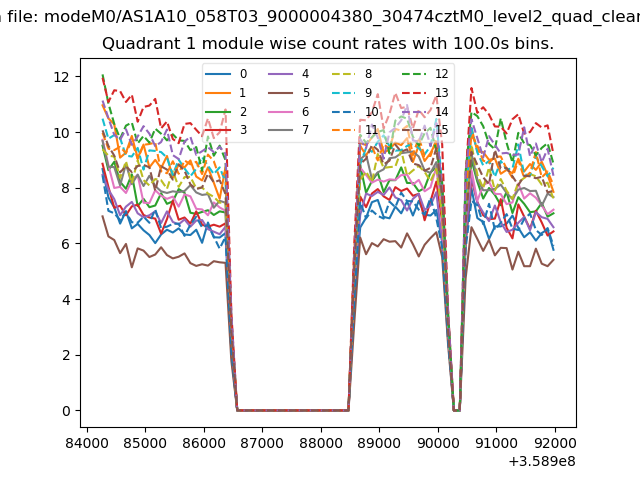
| Module-wise count rates for Quadrant A Data is divided into 100 sec bins |
 |
 |
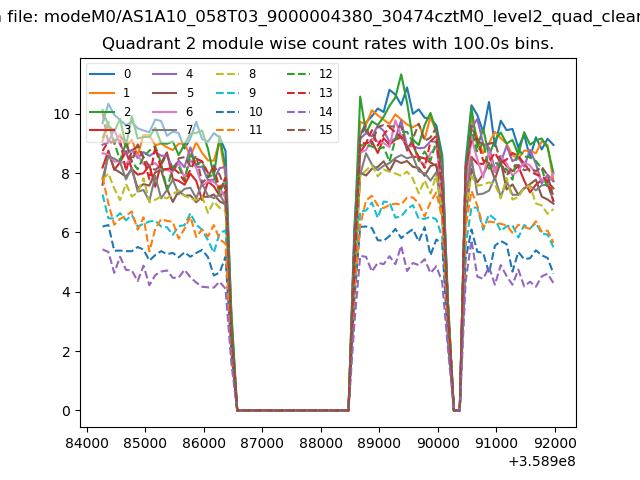
| Module-wise count rates for Quadrant B Data is divided into 100 sec bins |
 |
 |
| Module-wise count rates for Quadrant C Data is divided into 100 sec bins |
 |
 |
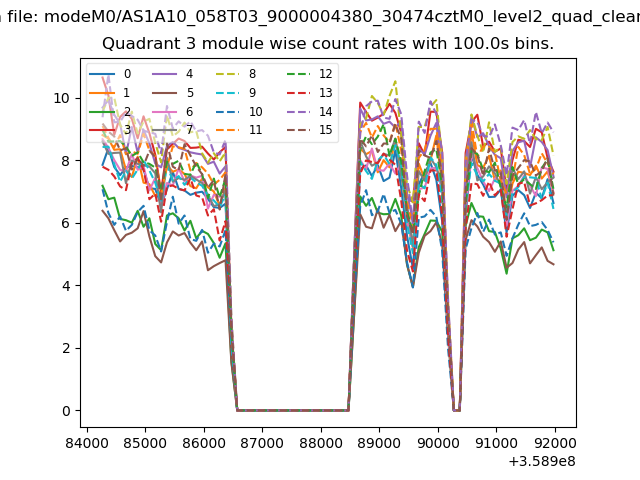
| Module-wise count rates for Quadrant D Data is divided into 100 sec bins |
 |
 |
| Parameter | Plot |
|---|---|
| CZT HV Monitor | 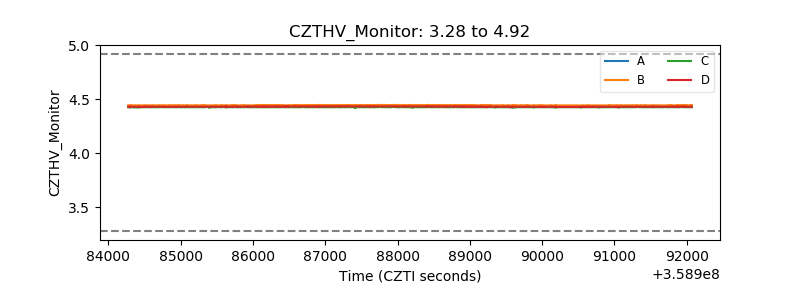 |
| D_VDD | 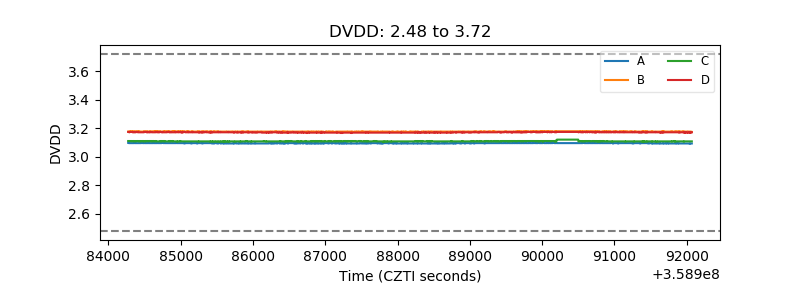 |
| Temperature 1 | 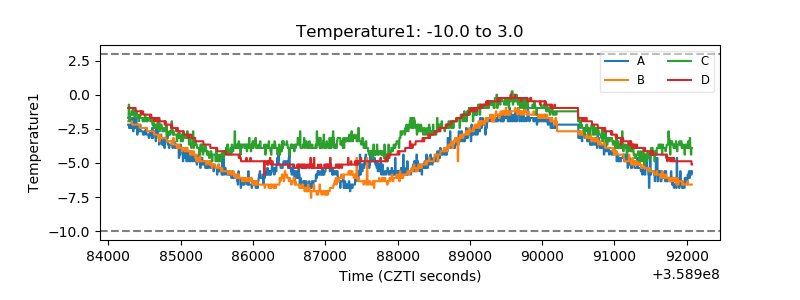 |
| Veto HV Monitor | 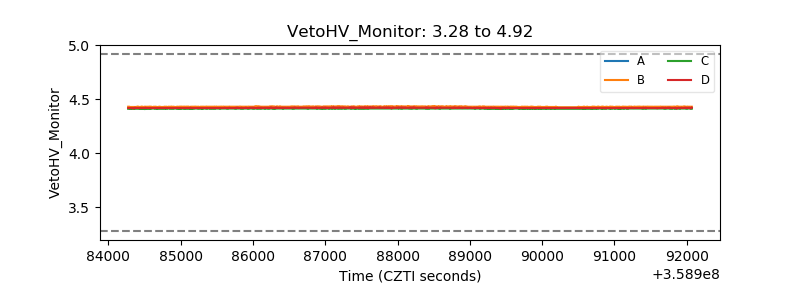 |
| Veto LLD | 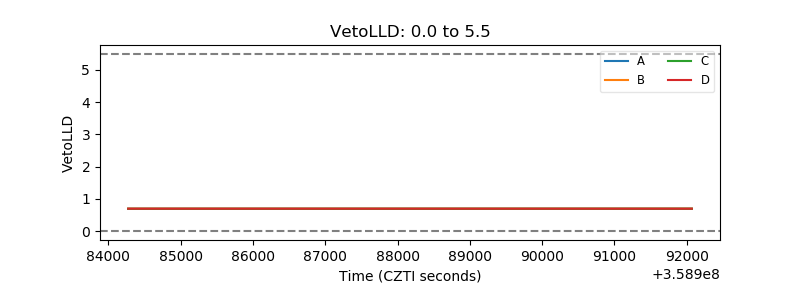 |
| Alpha Counter |  |
| _CPM_Rate |  |
| CZT Counter | 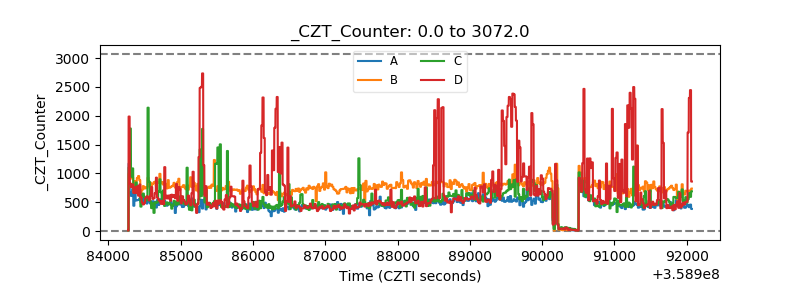 |
| +2.5 Volts monitor |  |
| +5 Volts monitor |  |
| _ROLL_ROT | 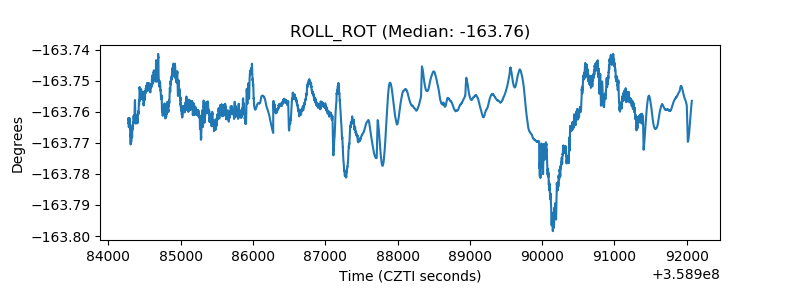 |
| _Roll_DEC | 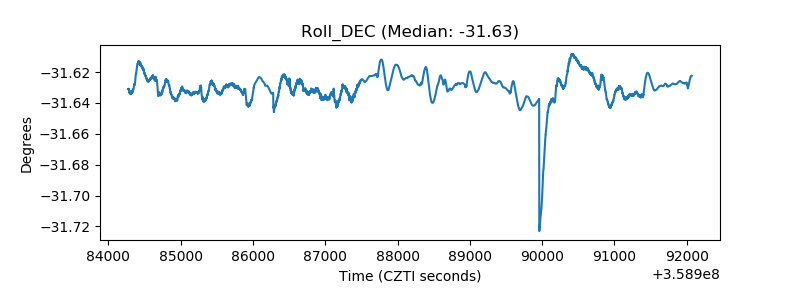 |
| _Roll_RA | 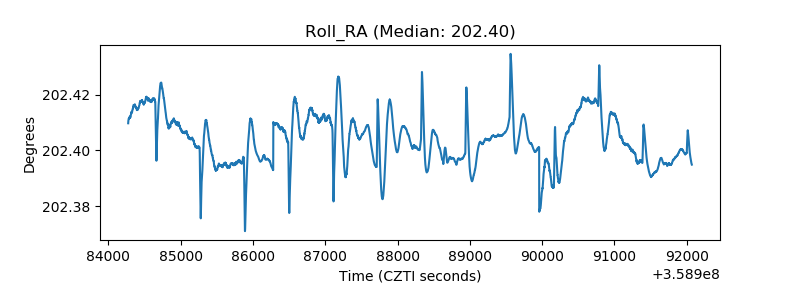 |
| Veto Counter | 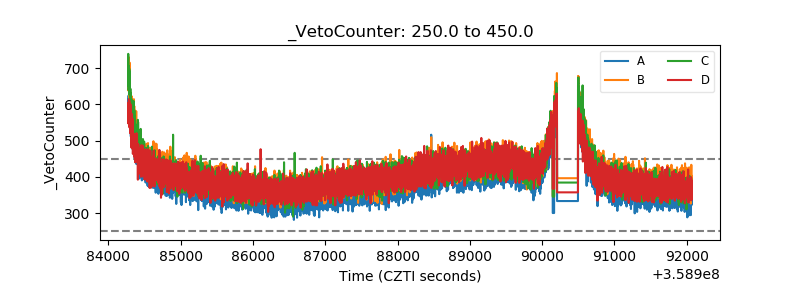 |