| Param | Original file | Final file |
|---|---|---|
| Filename | modeM0/AS1A10_058T03_9000004380_30475cztM0_level2.evt | modeM0/AS1A10_058T03_9000004380_30475cztM0_level2_quad_clean.evt |
| Size (bytes) | 712,100,160 | 105,649,920 |
| Size | 679.1 MB | 100.8 MB |
| Events in quadrant A | 3,605,648 | 699,029 |
| Events in quadrant B | 5,924,664 | 693,859 |
| Events in quadrant C | 4,812,436 | 658,513 |
| Events in quadrant D | 6,707,851 | 616,961 |
| Mode M9 | |||
|---|---|---|---|
| Quadrant | BADHDUFLAG | Total packets | Discarded packets |
| A | 0 | 3 | 0 |
| B | 0 | 3 | 0 |
| C | 0 | 3 | 0 |
| D | 0 | 3 | 0 |
| Mode M0 | |||
|---|---|---|---|
| Quadrant | BADHDUFLAG | Total packets | Discarded packets |
| A | 0 | 15782 | 2 |
| B | 0 | 23377 | 2 |
| C | 0 | 19654 | 2 |
| D | 0 | 25377 | 2 |
| Mode SS | |||
|---|---|---|---|
| Quadrant | BADHDUFLAG | Total packets | Discarded packets |
| A | 0 | 154 | 0 |
| B | 0 | 154 | 0 |
| C | 0 | 154 | 0 |
| D | 0 | 154 | 0 |
| Quadrant | Total seconds | Saturated seconds | Saturation percentage |
|---|---|---|---|
| A | 7633 | 32 | 0.419232% |
| B | 7634 | 163 | 2.135185% |
| C | 7634 | 177 | 2.318575% |
| D | 7634 | 699 | 9.156406% |
Noise dominated data is calculated using 1-second bins in cleaned event files. If a bin has >2000 counts, and if more than 50% of those come from <1% of pixels, then it is considered to be noise-dominated and hence unusable.
| Quadrant | # 1 sec bins | Bins with >0 counts | Bins with >2000 counts | High rate bins dominated by noise | Noise dominated (total time) | Noise dominated (detector-on time) | Marked lightcurve |
|---|---|---|---|---|---|---|---|
| A | 7918 | 7634 | 1 | 1 | 0.01% | 0.01% | 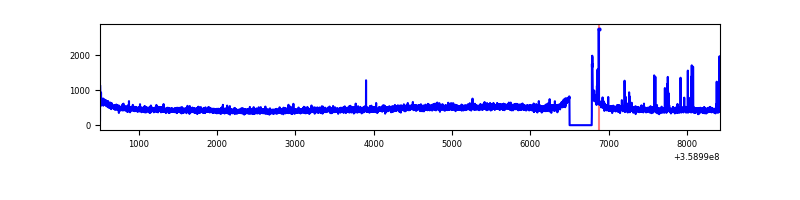 |
| B | 7919 | 7635 | 16 | 16 | 0.20% | 0.21% | 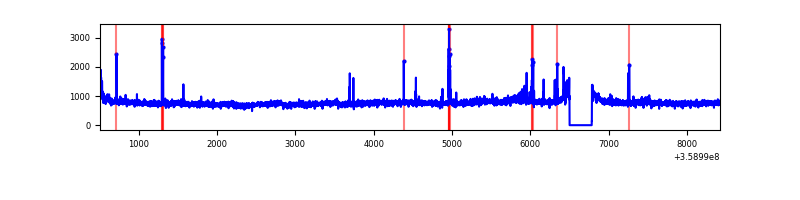 |
| C | 7919 | 7635 | 3 | 3 | 0.04% | 0.04% | 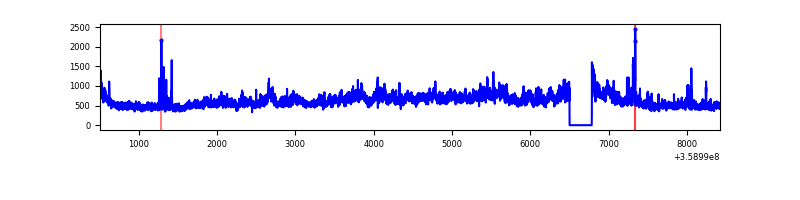 |
| D | 7919 | 7635 | 660 | 660 | 8.33% | 8.64% |  |
Top three noisy pixels from each quadrant. If the there are fewer than three noisy pixels in the level2.evt file, extra rows are filled as -1
| Pixel properties | Quadrant properties | ||||||
|---|---|---|---|---|---|---|---|
| Quadrant | DetID | PixID | Counts | Sigma | Mean | Median | Sigma |
| A | 0 | 13 | 47663 | 254.84 | 918 | 901 | 183.5 |
| A | 13 | 254 | 15465 | 79.37 | 918 | 901 | 183.5 |
| A | 8 | 192 | 14081 | 71.83 | 918 | 901 | 183.5 |
| B | 6 | 159 | 2151927 | 12424.92 | 908 | 885 | 173.1 |
| B | 5 | 172 | 55625 | 316.19 | 908 | 885 | 173.1 |
| B | 4 | 171 | 42195 | 238.61 | 908 | 885 | 173.1 |
| C | 3 | 233 | 1135142 | 5492.91 | 870 | 876 | 206.5 |
| C | 14 | 238 | 149890 | 721.63 | 870 | 876 | 206.5 |
| C | 10 | 22 | 66267 | 316.67 | 870 | 876 | 206.5 |
| D | 13 | 104 | 2421972 | 11765.68 | 854 | 831 | 205.8 |
| D | 8 | 195 | 348718 | 1690.58 | 854 | 831 | 205.8 |
| D | 13 | 249 | 158232 | 764.9 | 854 | 831 | 205.8 |
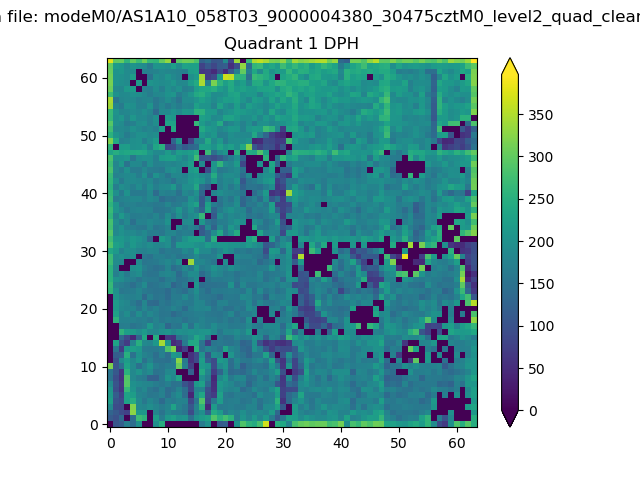
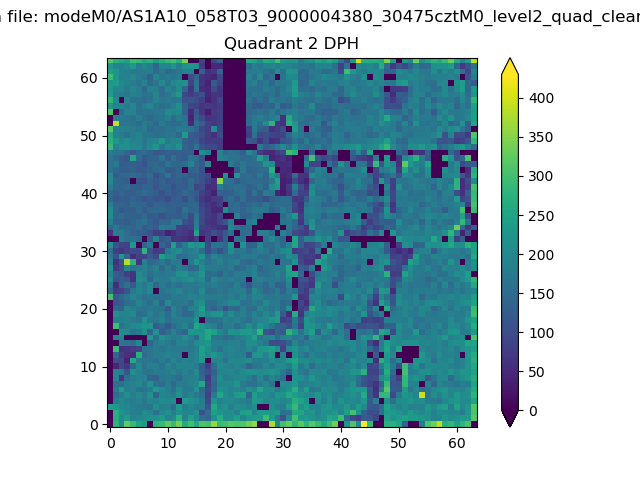
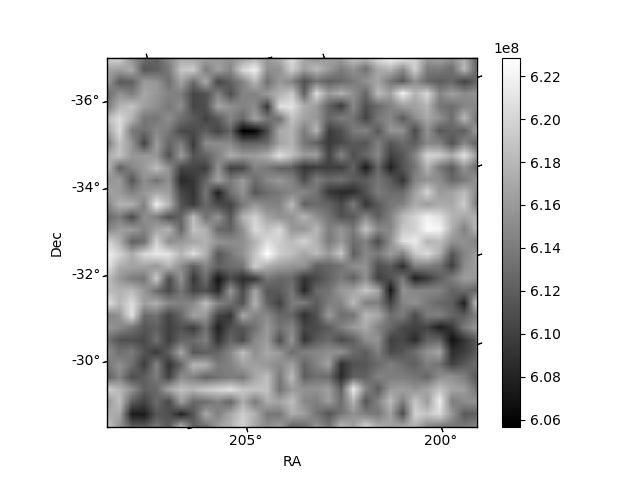
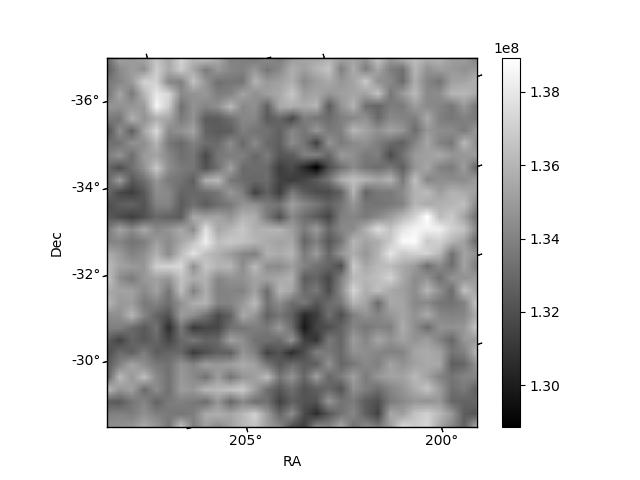
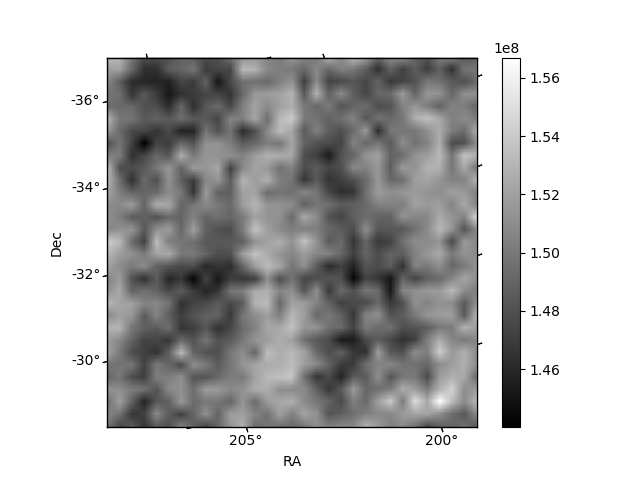
Histogram calculated using DETX and DETY for each event in the final _common_clean file
| Quadrant A | 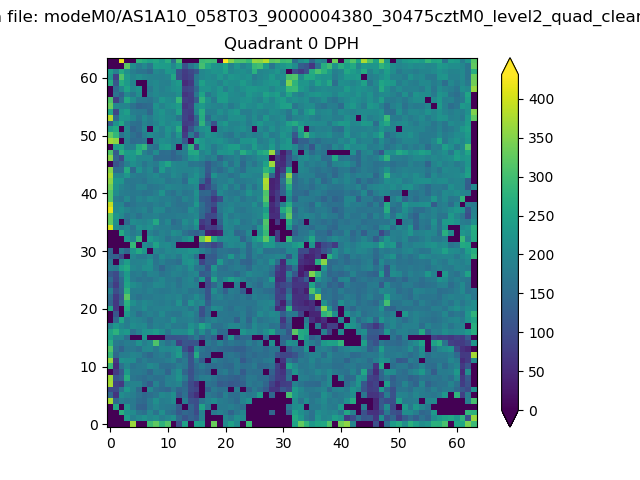 |
 |
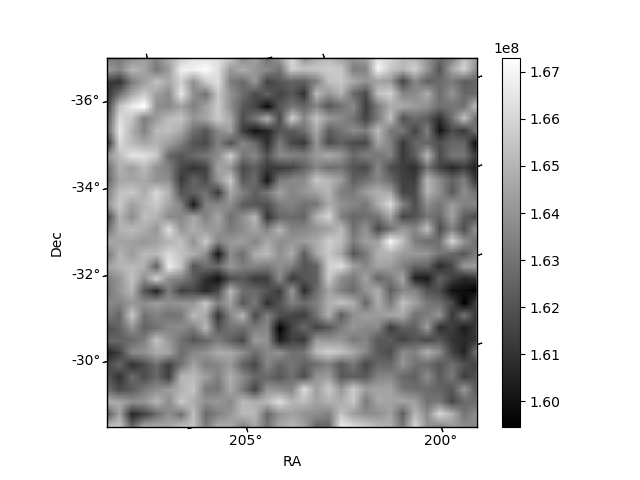
Quadrant B |
|---|---|---|---|
| Quadrant D | 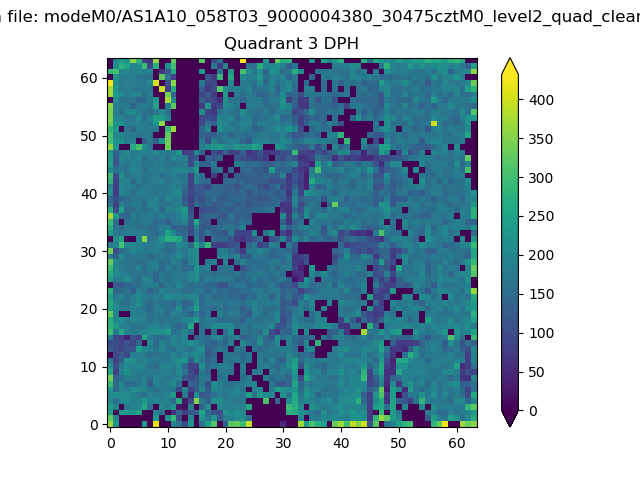 |
 |
Quadrant C |
| Plot type | Count rate plots | Images |
|---|---|---|
| Comparison with Poisson distribution Blue bars denote a histogram of data divided into 1 sec bins. Red curve is a Poisson curve with rate = median count rate of data. |
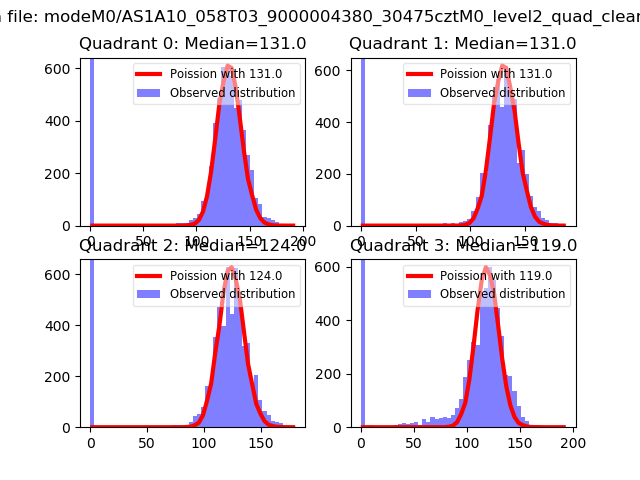 |
 |
| Quadrant-wise count rates Data is divided into 100 sec bins |
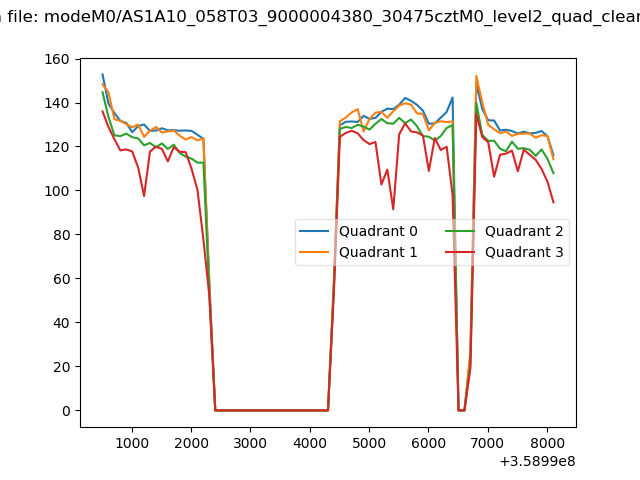 |
|
| Module-wise count rates for Quadrant A Data is divided into 100 sec bins |
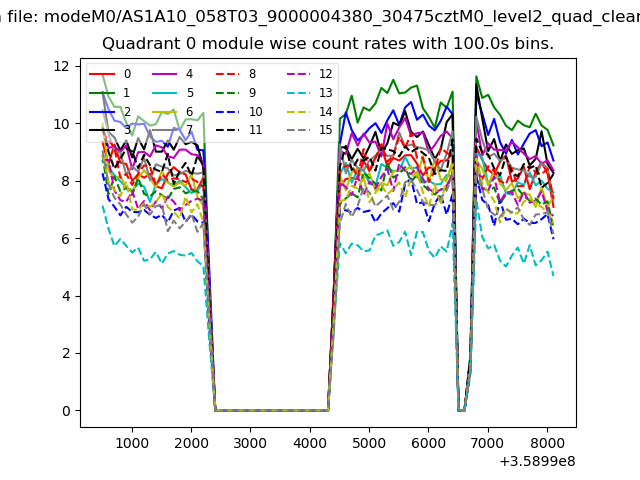 |
 |
| Module-wise count rates for Quadrant B Data is divided into 100 sec bins |
 |
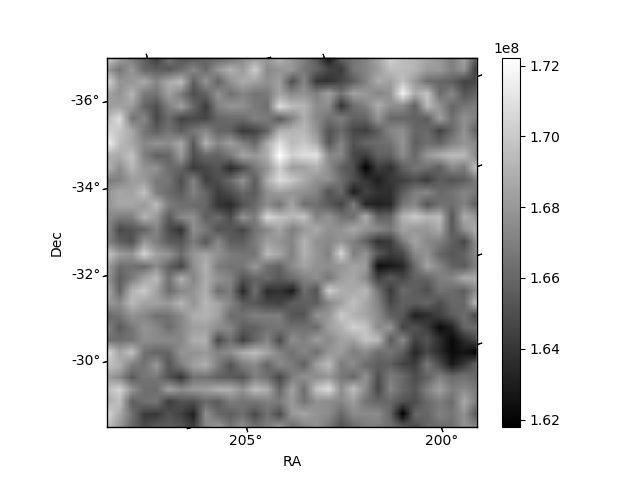 |
| Module-wise count rates for Quadrant C Data is divided into 100 sec bins |
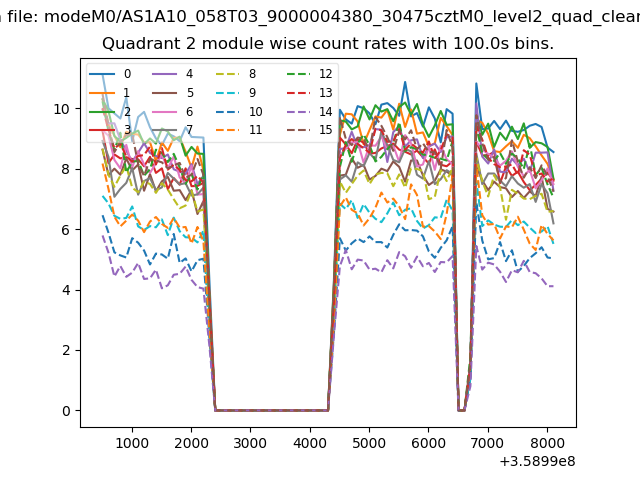 |
 |
| Module-wise count rates for Quadrant D Data is divided into 100 sec bins |
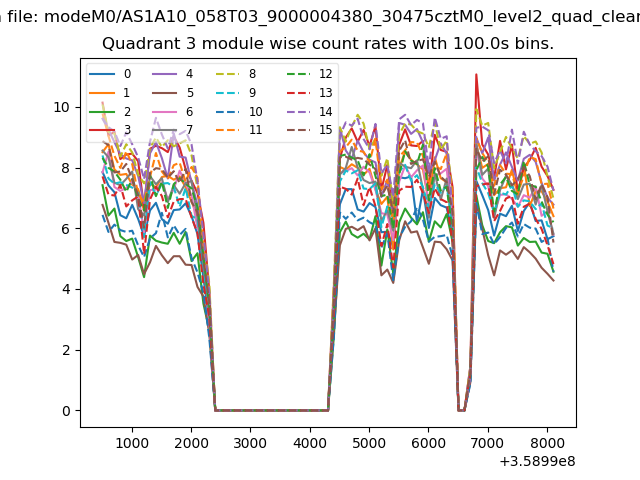 |
 |
| Parameter | Plot |
|---|---|
| CZT HV Monitor | 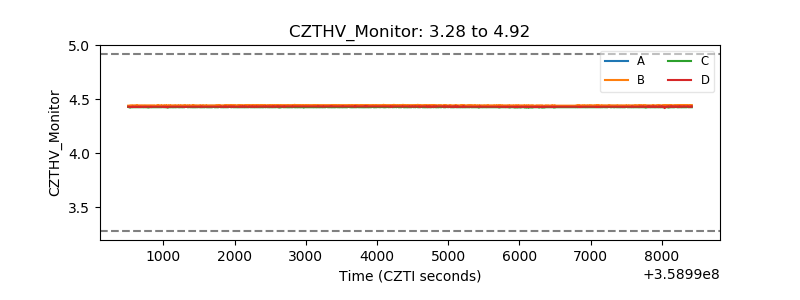 |
| D_VDD | 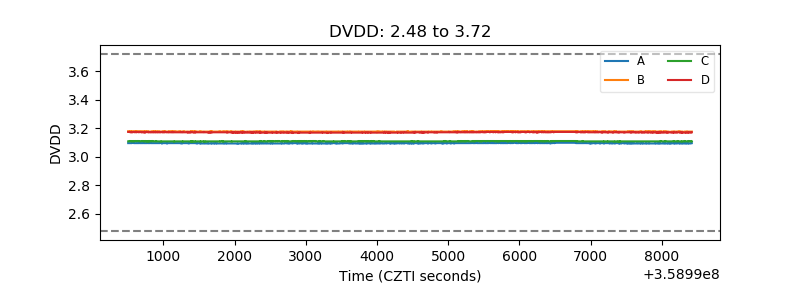 |
| Temperature 1 | 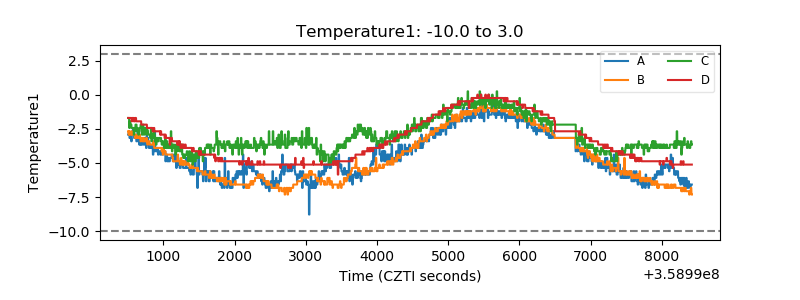 |
| Veto HV Monitor | 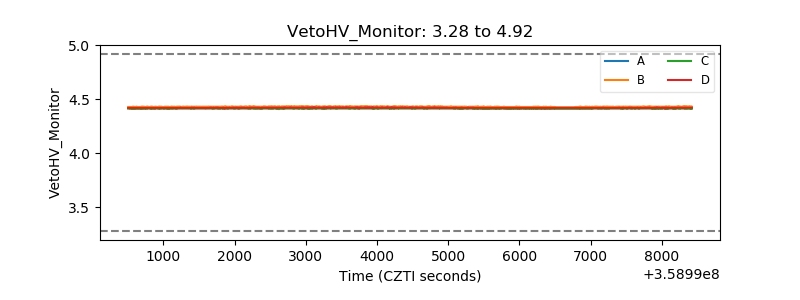 |
| Veto LLD | 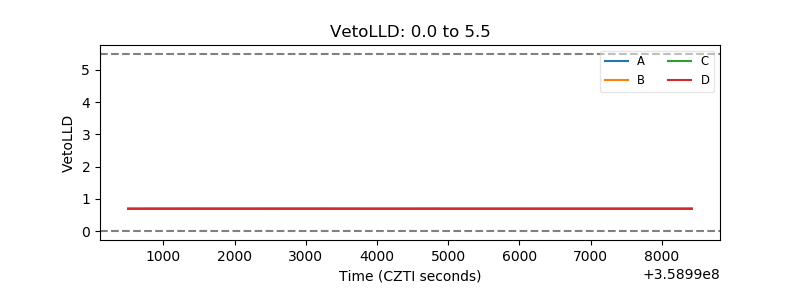 |
| Alpha Counter | 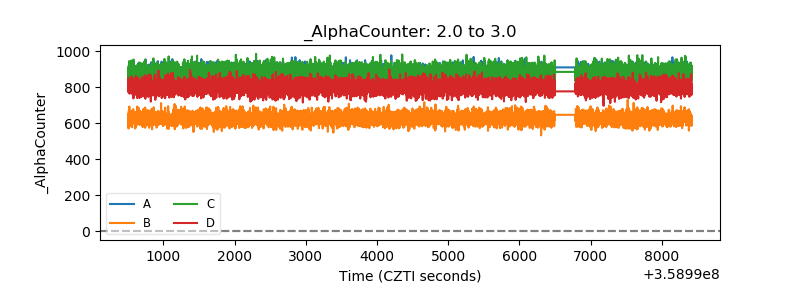 |
| _CPM_Rate | 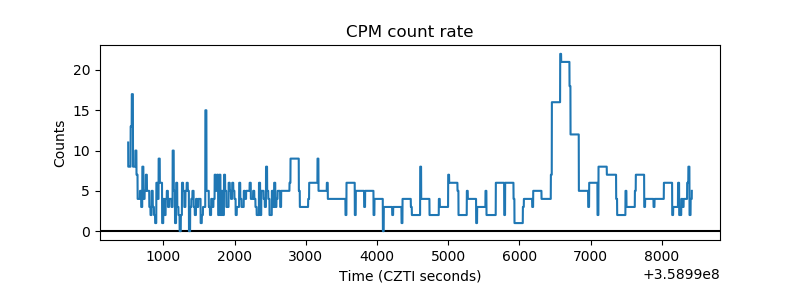 |
| CZT Counter | 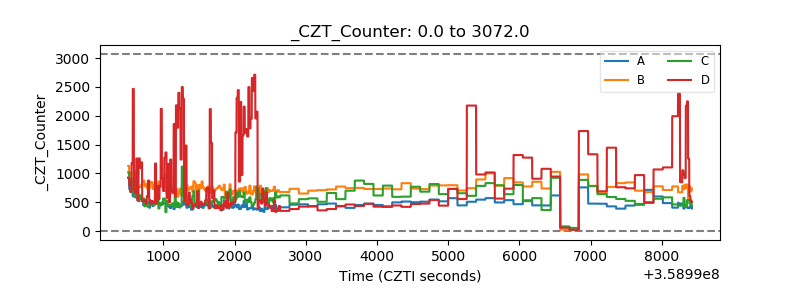 |
| +2.5 Volts monitor | 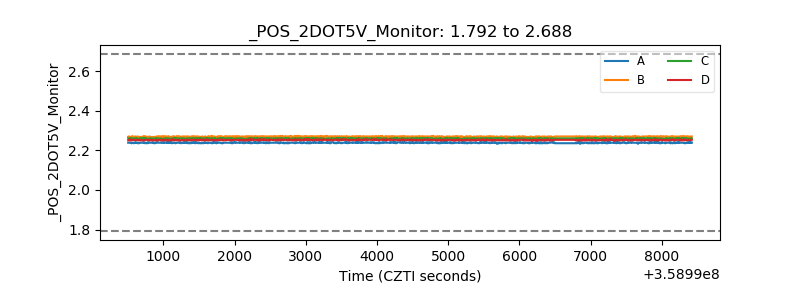 |
| +5 Volts monitor |  |
| _ROLL_ROT | 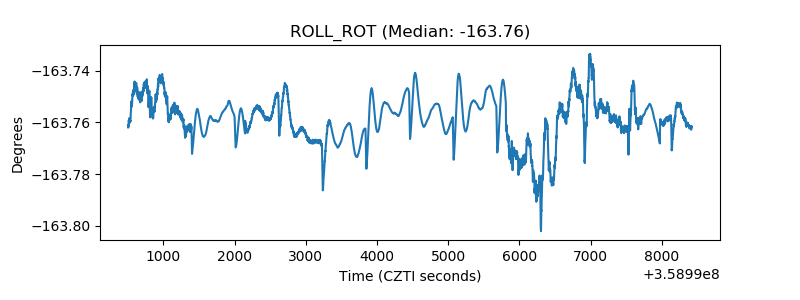 |
| _Roll_DEC | 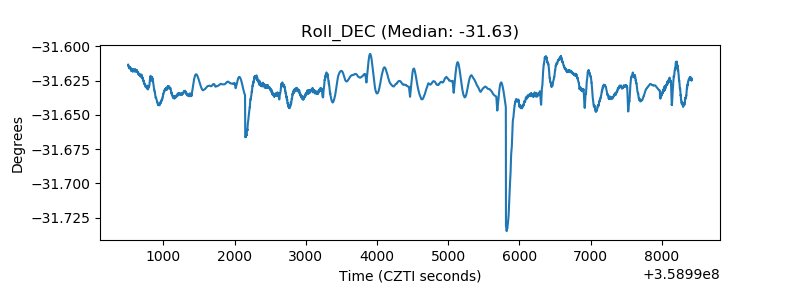 |
| _Roll_RA | 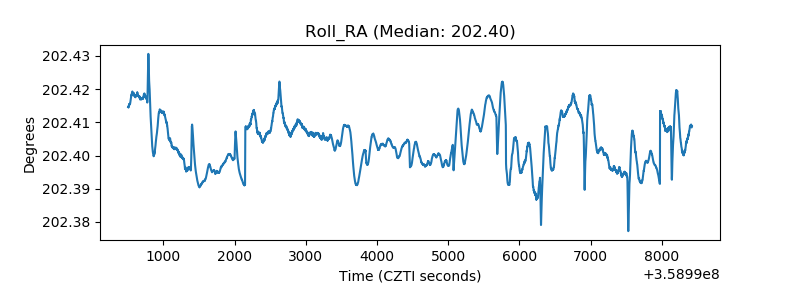 |
| Veto Counter | 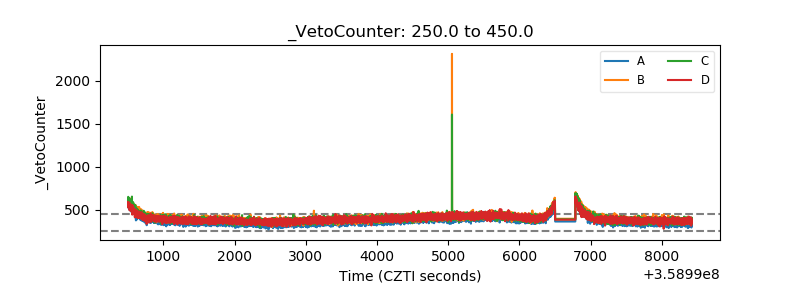 |