| Param | Original file | Final file |
|---|---|---|
| Filename | modeM0/AS1A10_058T03_9000004380_30478cztM0_level2.evt | modeM0/AS1A10_058T03_9000004380_30478cztM0_level2_quad_clean.evt |
| Size (bytes) | 1,696,561,920 | 222,526,080 |
| Size | 1.6 GB | 212.2 MB |
| Events in quadrant A | 8,889,702 | 1,418,979 |
| Events in quadrant B | 14,335,649 | 1,408,809 |
| Events in quadrant C | 12,362,052 | 1,339,721 |
| Events in quadrant D | 14,541,208 | 1,288,862 |
| Mode M9 | |||
|---|---|---|---|
| Quadrant | BADHDUFLAG | Total packets | Discarded packets |
| A | 0 | 20 | 0 |
| B | 0 | 20 | 0 |
| C | 0 | 20 | 0 |
| D | 0 | 20 | 0 |
| Mode M0 | |||
|---|---|---|---|
| Quadrant | BADHDUFLAG | Total packets | Discarded packets |
| A | 0 | 38542 | 4 |
| B | 0 | 56603 | 4 |
| C | 0 | 49472 | 4 |
| D | 0 | 55619 | 5 |
| Mode SS | |||
|---|---|---|---|
| Quadrant | BADHDUFLAG | Total packets | Discarded packets |
| A | 0 | 382 | 0 |
| B | 0 | 382 | 0 |
| C | 0 | 382 | 0 |
| D | 0 | 382 | 0 |
| Quadrant | Total seconds | Saturated seconds | Saturation percentage |
|---|---|---|---|
| A | 18607 | 144 | 0.773902% |
| B | 18607 | 330 | 1.773526% |
| C | 18607 | 445 | 2.391573% |
| D | 18606 | 1061 | 5.702462% |
Noise dominated data is calculated using 1-second bins in cleaned event files. If a bin has >2000 counts, and if more than 50% of those come from <1% of pixels, then it is considered to be noise-dominated and hence unusable.
| Quadrant | # 1 sec bins | Bins with >0 counts | Bins with >2000 counts | High rate bins dominated by noise | Noise dominated (total time) | Noise dominated (detector-on time) | Marked lightcurve |
|---|---|---|---|---|---|---|---|
| A | 20692 | 18610 | 16 | 16 | 0.08% | 0.09% | 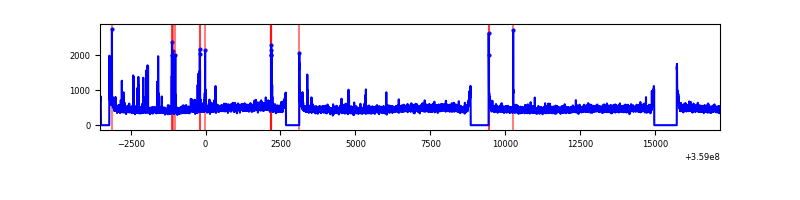 |
| B | 20692 | 18610 | 38 | 38 | 0.18% | 0.20% | 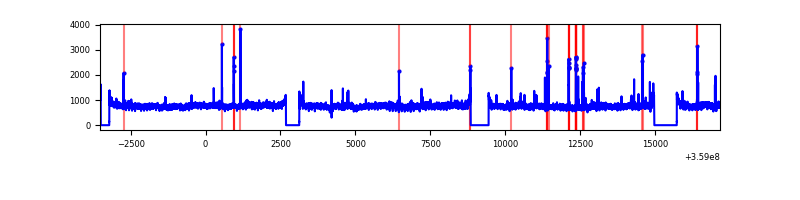 |
| C | 20692 | 18610 | 32 | 32 | 0.15% | 0.17% | 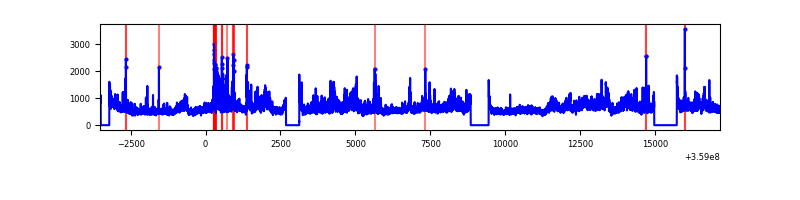 |
| D | 20691 | 18609 | 979 | 979 | 4.73% | 5.26% | 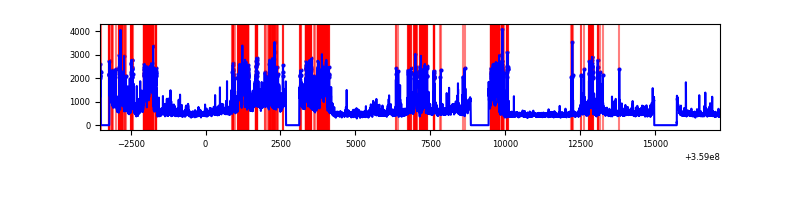 |
Top three noisy pixels from each quadrant. If the there are fewer than three noisy pixels in the level2.evt file, extra rows are filled as -1
| Pixel properties | Quadrant properties | ||||||
|---|---|---|---|---|---|---|---|
| Quadrant | DetID | PixID | Counts | Sigma | Mean | Median | Sigma |
| A | 0 | 13 | 171106 | 377.79 | 2244 | 2197 | 447.1 |
| A | 8 | 192 | 45261 | 96.32 | 2244 | 2197 | 447.1 |
| A | 13 | 254 | 35310 | 74.06 | 2244 | 2197 | 447.1 |
| B | 6 | 159 | 5224652 | 12412.34 | 2218 | 2159 | 420.8 |
| B | 0 | 229 | 137528 | 321.73 | 2218 | 2159 | 420.8 |
| B | 4 | 171 | 101512 | 236.13 | 2218 | 2159 | 420.8 |
| C | 3 | 233 | 3134665 | 6299.01 | 2129 | 2144 | 497.3 |
| C | 14 | 238 | 348291 | 696.05 | 2129 | 2144 | 497.3 |
| C | 10 | 22 | 284009 | 566.79 | 2129 | 2144 | 497.3 |
| D | 13 | 104 | 3389710 | 6722.91 | 2130 | 2081 | 503.9 |
| D | 8 | 195 | 2009426 | 3983.67 | 2130 | 2081 | 503.9 |
| D | 2 | 250 | 548875 | 1085.14 | 2130 | 2081 | 503.9 |
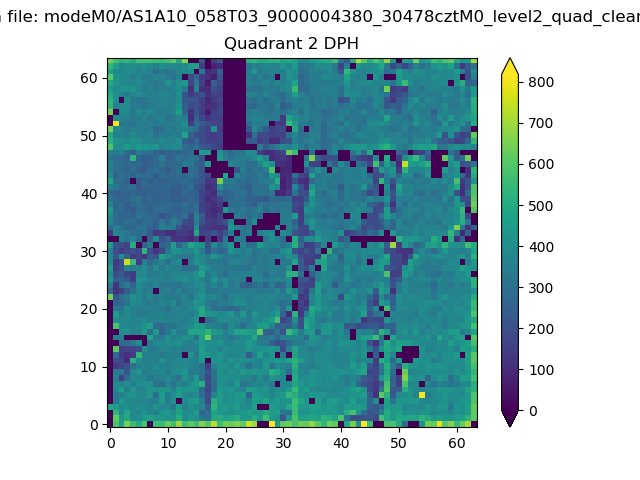
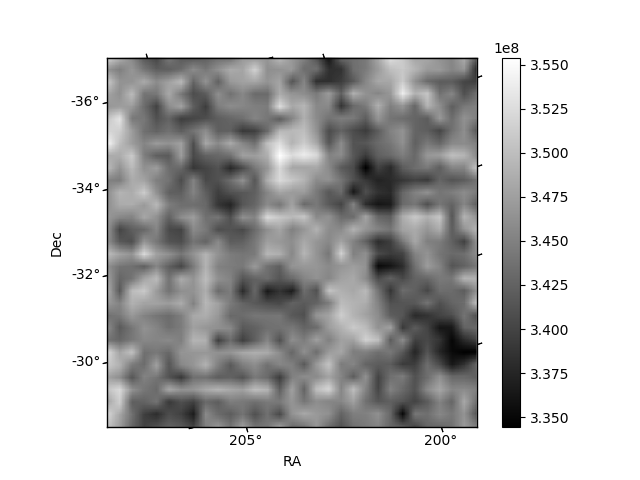
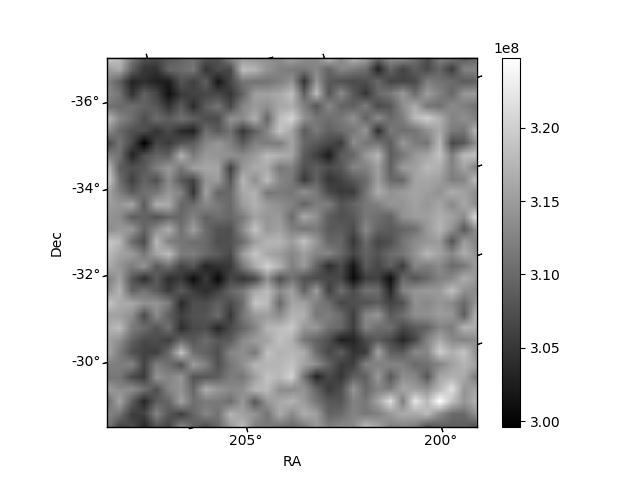
Histogram calculated using DETX and DETY for each event in the final _common_clean file
| Quadrant A | 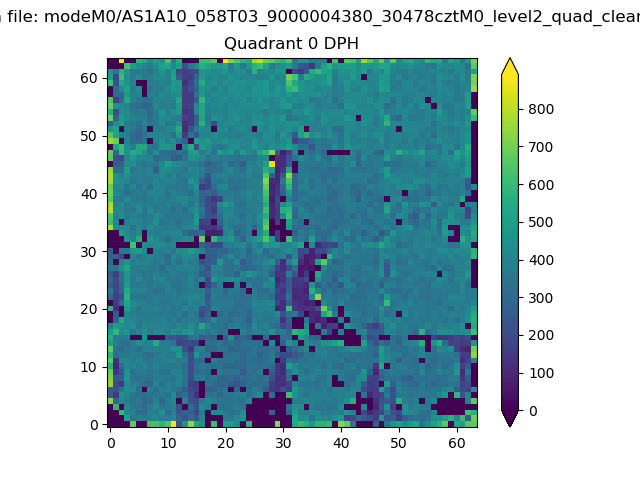 |
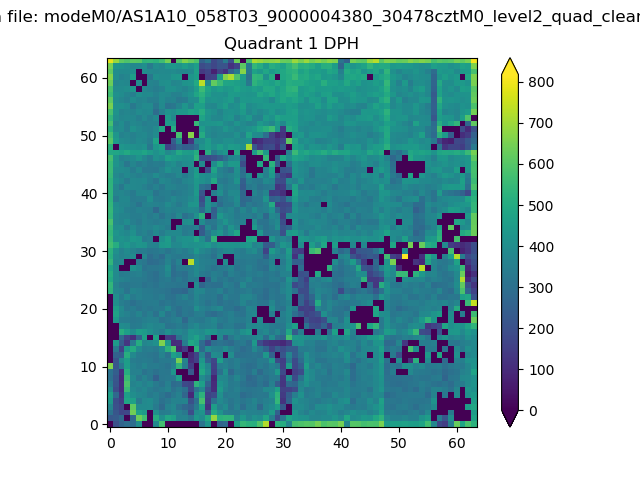 |
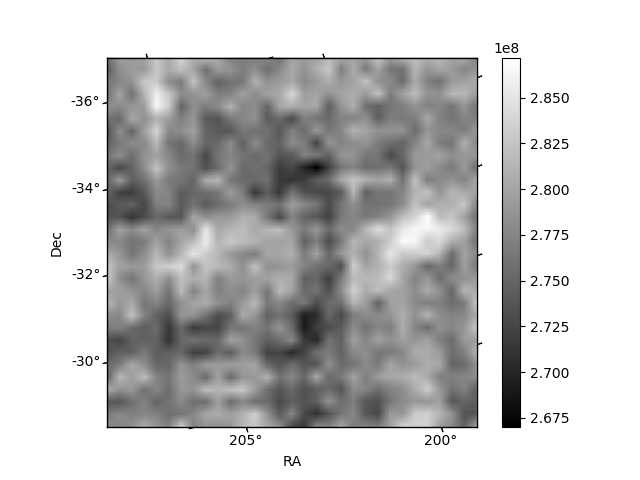
Quadrant B |
|---|---|---|---|
| Quadrant D | 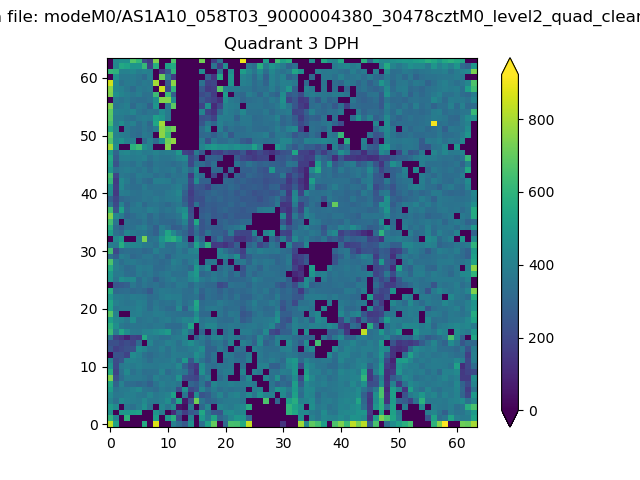 |
 |
Quadrant C |
| Plot type | Count rate plots | Images |
|---|---|---|
| Comparison with Poisson distribution Blue bars denote a histogram of data divided into 1 sec bins. Red curve is a Poisson curve with rate = median count rate of data. |
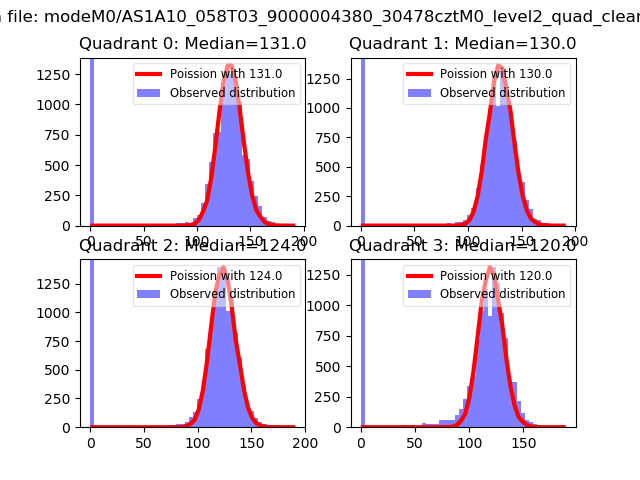 |
 |
| Quadrant-wise count rates Data is divided into 100 sec bins |
 |
|
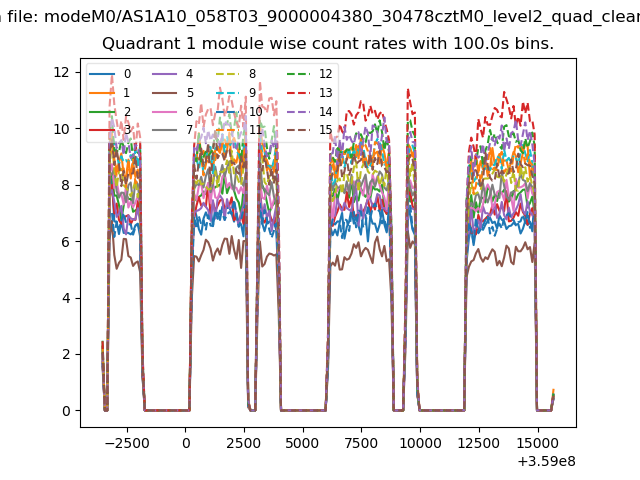
| Module-wise count rates for Quadrant A Data is divided into 100 sec bins |
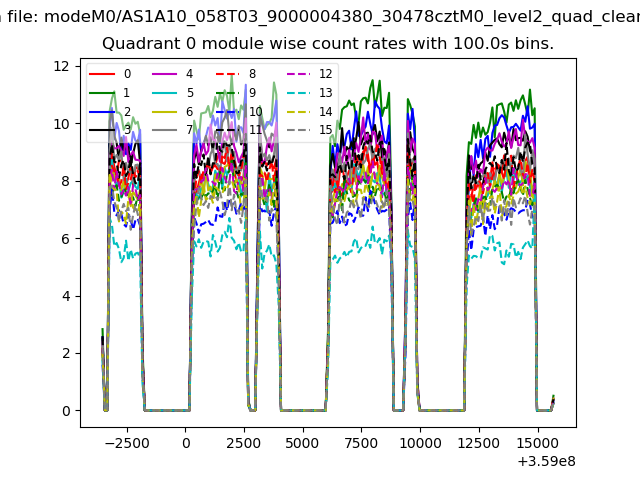 |
 |
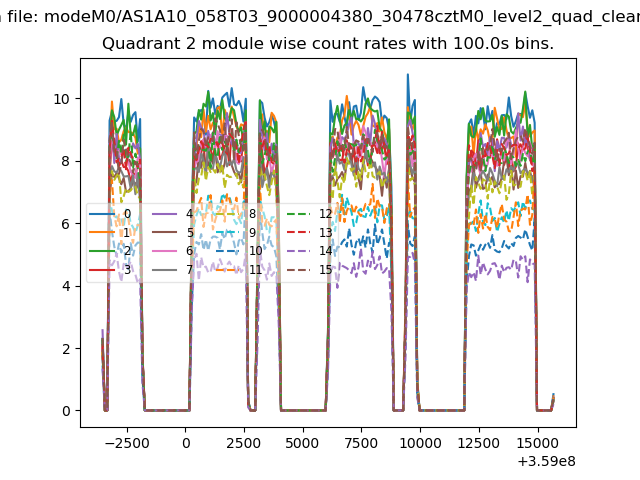
| Module-wise count rates for Quadrant B Data is divided into 100 sec bins |
 |
 |
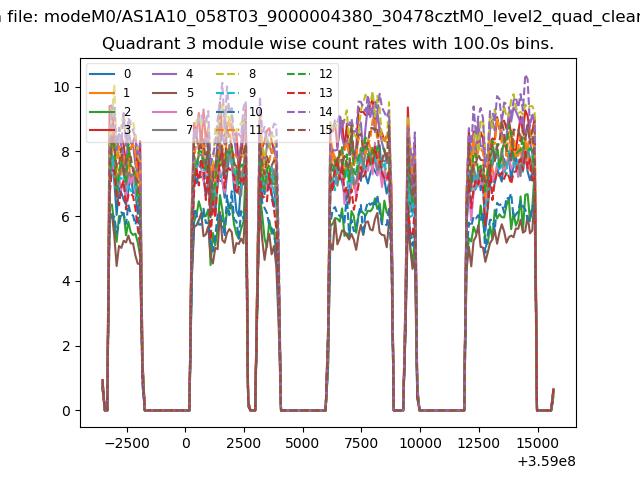
| Module-wise count rates for Quadrant C Data is divided into 100 sec bins |
 |
 |
| Module-wise count rates for Quadrant D Data is divided into 100 sec bins |
 |
 |
| Parameter | Plot |
|---|---|
| CZT HV Monitor | 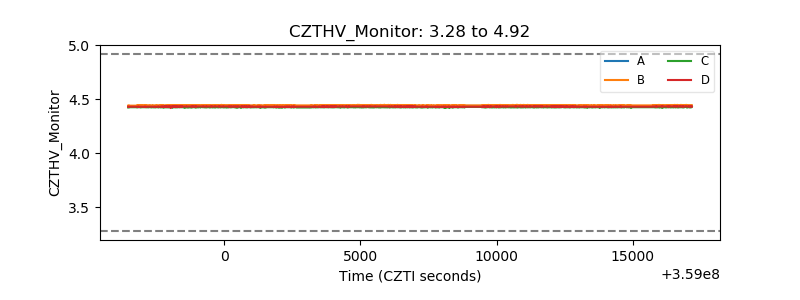 |
| D_VDD |  |
| Temperature 1 | 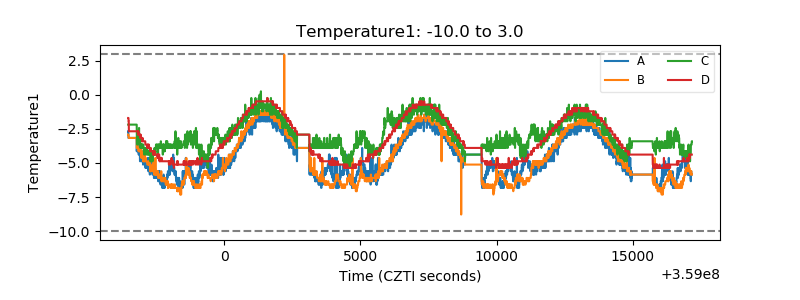 |
| Veto HV Monitor | 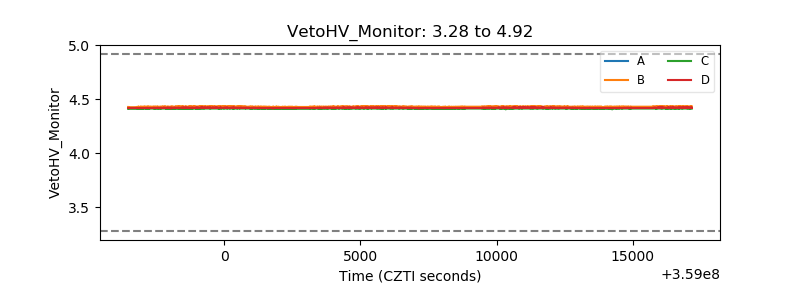 |
| Veto LLD | 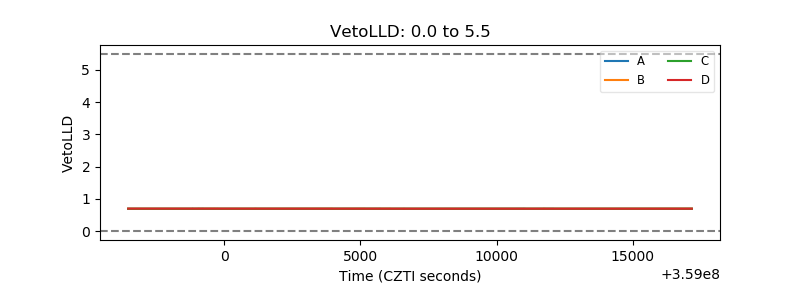 |
| Alpha Counter |  |
| _CPM_Rate | 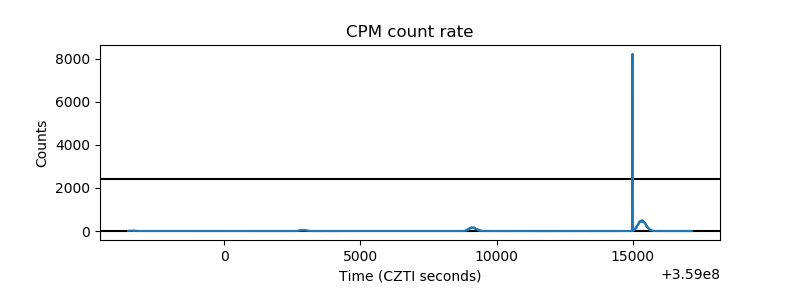 |
| CZT Counter | 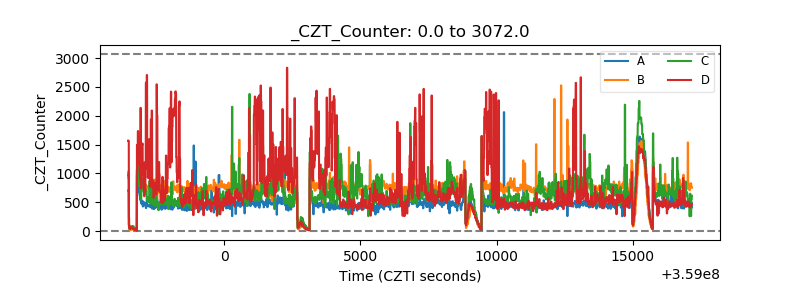 |
| +2.5 Volts monitor |  |
| +5 Volts monitor |  |
| _ROLL_ROT | 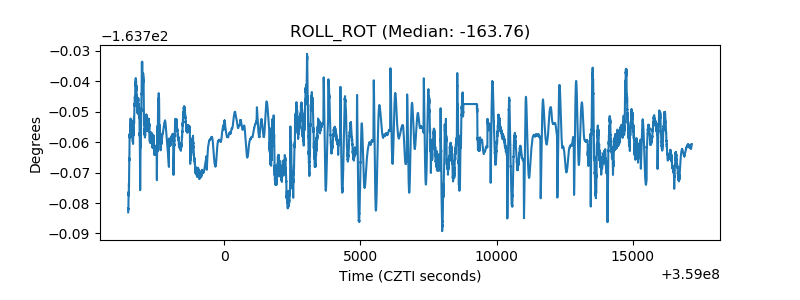 |
| _Roll_DEC | 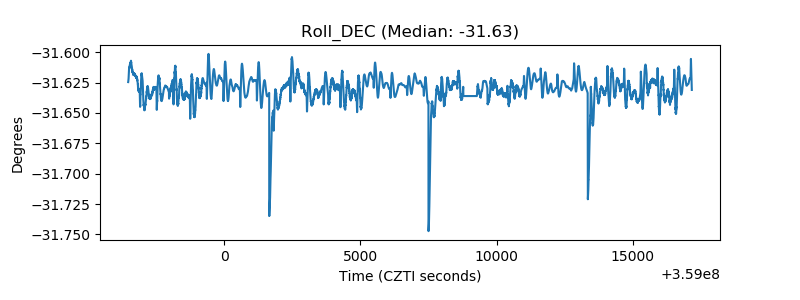 |
| _Roll_RA | 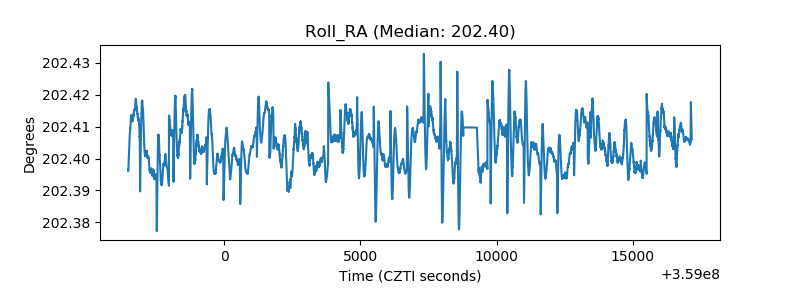 |
| Veto Counter | 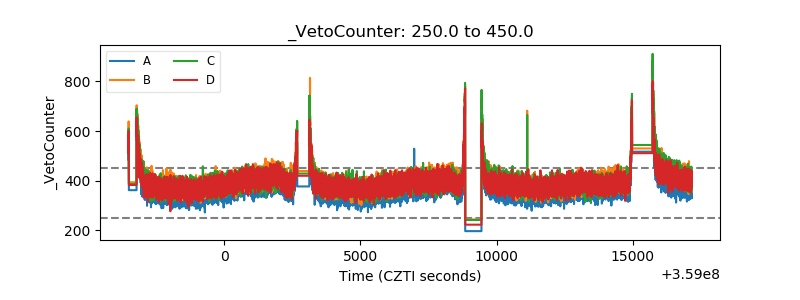 |