| Param | Original file | Final file |
|---|---|---|
| Filename | modeM0/AS1A10_058T03_9000004380_30479cztM0_level2.evt | modeM0/AS1A10_058T03_9000004380_30479cztM0_level2_quad_clean.evt |
| Size (bytes) | 383,973,120 | 54,486,720 |
| Size | 366.2 MB | 52.0 MB |
| Events in quadrant A | 2,233,833 | 337,621 |
| Events in quadrant B | 3,667,785 | 335,229 |
| Events in quadrant C | 2,934,286 | 322,423 |
| Events in quadrant D | 2,468,935 | 319,805 |
| Mode M9 | |||
|---|---|---|---|
| Quadrant | BADHDUFLAG | Total packets | Discarded packets |
| A | 0 | 7 | 0 |
| B | 0 | 7 | 0 |
| C | 0 | 7 | 0 |
| D | 0 | 7 | 0 |
| Mode M0 | |||
|---|---|---|---|
| Quadrant | BADHDUFLAG | Total packets | Discarded packets |
| A | 0 | 9733 | 1 |
| B | 0 | 14514 | 1 |
| C | 0 | 11966 | 1 |
| D | 0 | 10354 | 1 |
| Mode SS | |||
|---|---|---|---|
| Quadrant | BADHDUFLAG | Total packets | Discarded packets |
| A | 0 | 98 | 0 |
| B | 0 | 98 | 0 |
| C | 0 | 98 | 0 |
| D | 0 | 98 | 0 |
| Quadrant | Total seconds | Saturated seconds | Saturation percentage |
|---|---|---|---|
| A | 4759 | 34 | 0.714436% |
| B | 4760 | 94 | 1.974790% |
| C | 4760 | 117 | 2.457983% |
| D | 4760 | 42 | 0.882353% |
Noise dominated data is calculated using 1-second bins in cleaned event files. If a bin has >2000 counts, and if more than 50% of those come from <1% of pixels, then it is considered to be noise-dominated and hence unusable.
| Quadrant | # 1 sec bins | Bins with >0 counts | Bins with >2000 counts | High rate bins dominated by noise | Noise dominated (total time) | Noise dominated (detector-on time) | Marked lightcurve |
|---|---|---|---|---|---|---|---|
| A | 5514 | 4760 | 0 | 0 | 0.00% | 0.00% | 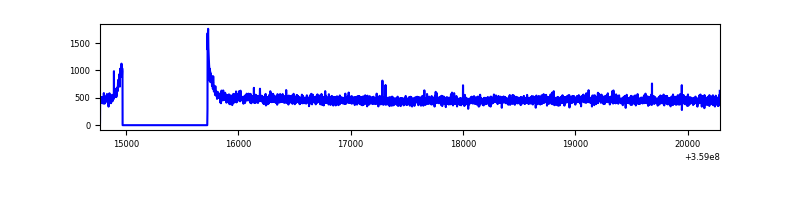 |
| B | 5515 | 4761 | 12 | 12 | 0.22% | 0.25% | 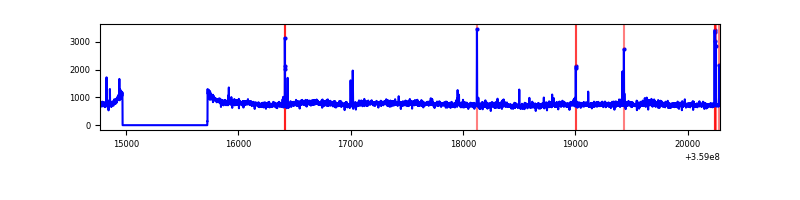 |
| C | 5515 | 4761 | 2 | 2 | 0.04% | 0.04% | 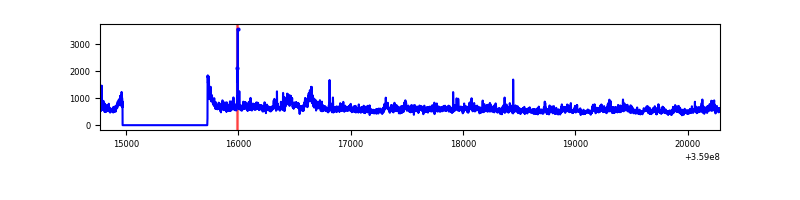 |
| D | 5515 | 4761 | 12 | 12 | 0.22% | 0.25% | 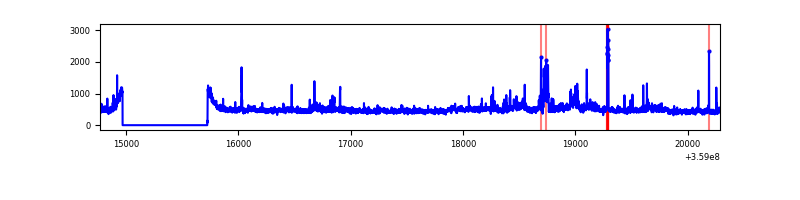 |
Top three noisy pixels from each quadrant. If the there are fewer than three noisy pixels in the level2.evt file, extra rows are filled as -1
| Pixel properties | Quadrant properties | ||||||
|---|---|---|---|---|---|---|---|
| Quadrant | DetID | PixID | Counts | Sigma | Mean | Median | Sigma |
| A | 8 | 192 | 10490 | 85.36 | 576 | 565 | 116.3 |
| A | 13 | 254 | 7865 | 62.79 | 576 | 565 | 116.3 |
| A | 3 | 137 | 5991 | 46.67 | 576 | 565 | 116.3 |
| B | 6 | 159 | 1275993 | 11533.49 | 567 | 552 | 110.6 |
| B | 0 | 229 | 77749 | 698.07 | 567 | 552 | 110.6 |
| B | 4 | 171 | 45226 | 403.98 | 567 | 552 | 110.6 |
| C | 3 | 233 | 637682 | 4935.93 | 546 | 549 | 129.1 |
| C | 14 | 238 | 90412 | 696.18 | 546 | 549 | 129.1 |
| C | 15 | 208 | 49649 | 380.38 | 546 | 549 | 129.1 |
| D | 8 | 195 | 131772 | 989.63 | 556 | 542 | 132.6 |
| D | 13 | 104 | 123898 | 930.25 | 556 | 542 | 132.6 |
| D | 2 | 250 | 24897 | 183.67 | 556 | 542 | 132.6 |
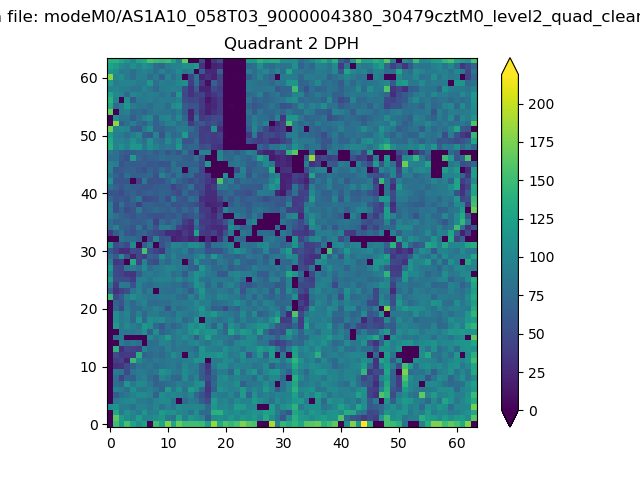
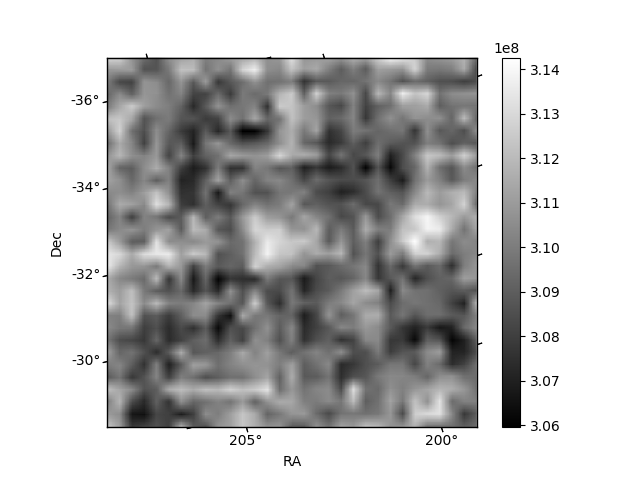
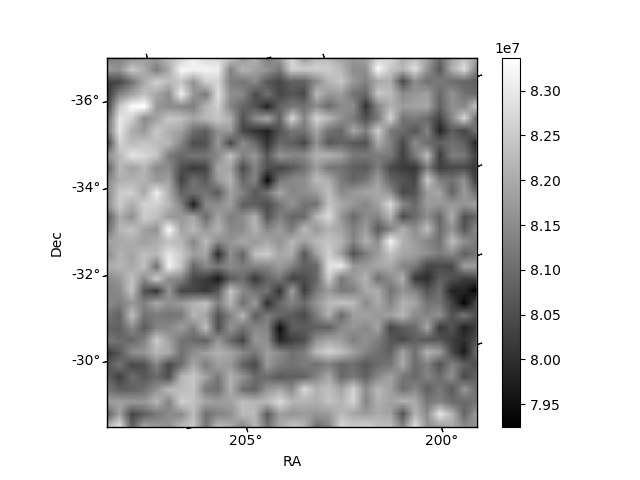
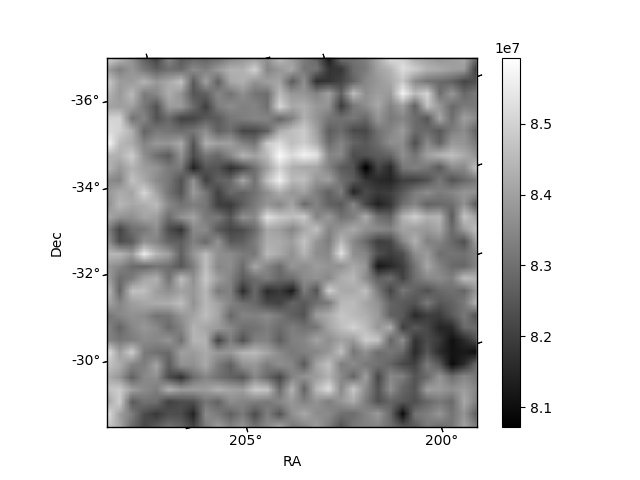
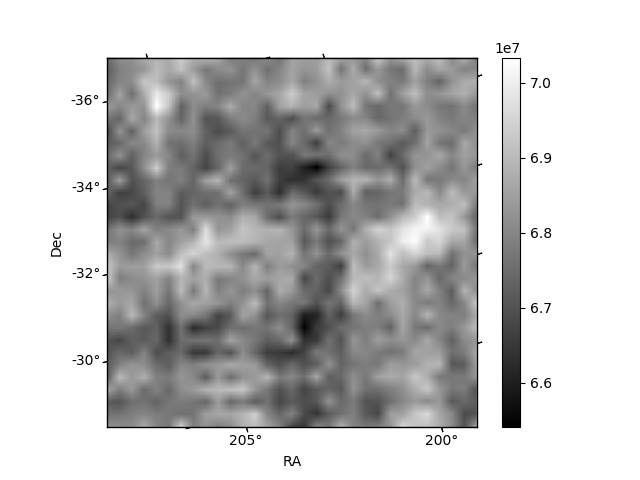
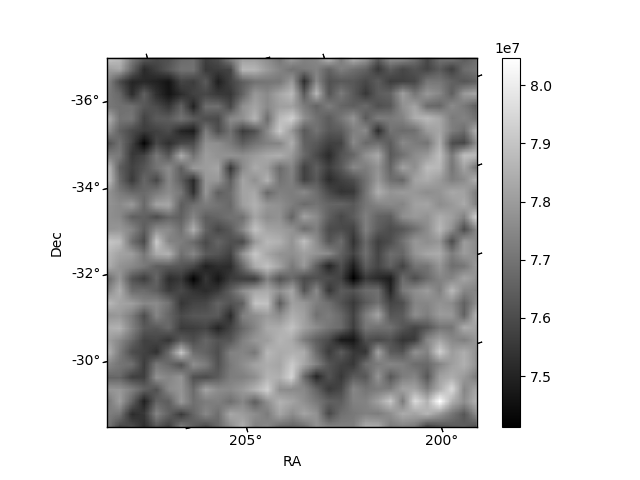
Histogram calculated using DETX and DETY for each event in the final _common_clean file
| Quadrant A | 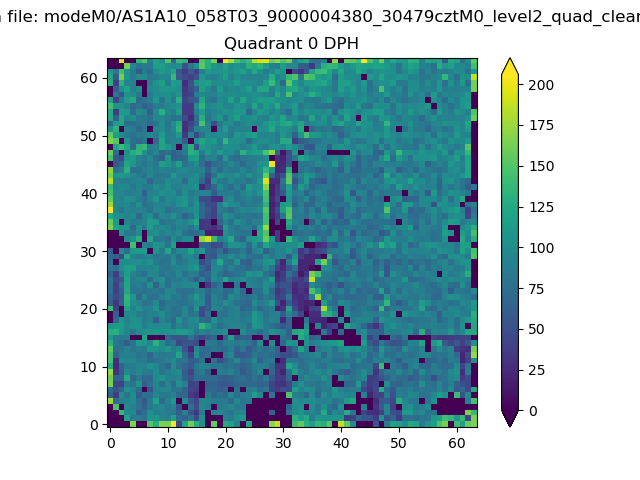 |
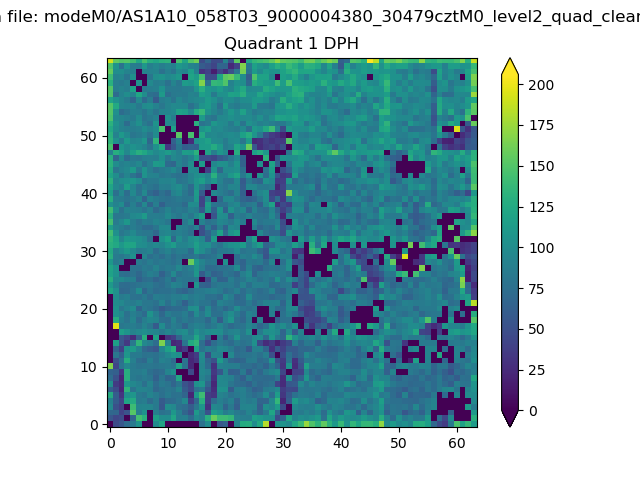 |
Quadrant B |
|---|---|---|---|
| Quadrant D | 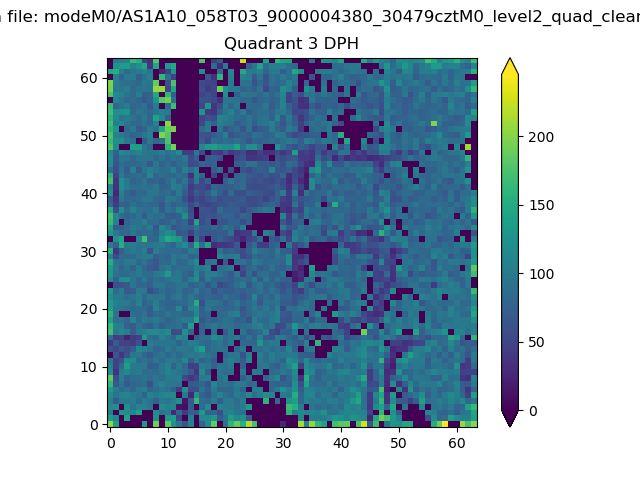 |
 |
Quadrant C |
| Plot type | Count rate plots | Images |
|---|---|---|
| Comparison with Poisson distribution Blue bars denote a histogram of data divided into 1 sec bins. Red curve is a Poisson curve with rate = median count rate of data. |
 |
 |
| Quadrant-wise count rates Data is divided into 100 sec bins |
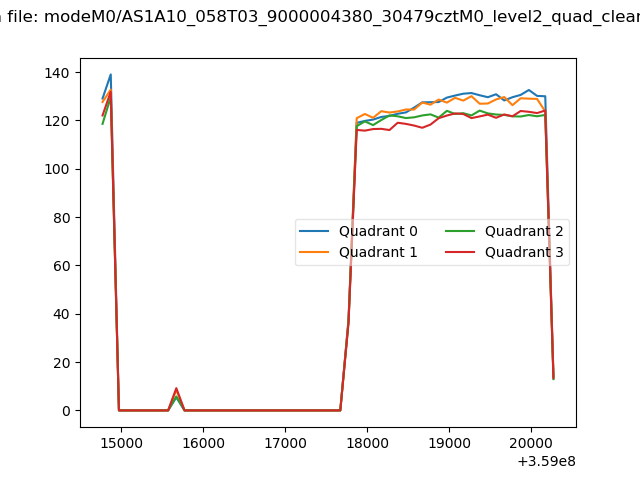 |
|
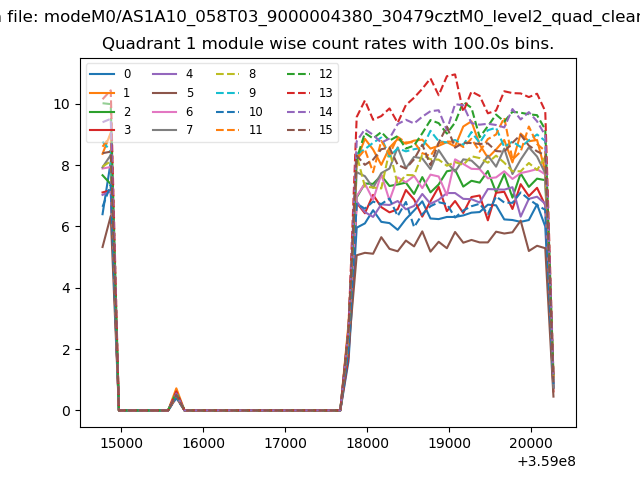
| Module-wise count rates for Quadrant A Data is divided into 100 sec bins |
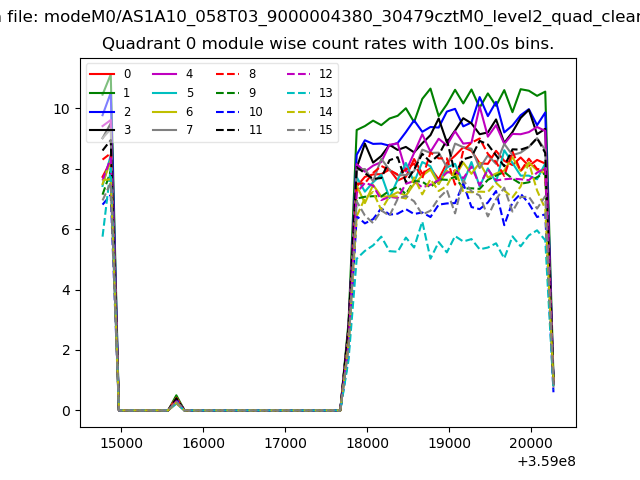 |
 |
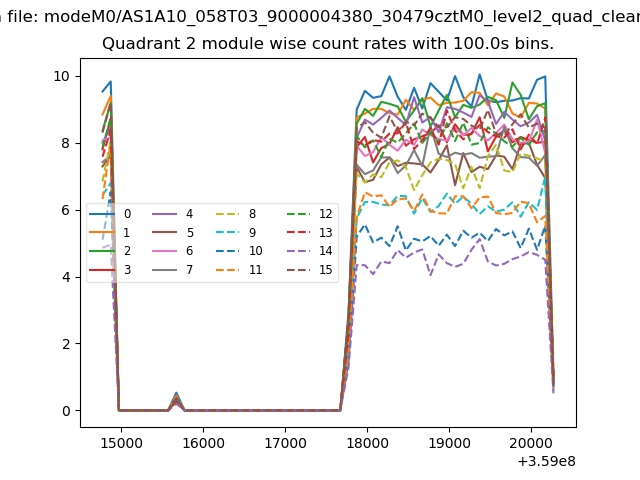
| Module-wise count rates for Quadrant B Data is divided into 100 sec bins |
 |
 |
| Module-wise count rates for Quadrant C Data is divided into 100 sec bins |
 |
 |
| Module-wise count rates for Quadrant D Data is divided into 100 sec bins |
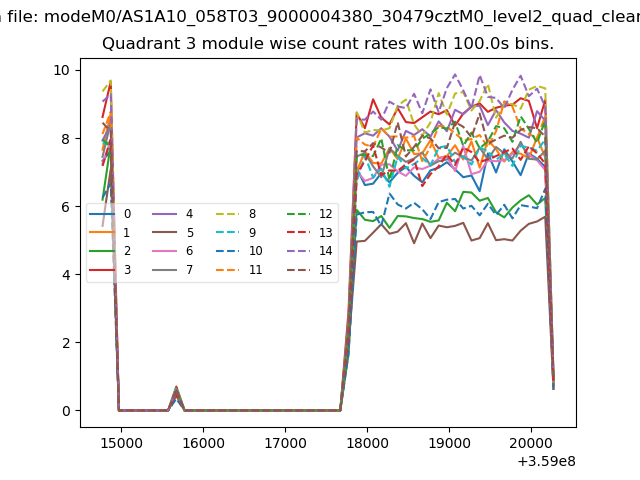 |
 |
| Parameter | Plot |
|---|---|
| CZT HV Monitor | 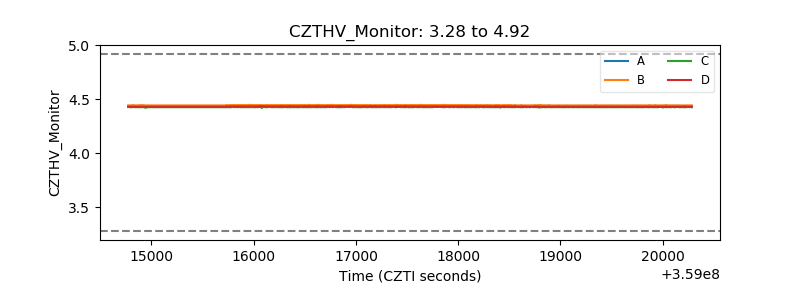 |
| D_VDD | 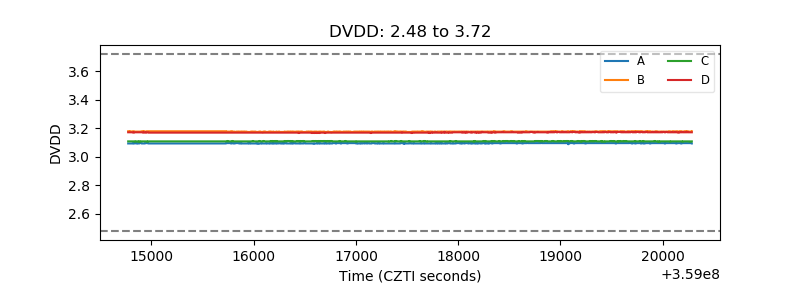 |
| Temperature 1 | 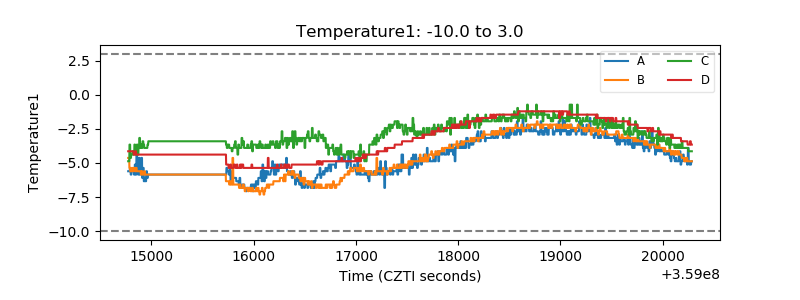 |
| Veto HV Monitor | 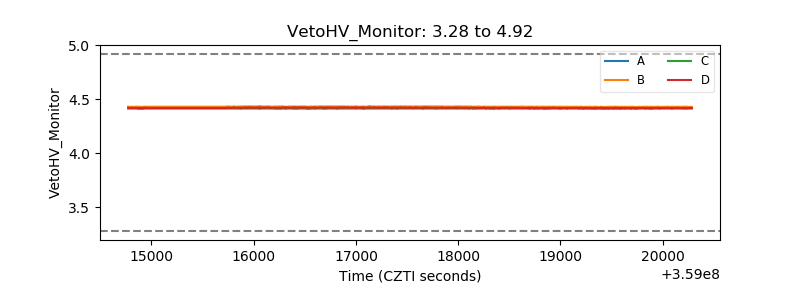 |
| Veto LLD | 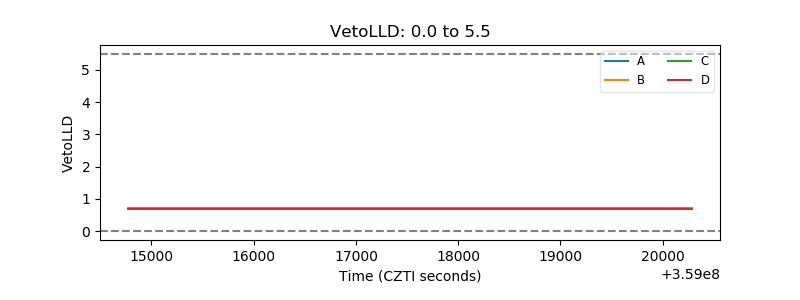 |
| Alpha Counter |  |
| _CPM_Rate |  |
| CZT Counter | 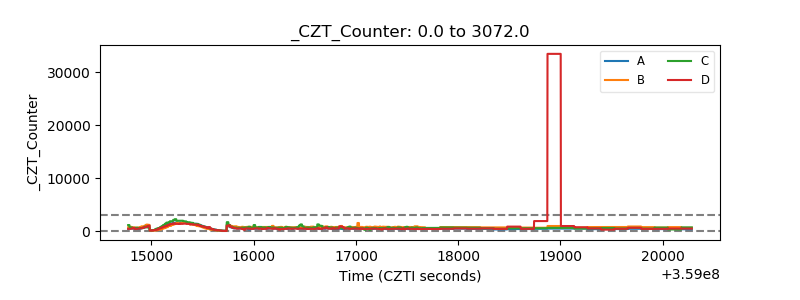 |
| +2.5 Volts monitor |  |
| +5 Volts monitor |  |
| _ROLL_ROT | 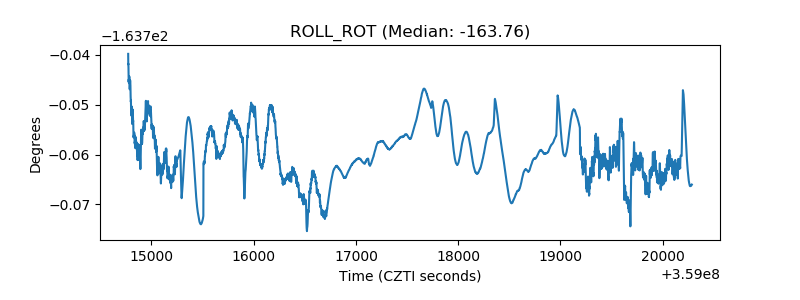 |
| _Roll_DEC | 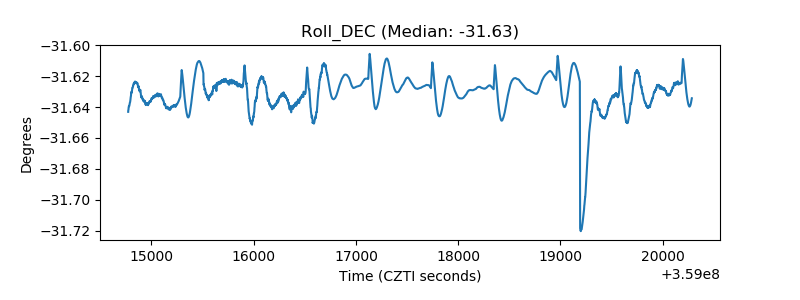 |
| _Roll_RA | 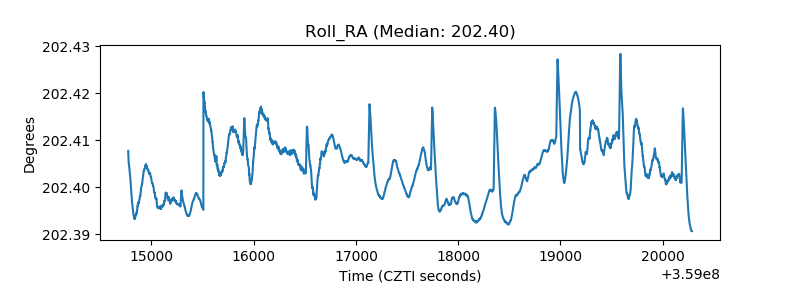 |
| Veto Counter | 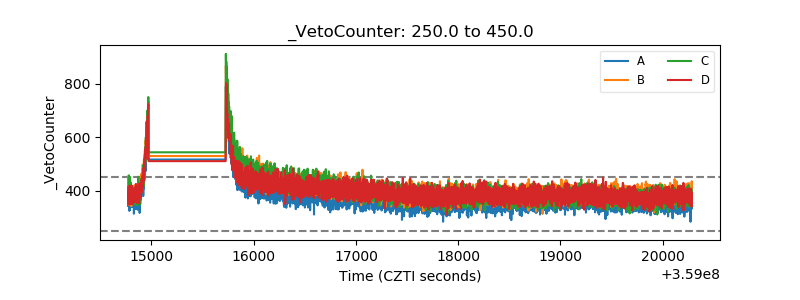 |