| Param | Original file | Final file |
|---|---|---|
| Filename | modeM0/AS1A10_058T04_9000004382cztM0_level2.fits | modeM0/AS1A10_058T04_9000004382cztM0_level2_quad_clean.evt |
| Size (bytes) | 736,433,280 | 633,841,920 |
| Size | 702.3 MB | 604.5 MB |
| Events in quadrant A | 4,762,746 | 3,997,588 |
| Events in quadrant B | 4,420,166 | 3,899,244 |
| Events in quadrant C | 4,516,254 | 3,693,638 |
| Events in quadrant D | 3,446,122 | 2,454,077 |
| Mode SS | |||
|---|---|---|---|
| Quadrant | BADHDUFLAG | Total packets | Discarded packets |
| A | 0 | 1534 | 0 |
| B | 0 | 1534 | 0 |
| C | 0 | 1534 | 0 |
| D | 0 | 1534 | 0 |
| Mode M9 | |||
|---|---|---|---|
| Quadrant | BADHDUFLAG | Total packets | Discarded packets |
| A | 0 | 119 | 0 |
| B | 0 | 119 | 0 |
| C | 0 | 119 | 0 |
| D | 0 | 119 | 0 |
| Mode M0 | |||
|---|---|---|---|
| Quadrant | BADHDUFLAG | Total packets | Discarded packets |
| A | 0 | 160827 | 0 |
| B | 0 | 233889 | 0 |
| C | 0 | 170552 | 0 |
| D | 0 | 271937 | 0 |
| Quadrant | Total seconds | Saturated seconds | Saturation percentage |
|---|---|---|---|
| A | 75093 | 890 | 1.185197% |
| B | 75093 | 1997 | 2.659369% |
| C | 75093 | 1791 | 2.385043% |
| D | 75093 | 16229 | 21.611868% |
Noise dominated data is calculated using 1-second bins in cleaned event files. If a bin has >2000 counts, and if more than 50% of those come from <1% of pixels, then it is considered to be noise-dominated and hence unusable.
| Quadrant | # 1 sec bins | Bins with >0 counts | Bins with >2000 counts | High rate bins dominated by noise | Noise dominated (total time) | Noise dominated (detector-on time) | Marked lightcurve |
|---|---|---|---|---|---|---|---|
| A | 87179 | 75093 | 0 | 0 | 0.00% | 0.00% | 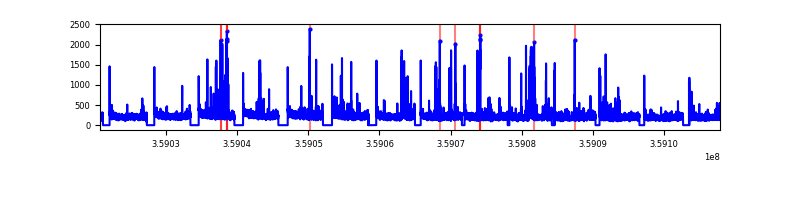 |
| B | 87179 | 75088 | 0 | 0 | 0.00% | 0.00% | 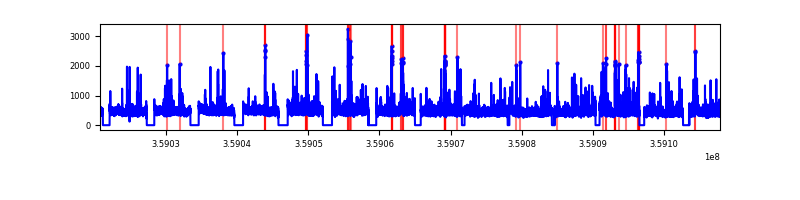 |
| C | 87179 | 75090 | 0 | 0 | 0.00% | 0.00% |  |
| D | 87179 | 71626 | 0 | 0 | 0.00% | 0.00% |  |
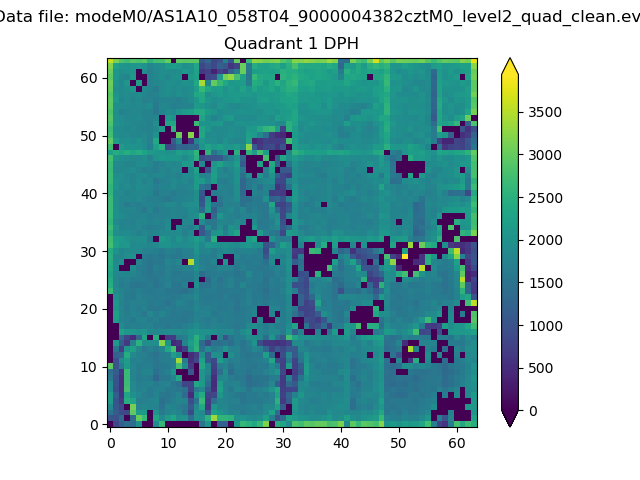
Top three noisy pixels from each quadrant. If the there are fewer than three noisy pixels in the level2.evt file, extra rows are filled as -1
| Pixel properties | Quadrant properties | ||||||
|---|---|---|---|---|---|---|---|
| Quadrant | DetID | PixID | Counts | Sigma | Mean | Median | Sigma |
| A | 0 | 29 | 3918 | 9.23 | 1240 | 1170 | 297.6 |
| A | 7 | 110 | 3804 | 8.85 | 1240 | 1170 | 297.6 |
| A | 9 | 19 | 3568 | 8.06 | 1240 | 1170 | 297.6 |
| B | 2 | 9 | 3546 | 10.43 | 1170 | 1119 | 232.6 |
| B | 3 | 80 | 2961 | 7.92 | 1170 | 1119 | 232.6 |
| B | 5 | 128 | 2960 | 7.91 | 1170 | 1119 | 232.6 |
| C | 1 | 80 | 3573 | 8.13 | 1193 | 1118 | 301.9 |
| C | 1 | 81 | 3477 | 7.81 | 1193 | 1118 | 301.9 |
| C | 12 | 241 | 3175 | 6.81 | 1193 | 1118 | 301.9 |
| D | 15 | 46 | 2651 | 6.77 | 986 | 902 | 258.3 |
| D | 10 | 189 | 2517 | 6.25 | 986 | 902 | 258.3 |
| D | 6 | 67 | 2436 | 5.94 | 986 | 902 | 258.3 |
Histogram calculated using DETX and DETY for each event in the final _common_clean file
| Quadrant A |  |
 |
Quadrant B |
|---|---|---|---|
| Quadrant D | 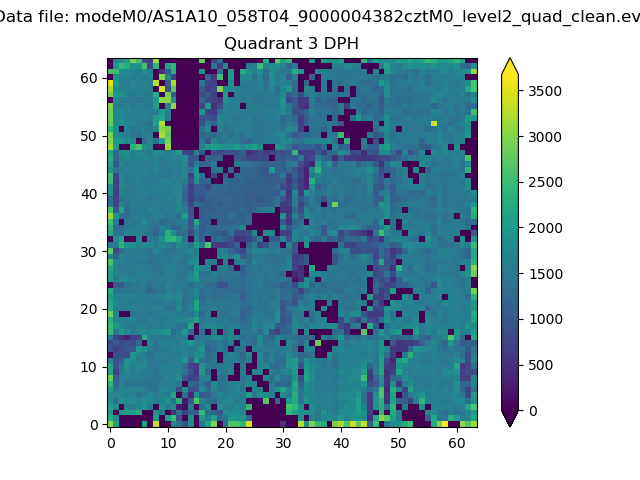 |
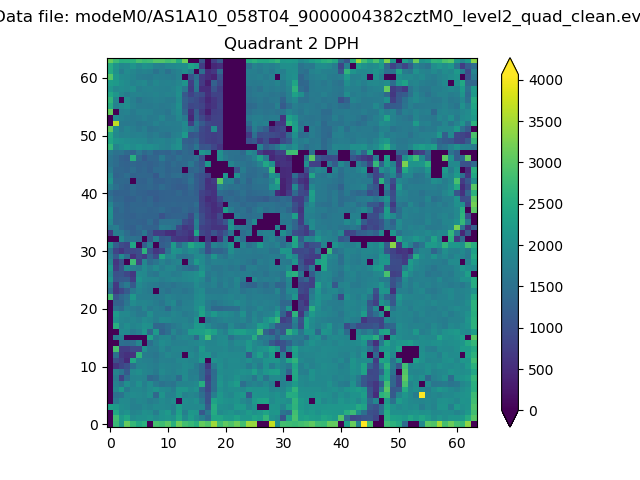 |
Quadrant C |
| Plot type | Count rate plots | Images |
|---|---|---|
| Comparison with Poisson distribution Blue bars denote a histogram of data divided into 1 sec bins. Red curve is a Poisson curve with rate = median count rate of data. |
 |
 |
| Quadrant-wise count rates Data is divided into 100 sec bins |
 |
|
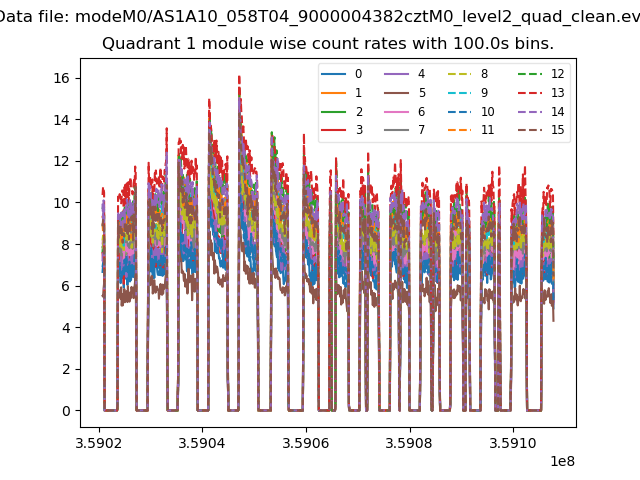
| Module-wise count rates for Quadrant A Data is divided into 100 sec bins |
 |
 |
| Module-wise count rates for Quadrant B Data is divided into 100 sec bins |
 |
 |
| Module-wise count rates for Quadrant C Data is divided into 100 sec bins |
 |
 |
| Module-wise count rates for Quadrant D Data is divided into 100 sec bins |
 |
 |
| Parameter | Plot |
|---|---|
| CZT HV Monitor |  |
| D_VDD | 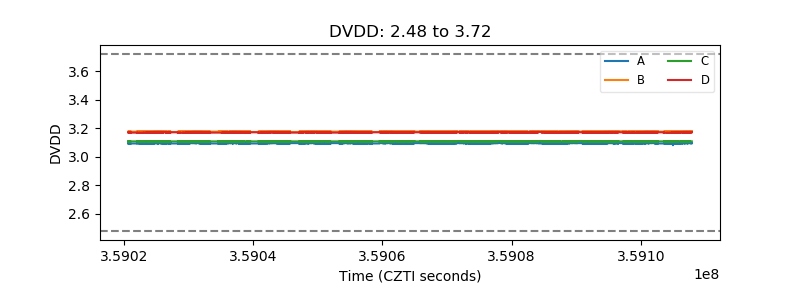 |
| Temperature 1 |  |
| Veto HV Monitor |  |
| Veto LLD | 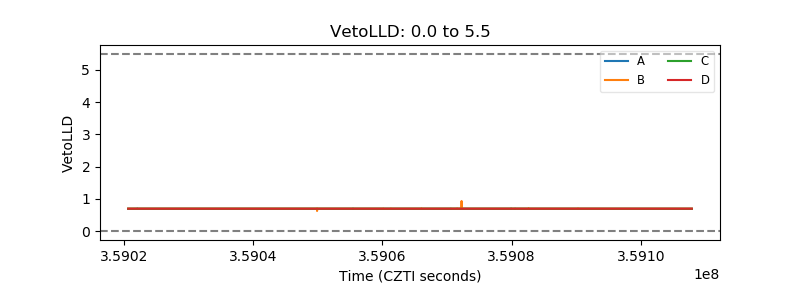 |
| Alpha Counter |  |
| _CPM_Rate |  |
| CZT Counter |  |
| +2.5 Volts monitor |  |
| +5 Volts monitor |  |
| _ROLL_ROT |  |
| _Roll_DEC |  |
| _Roll_RA |  |
| Veto Counter |  |