| Param | Original file | Final file |
|---|---|---|
| Filename | modeM0/AS1A10_058T04_9000004382_30479cztM0_level2.evt | modeM0/AS1A10_058T04_9000004382_30479cztM0_level2_quad_clean.evt |
| Size (bytes) | 177,151,680 | 11,269,440 |
| Size | 168.9 MB | 10.7 MB |
| Events in quadrant A | 973,585 | 53,813 |
| Events in quadrant B | 1,514,723 | 53,372 |
| Events in quadrant C | 1,354,648 | 50,253 |
| Events in quadrant D | 1,393,400 | 47,020 |
| Mode SS | |||
|---|---|---|---|
| Quadrant | BADHDUFLAG | Total packets | Discarded packets |
| A | 0 | 40 | 0 |
| B | 0 | 40 | 0 |
| C | 0 | 40 | 0 |
| D | 0 | 40 | 0 |
| Mode M9 | |||
|---|---|---|---|
| Quadrant | BADHDUFLAG | Total packets | Discarded packets |
| A | 0 | 9 | 0 |
| B | 0 | 9 | 0 |
| C | 0 | 9 | 0 |
| D | 0 | 9 | 0 |
| Mode M0 | |||
|---|---|---|---|
| Quadrant | BADHDUFLAG | Total packets | Discarded packets |
| A | 0 | 3944 | 1 |
| B | 0 | 5683 | 1 |
| C | 0 | 5450 | 1 |
| D | 0 | 5425 | 1 |
| Quadrant | Total seconds | Saturated seconds | Saturation percentage |
|---|---|---|---|
| A | 1860 | 29 | 1.559140% |
| B | 1860 | 58 | 3.118280% |
| C | 1860 | 112 | 6.021505% |
| D | 1860 | 121 | 6.505376% |
Noise dominated data is calculated using 1-second bins in cleaned event files. If a bin has >2000 counts, and if more than 50% of those come from <1% of pixels, then it is considered to be noise-dominated and hence unusable.
| Quadrant | # 1 sec bins | Bins with >0 counts | Bins with >2000 counts | High rate bins dominated by noise | Noise dominated (total time) | Noise dominated (detector-on time) | Marked lightcurve |
|---|---|---|---|---|---|---|---|
| A | 2805 | 1860 | 0 | 0 | 0.00% | 0.00% | 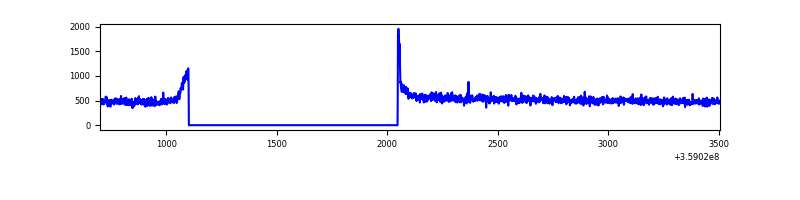 |
| B | 2805 | 1860 | 0 | 0 | 0.00% | 0.00% | 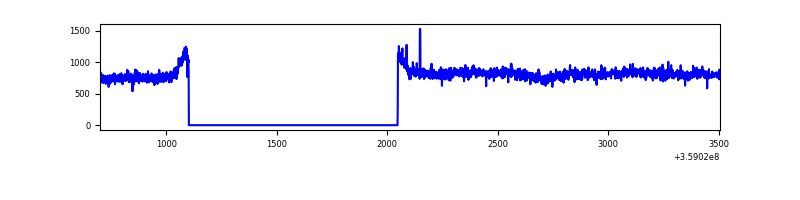 |
| C | 2805 | 1860 | 13 | 13 | 0.46% | 0.70% | 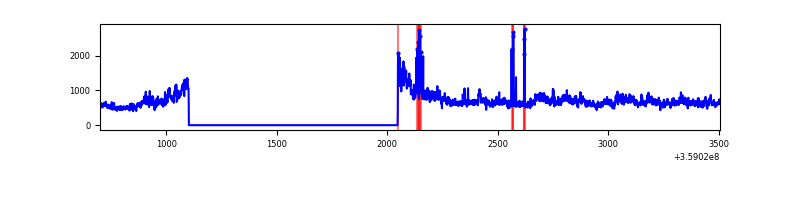 |
| D | 2805 | 1860 | 106 | 106 | 3.78% | 5.70% | 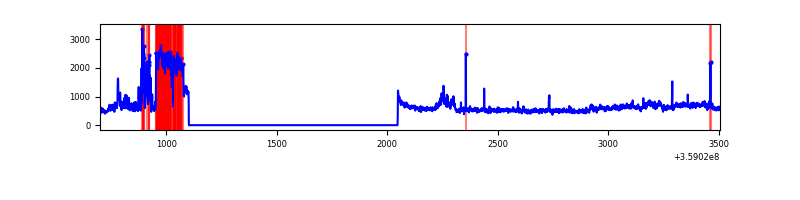 |
Top three noisy pixels from each quadrant. If the there are fewer than three noisy pixels in the level2.evt file, extra rows are filled as -1
| Pixel properties | Quadrant properties | ||||||
|---|---|---|---|---|---|---|---|
| Quadrant | DetID | PixID | Counts | Sigma | Mean | Median | Sigma |
| A | 8 | 192 | 10263 | 194.72 | 249 | 244 | 51.5 |
| A | 13 | 254 | 3114 | 55.78 | 249 | 244 | 51.5 |
| A | 3 | 137 | 2382 | 41.55 | 249 | 244 | 51.5 |
| B | 6 | 159 | 520579 | 10510.3 | 248 | 241 | 49.5 |
| B | 0 | 229 | 11772 | 232.91 | 248 | 241 | 49.5 |
| B | 12 | 111 | 6038 | 117.09 | 248 | 241 | 49.5 |
| C | 3 | 233 | 334535 | 5719.19 | 239 | 240 | 58.5 |
| C | 0 | 10 | 42393 | 721.16 | 239 | 240 | 58.5 |
| C | 14 | 238 | 38783 | 659.4 | 239 | 240 | 58.5 |
| D | 7 | 238 | 207460 | 3599.09 | 238 | 232 | 57.6 |
| D | 12 | 218 | 100569 | 1742.63 | 238 | 232 | 57.6 |
| D | 12 | 227 | 63321 | 1095.71 | 238 | 232 | 57.6 |
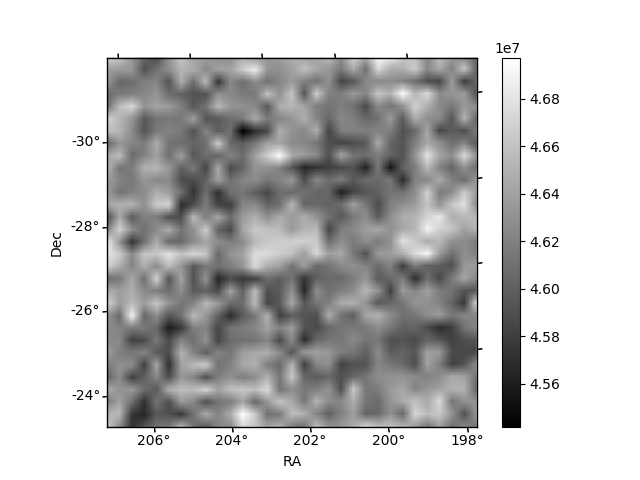
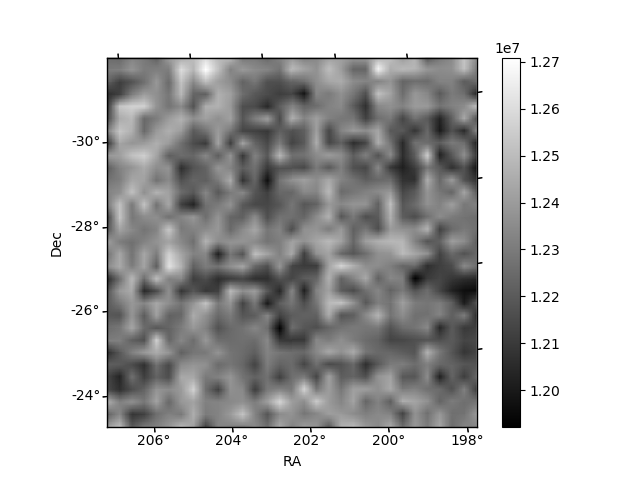
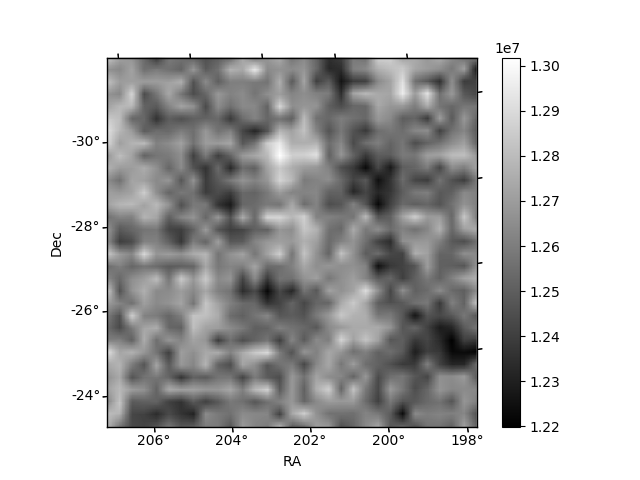
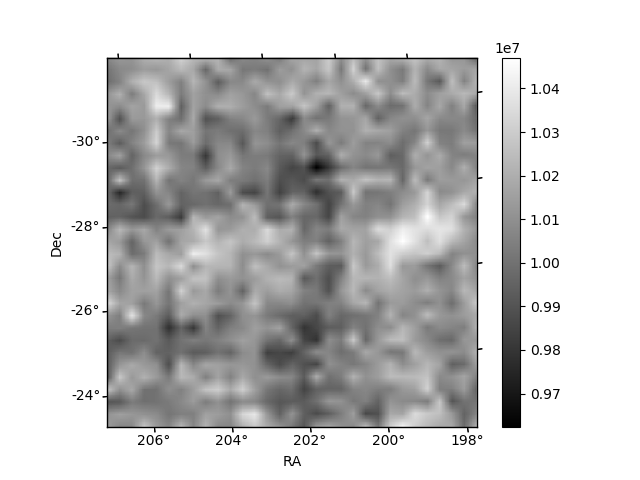
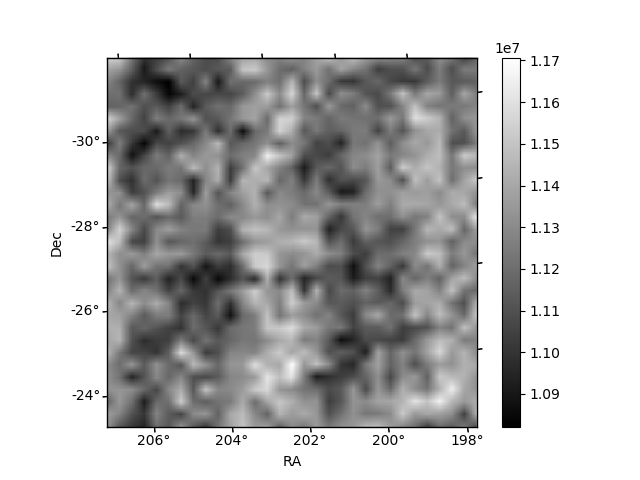
Histogram calculated using DETX and DETY for each event in the final _common_clean file
| Quadrant A | 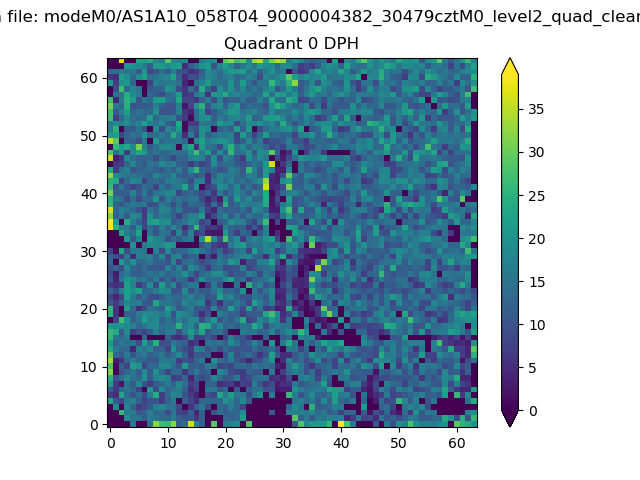 |
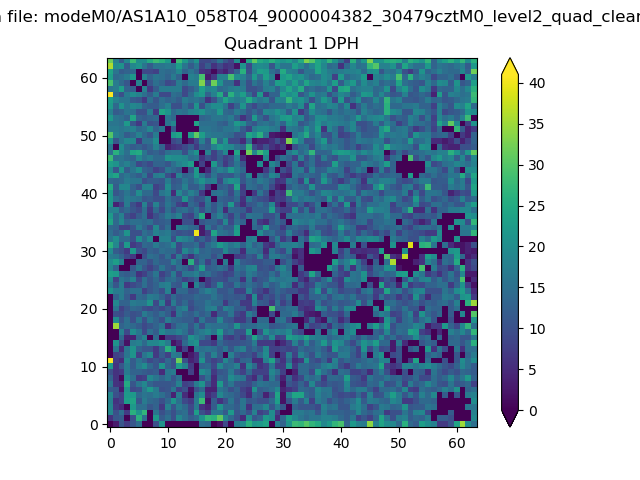 |
Quadrant B |
|---|---|---|---|
| Quadrant D | 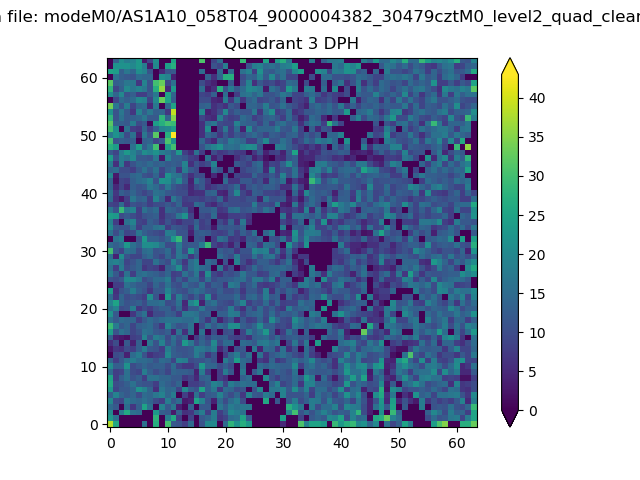 |
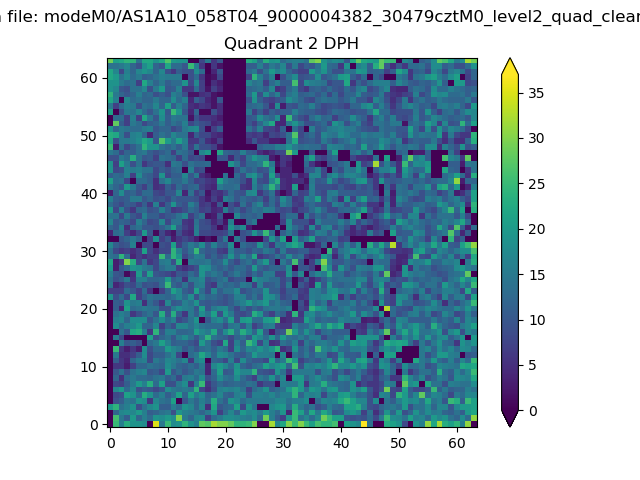 |
Quadrant C |
| Plot type | Count rate plots | Images |
|---|---|---|
| Comparison with Poisson distribution Blue bars denote a histogram of data divided into 1 sec bins. Red curve is a Poisson curve with rate = median count rate of data. |
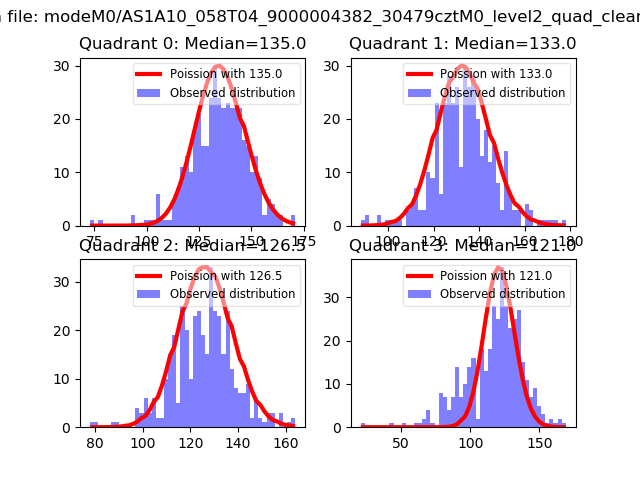 |
 |
| Quadrant-wise count rates Data is divided into 100 sec bins |
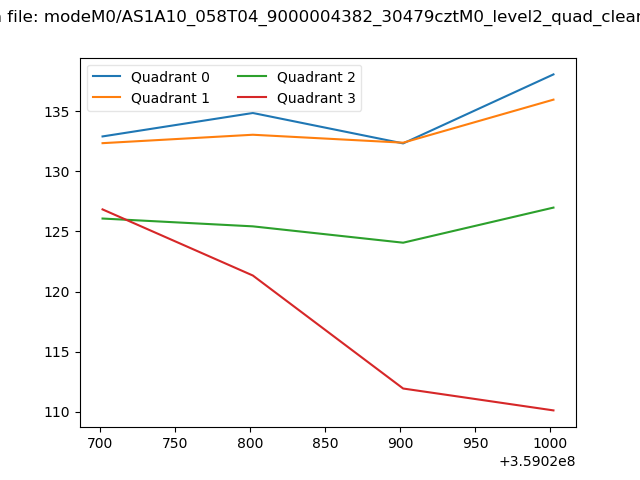 |
|
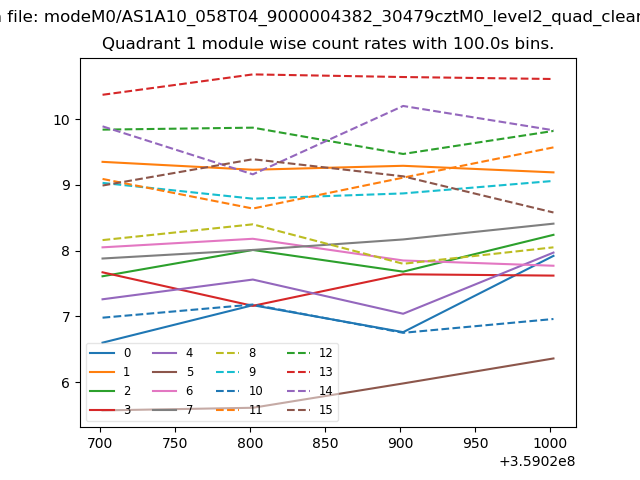
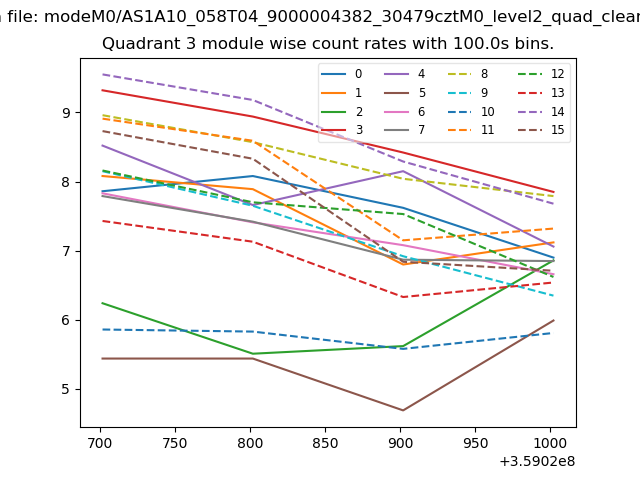
| Module-wise count rates for Quadrant A Data is divided into 100 sec bins |
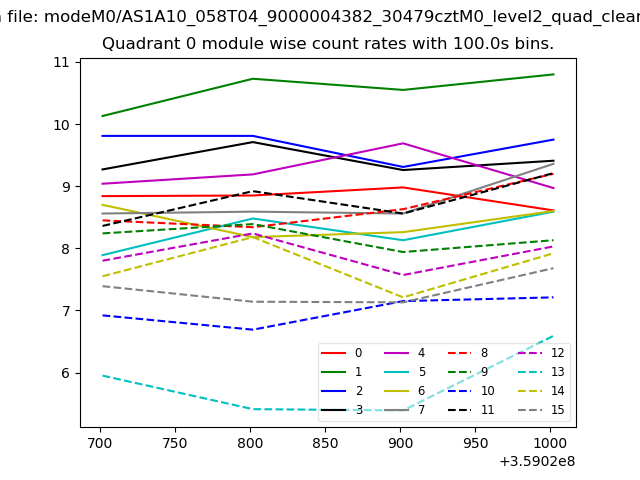 |
 |
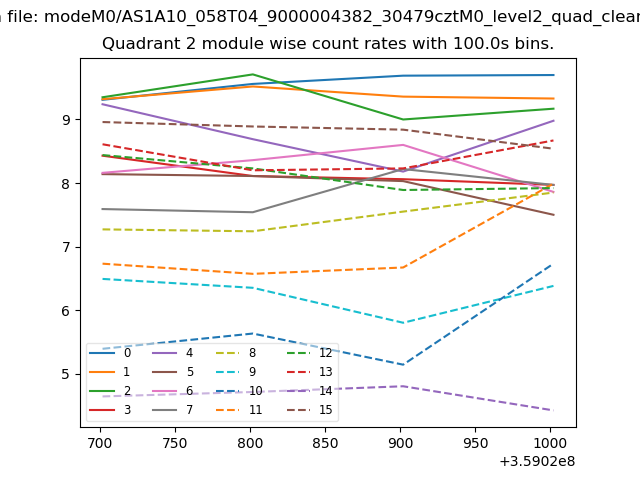
| Module-wise count rates for Quadrant B Data is divided into 100 sec bins |
 |
 |
| Module-wise count rates for Quadrant C Data is divided into 100 sec bins |
 |
 |
| Module-wise count rates for Quadrant D Data is divided into 100 sec bins |
 |
 |
| Parameter | Plot |
|---|---|
| CZT HV Monitor | 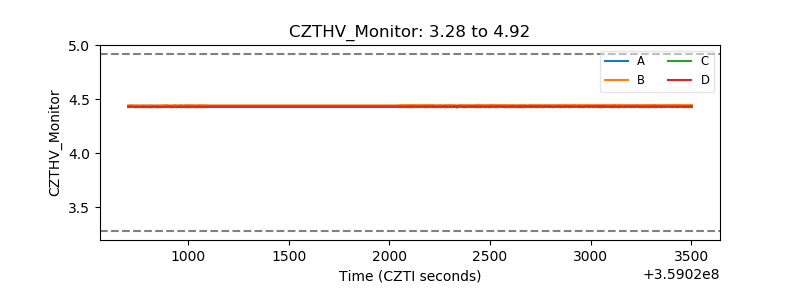 |
| D_VDD | 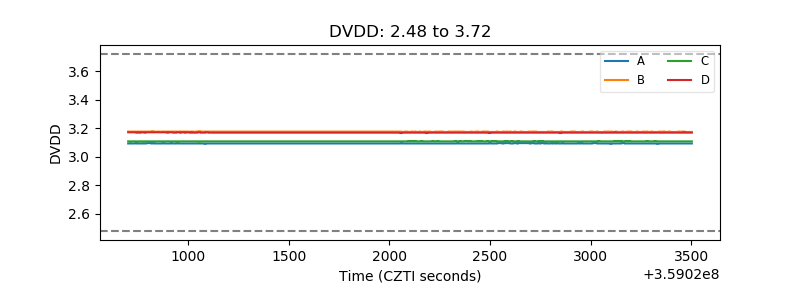 |
| Temperature 1 | 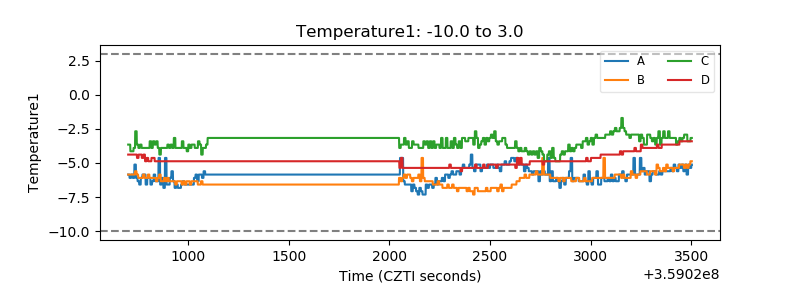 |
| Veto HV Monitor |  |
| Veto LLD | 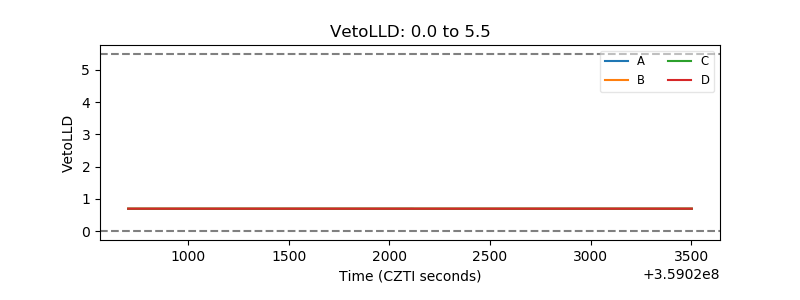 |
| Alpha Counter | 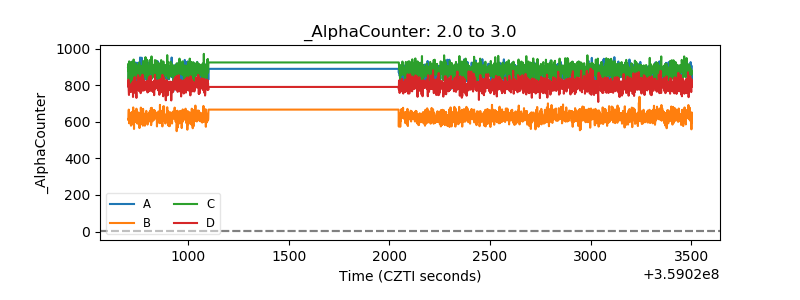 |
| _CPM_Rate | 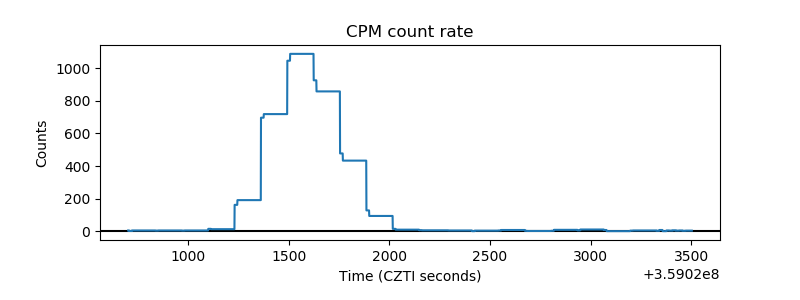 |
| CZT Counter | 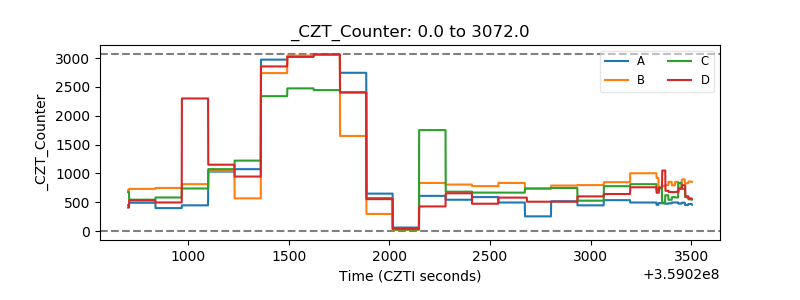 |
| +2.5 Volts monitor | 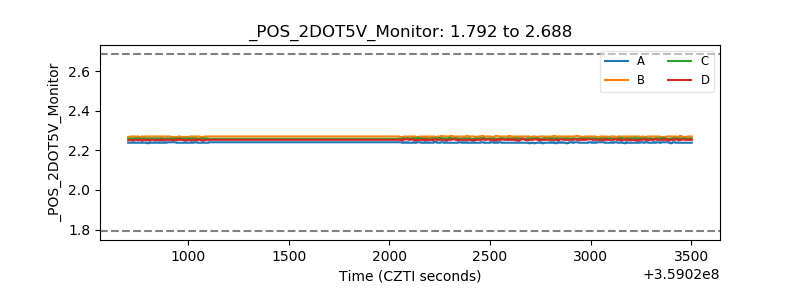 |
| +5 Volts monitor |  |
| _ROLL_ROT | 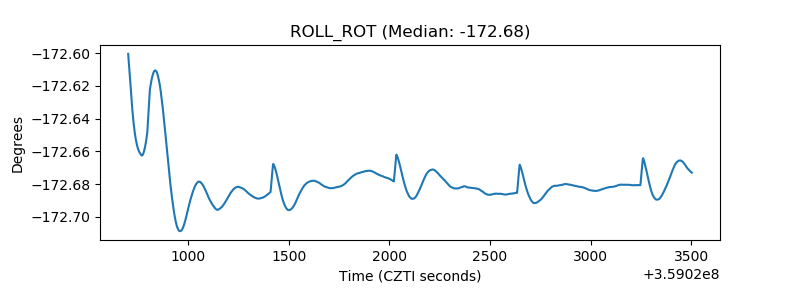 |
| _Roll_DEC | 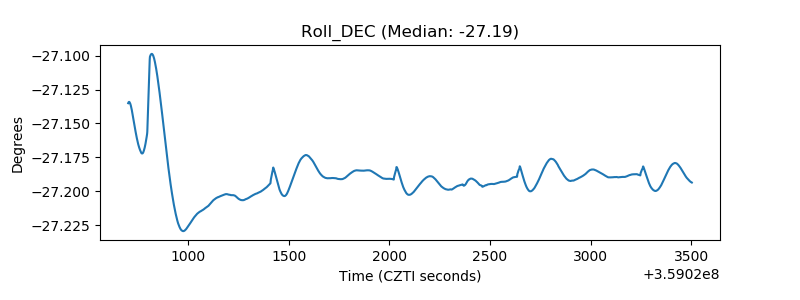 |
| _Roll_RA | 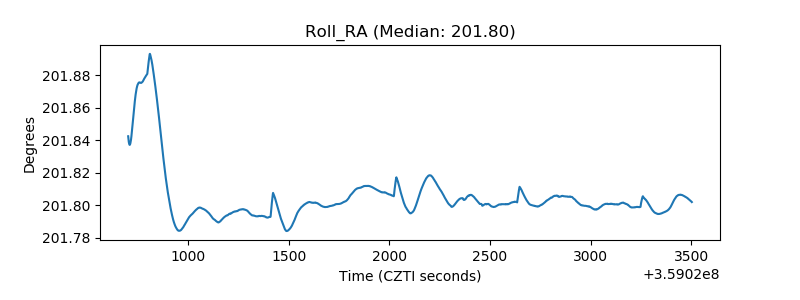 |
| Veto Counter | 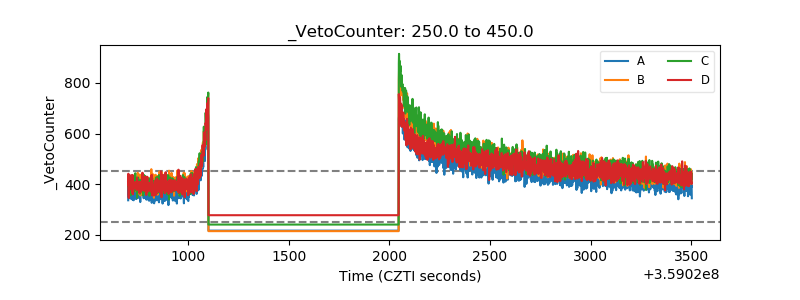 |