| Param | Original file | Final file |
|---|---|---|
| Filename | modeM0/AS1A10_058T04_9000004382_30485cztM0_level2.evt | modeM0/AS1A10_058T04_9000004382_30485cztM0_level2_quad_clean.evt |
| Size (bytes) | 593,781,120 | 124,980,480 |
| Size | 566.3 MB | 119.2 MB |
| Events in quadrant A | 3,635,421 | 869,823 |
| Events in quadrant B | 5,530,452 | 857,411 |
| Events in quadrant C | 3,714,051 | 803,103 |
| Events in quadrant D | 4,655,163 | 793,649 |
| Mode SS | |||
|---|---|---|---|
| Quadrant | BADHDUFLAG | Total packets | Discarded packets |
| A | 0 | 134 | 0 |
| B | 0 | 134 | 0 |
| C | 0 | 134 | 0 |
| D | 0 | 134 | 0 |
| Mode M9 | |||
|---|---|---|---|
| Quadrant | BADHDUFLAG | Total packets | Discarded packets |
| A | 0 | 13 | 0 |
| B | 0 | 13 | 0 |
| C | 0 | 13 | 0 |
| D | 0 | 13 | 0 |
| Mode M0 | |||
|---|---|---|---|
| Quadrant | BADHDUFLAG | Total packets | Discarded packets |
| A | 0 | 15019 | 2 |
| B | 0 | 20857 | 2 |
| C | 0 | 15239 | 2 |
| D | 0 | 18232 | 2 |
| Quadrant | Total seconds | Saturated seconds | Saturation percentage |
|---|---|---|---|
| A | 6621 | 95 | 1.434829% |
| B | 6621 | 190 | 2.869657% |
| C | 6621 | 129 | 1.948346% |
| D | 6621 | 172 | 2.597795% |
Noise dominated data is calculated using 1-second bins in cleaned event files. If a bin has >2000 counts, and if more than 50% of those come from <1% of pixels, then it is considered to be noise-dominated and hence unusable.
| Quadrant | # 1 sec bins | Bins with >0 counts | Bins with >2000 counts | High rate bins dominated by noise | Noise dominated (total time) | Noise dominated (detector-on time) | Marked lightcurve |
|---|---|---|---|---|---|---|---|
| A | 7906 | 6622 | 5 | 5 | 0.06% | 0.08% | 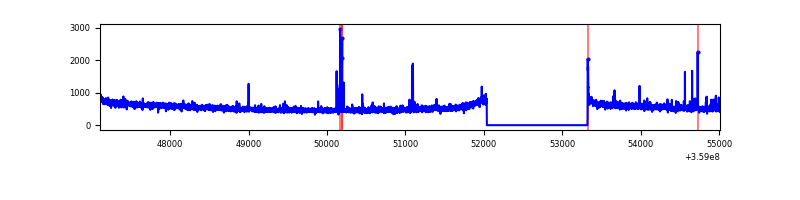 |
| B | 7906 | 6622 | 28 | 28 | 0.35% | 0.42% | 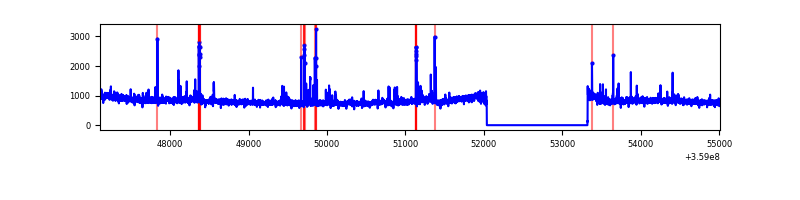 |
| C | 7906 | 6622 | 8 | 8 | 0.10% | 0.12% | 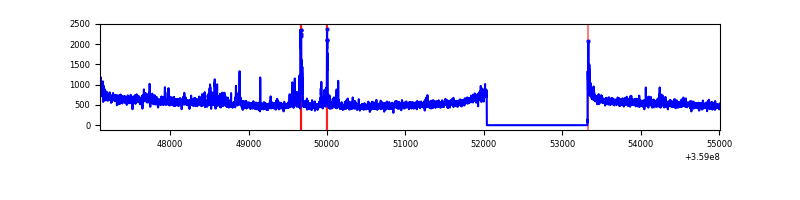 |
| D | 7906 | 6622 | 131 | 131 | 1.66% | 1.98% | 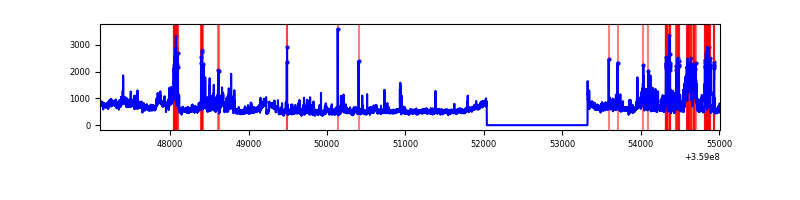 |
Top three noisy pixels from each quadrant. If the there are fewer than three noisy pixels in the level2.evt file, extra rows are filled as -1
| Pixel properties | Quadrant properties | ||||||
|---|---|---|---|---|---|---|---|
| Quadrant | DetID | PixID | Counts | Sigma | Mean | Median | Sigma |
| A | 0 | 13 | 39917 | 215.52 | 919 | 906 | 181.0 |
| A | 12 | 96 | 27276 | 145.68 | 919 | 906 | 181.0 |
| A | 4 | 2 | 16514 | 86.23 | 919 | 906 | 181.0 |
| B | 6 | 159 | 1786366 | 10806.95 | 889 | 871 | 165.2 |
| B | 0 | 229 | 142191 | 855.36 | 889 | 871 | 165.2 |
| B | 4 | 171 | 43962 | 260.81 | 889 | 871 | 165.2 |
| C | 3 | 233 | 216500 | 1113.81 | 846 | 854 | 193.6 |
| C | 14 | 238 | 139832 | 717.82 | 846 | 854 | 193.6 |
| C | 10 | 22 | 29468 | 147.79 | 846 | 854 | 193.6 |
| D | 8 | 195 | 295726 | 1465.34 | 870 | 853 | 201.2 |
| D | 12 | 218 | 295330 | 1463.37 | 870 | 853 | 201.2 |
| D | 12 | 233 | 284571 | 1409.9 | 870 | 853 | 201.2 |
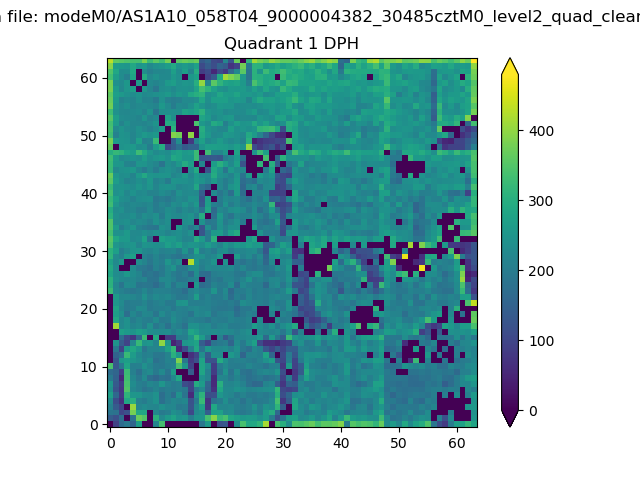
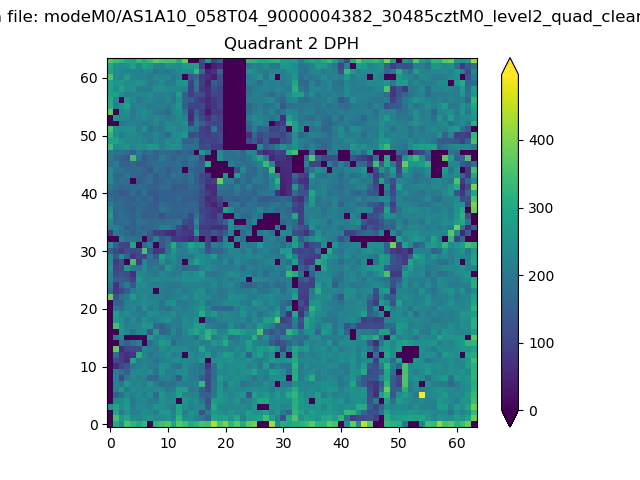
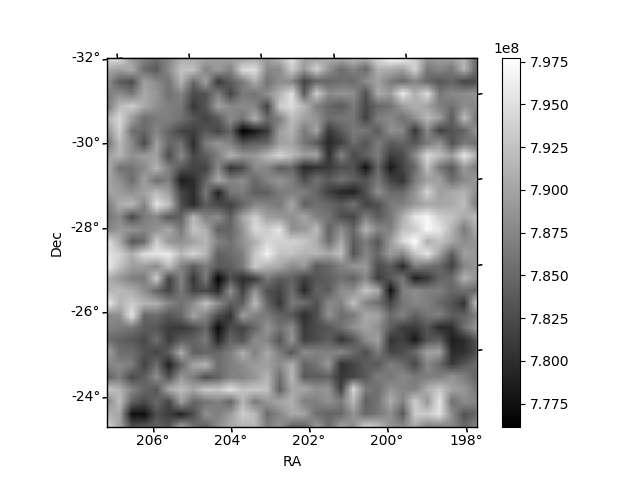
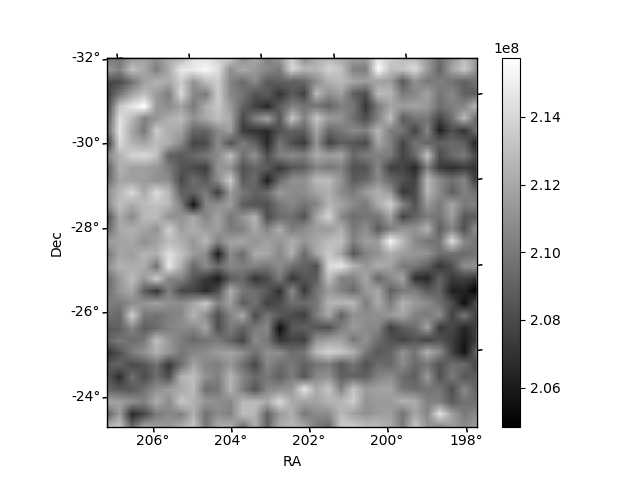
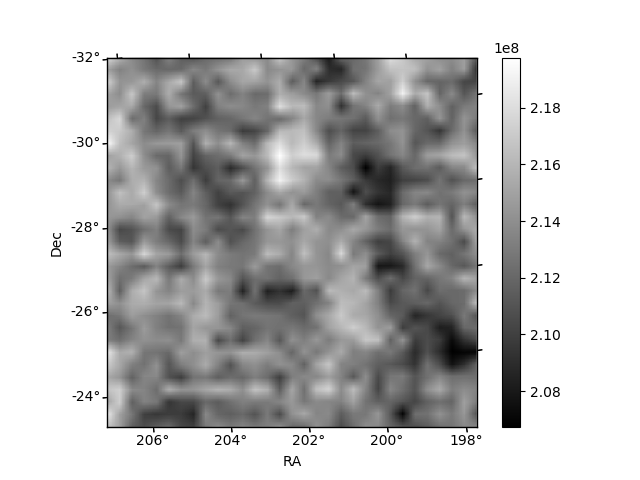
Histogram calculated using DETX and DETY for each event in the final _common_clean file
| Quadrant A |  |
 |
Quadrant B |
|---|---|---|---|
| Quadrant D | 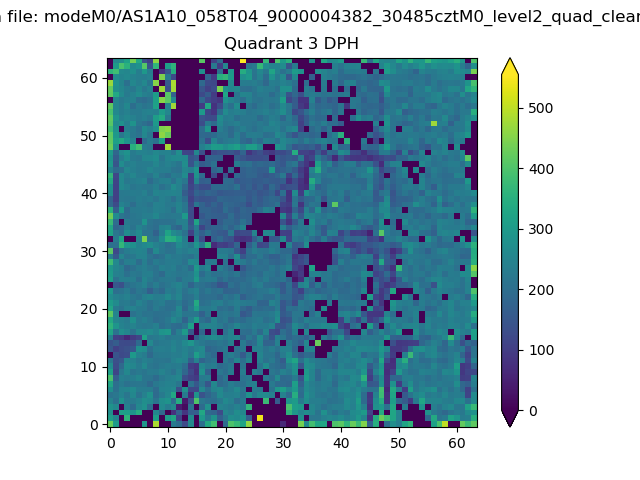 |
 |
Quadrant C |
| Plot type | Count rate plots | Images |
|---|---|---|
| Comparison with Poisson distribution Blue bars denote a histogram of data divided into 1 sec bins. Red curve is a Poisson curve with rate = median count rate of data. |
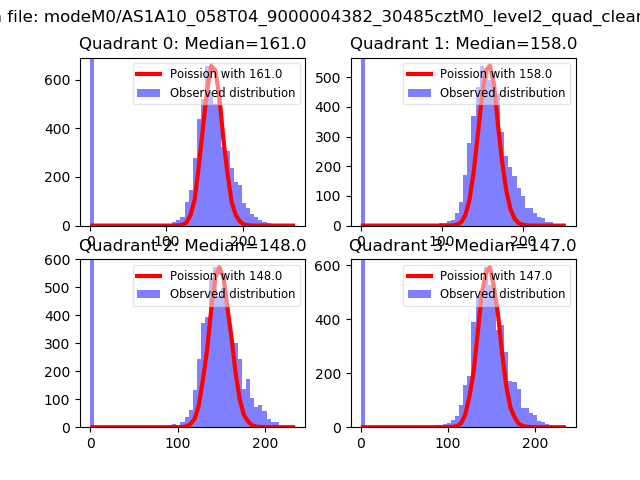 |
 |
| Quadrant-wise count rates Data is divided into 100 sec bins |
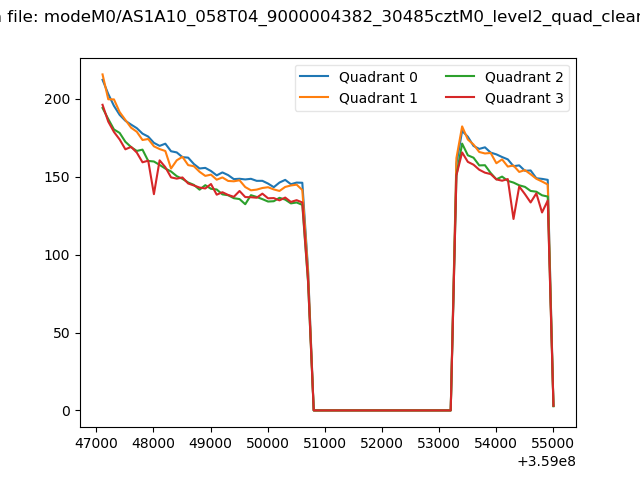 |
|
| Module-wise count rates for Quadrant A Data is divided into 100 sec bins |
 |
 |
| Module-wise count rates for Quadrant B Data is divided into 100 sec bins |
 |
 |
| Module-wise count rates for Quadrant C Data is divided into 100 sec bins |
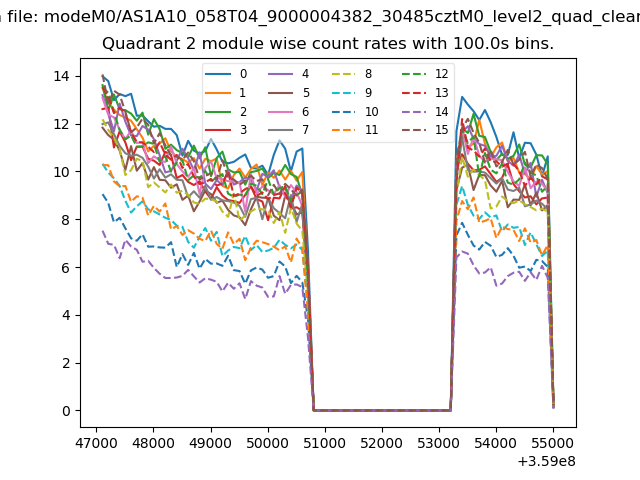 |
 |
| Module-wise count rates for Quadrant D Data is divided into 100 sec bins |
 |
 |
| Parameter | Plot |
|---|---|
| CZT HV Monitor | 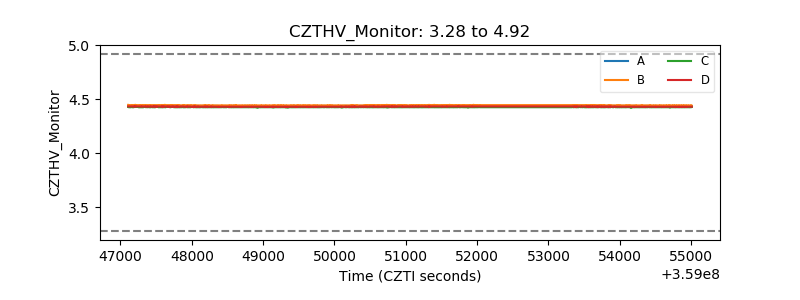 |
| D_VDD | 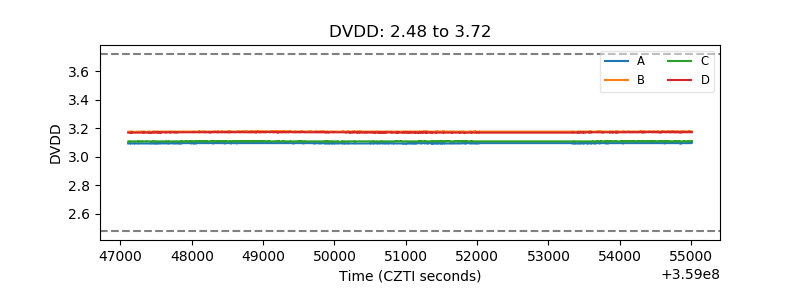 |
| Temperature 1 | 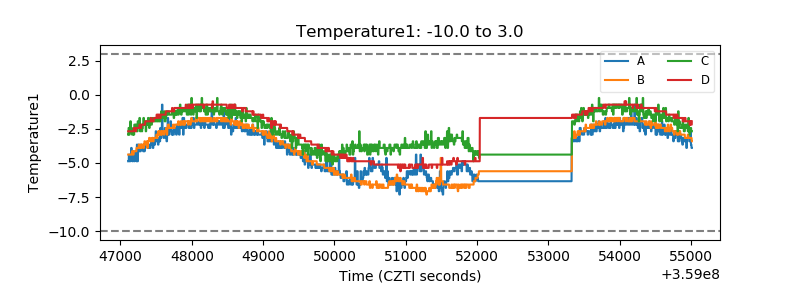 |
| Veto HV Monitor | 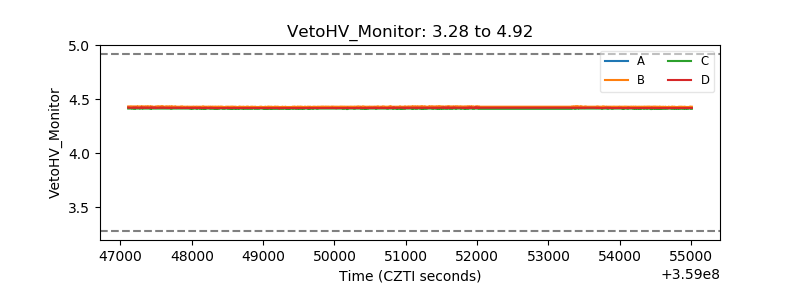 |
| Veto LLD | 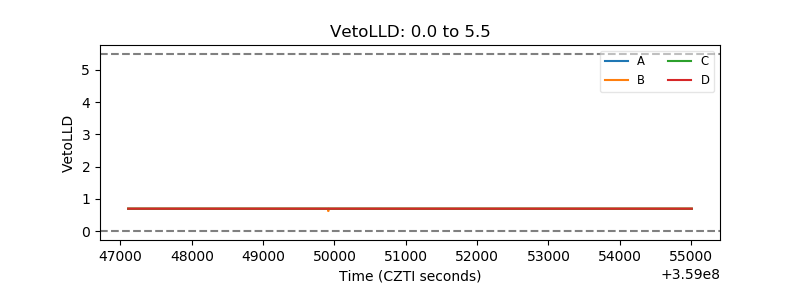 |
| Alpha Counter | 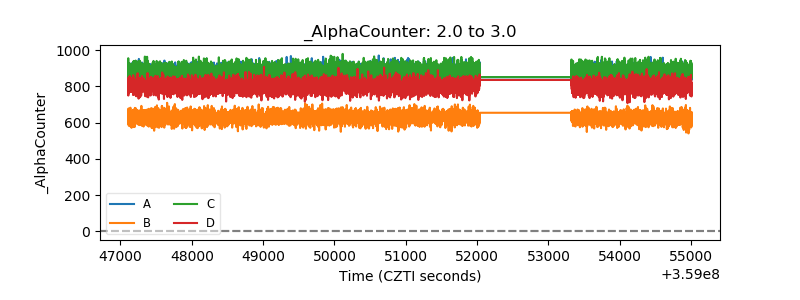 |
| _CPM_Rate | 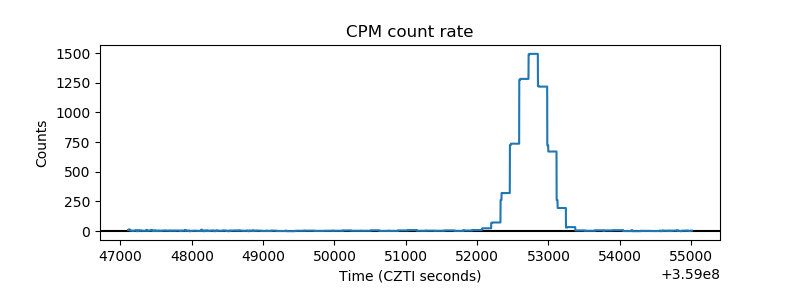 |
| CZT Counter | 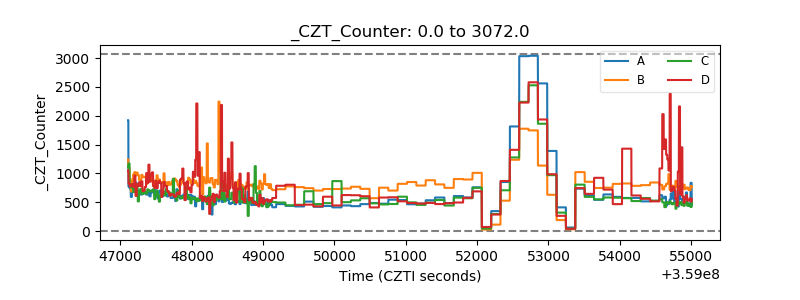 |
| +2.5 Volts monitor | 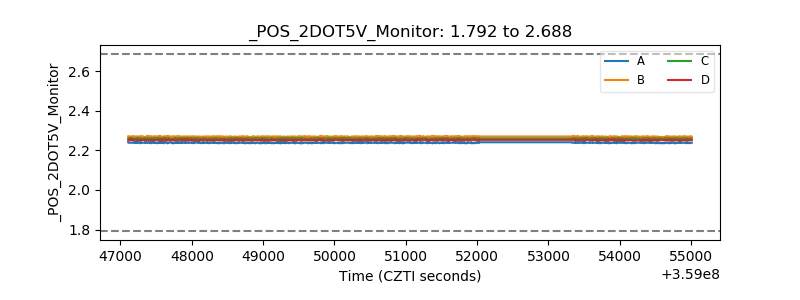 |
| +5 Volts monitor |  |
| _ROLL_ROT |  |
| _Roll_DEC |  |
| _Roll_RA | 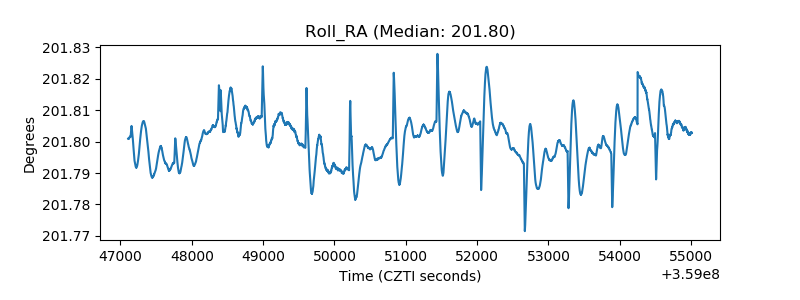 |
| Veto Counter | 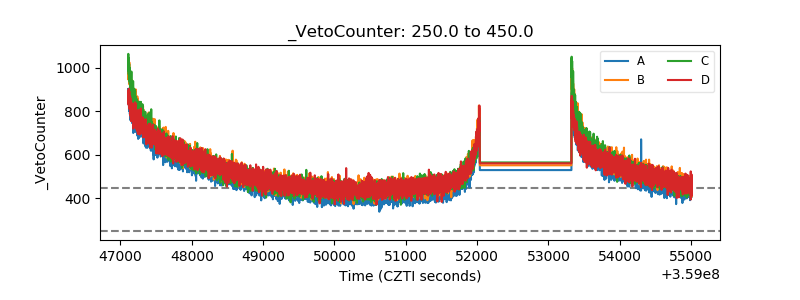 |