| Param | Original file | Final file |
|---|---|---|
| Filename | modeM0/AS1A10_058T04_9000004382_30488cztM0_level2.evt | modeM0/AS1A10_058T04_9000004382_30488cztM0_level2_quad_clean.evt |
| Size (bytes) | 656,098,560 | 108,518,400 |
| Size | 625.7 MB | 103.5 MB |
| Events in quadrant A | 3,724,963 | 720,236 |
| Events in quadrant B | 6,066,228 | 711,380 |
| Events in quadrant C | 4,660,697 | 670,934 |
| Events in quadrant D | 4,912,897 | 663,808 |
| Mode SS | |||
|---|---|---|---|
| Quadrant | BADHDUFLAG | Total packets | Discarded packets |
| A | 0 | 154 | 0 |
| B | 0 | 154 | 0 |
| C | 0 | 154 | 0 |
| D | 0 | 154 | 0 |
| Mode M9 | |||
|---|---|---|---|
| Quadrant | BADHDUFLAG | Total packets | Discarded packets |
| A | 0 | 12 | 0 |
| B | 0 | 12 | 0 |
| C | 0 | 12 | 0 |
| D | 0 | 12 | 0 |
| Mode M0 | |||
|---|---|---|---|
| Quadrant | BADHDUFLAG | Total packets | Discarded packets |
| A | 0 | 15937 | 2 |
| B | 0 | 23265 | 2 |
| C | 0 | 18871 | 2 |
| D | 0 | 19698 | 2 |
| Quadrant | Total seconds | Saturated seconds | Saturation percentage |
|---|---|---|---|
| A | 7469 | 111 | 1.486143% |
| B | 7470 | 267 | 3.574297% |
| C | 7470 | 293 | 3.922356% |
| D | 7470 | 220 | 2.945114% |
Noise dominated data is calculated using 1-second bins in cleaned event files. If a bin has >2000 counts, and if more than 50% of those come from <1% of pixels, then it is considered to be noise-dominated and hence unusable.
| Quadrant | # 1 sec bins | Bins with >0 counts | Bins with >2000 counts | High rate bins dominated by noise | Noise dominated (total time) | Noise dominated (detector-on time) | Marked lightcurve |
|---|---|---|---|---|---|---|---|
| A | 8669 | 7471 | 11 | 11 | 0.13% | 0.15% | 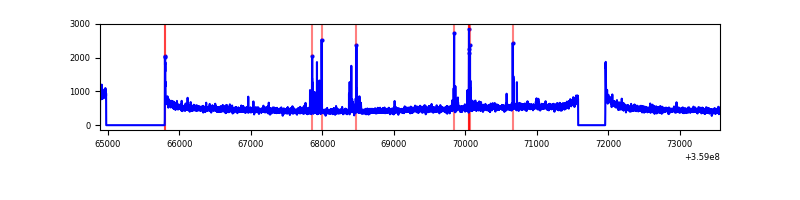 |
| B | 8670 | 7472 | 41 | 41 | 0.47% | 0.55% | 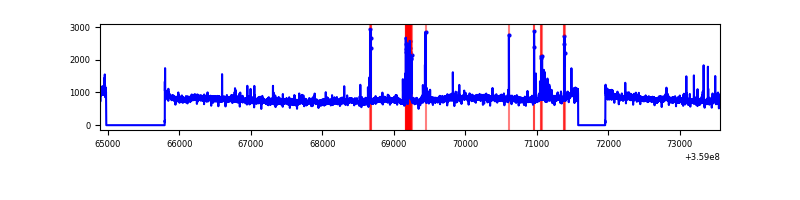 |
| C | 8670 | 7472 | 41 | 41 | 0.47% | 0.55% | 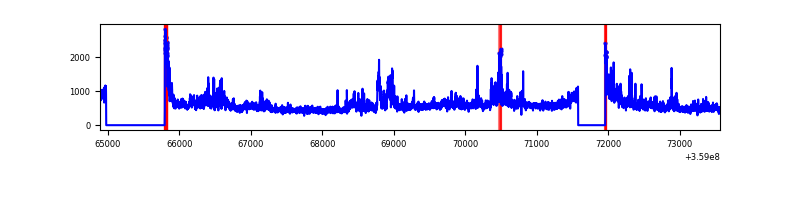 |
| D | 8670 | 7472 | 142 | 142 | 1.64% | 1.90% | 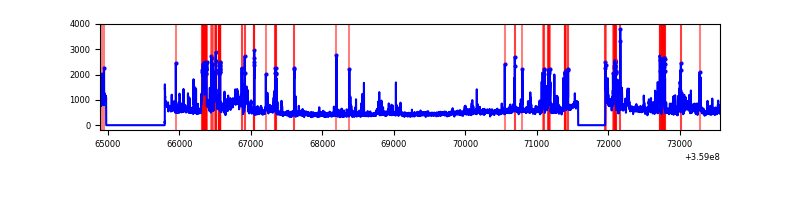 |
Top three noisy pixels from each quadrant. If the there are fewer than three noisy pixels in the level2.evt file, extra rows are filled as -1
| Pixel properties | Quadrant properties | ||||||
|---|---|---|---|---|---|---|---|
| Quadrant | DetID | PixID | Counts | Sigma | Mean | Median | Sigma |
| A | 0 | 13 | 78014 | 407.17 | 932 | 914 | 189.4 |
| A | 4 | 2 | 23083 | 117.08 | 932 | 914 | 189.4 |
| A | 8 | 192 | 22227 | 112.56 | 932 | 914 | 189.4 |
| B | 6 | 159 | 2174596 | 12286.04 | 916 | 892 | 176.9 |
| B | 0 | 229 | 233936 | 1317.19 | 916 | 892 | 176.9 |
| B | 12 | 111 | 21783 | 118.08 | 916 | 892 | 176.9 |
| C | 3 | 233 | 950950 | 4667.08 | 872 | 877 | 203.6 |
| C | 14 | 238 | 138926 | 678.14 | 872 | 877 | 203.6 |
| C | 0 | 10 | 102301 | 498.23 | 872 | 877 | 203.6 |
| D | 12 | 218 | 596130 | 2794.2 | 888 | 863 | 213.0 |
| D | 8 | 195 | 360604 | 1688.63 | 888 | 863 | 213.0 |
| D | 1 | 52 | 118425 | 551.84 | 888 | 863 | 213.0 |
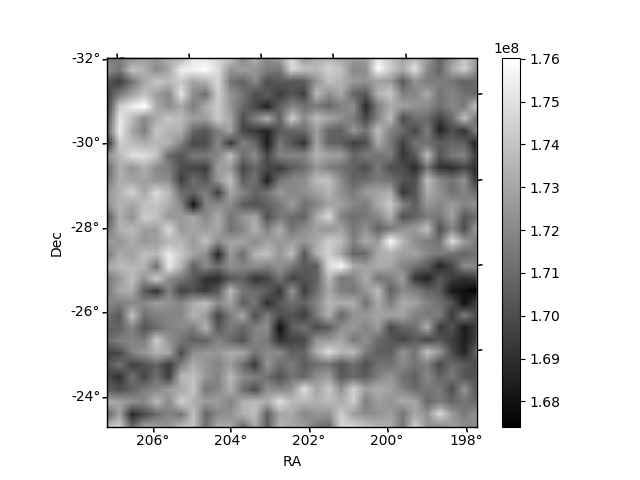
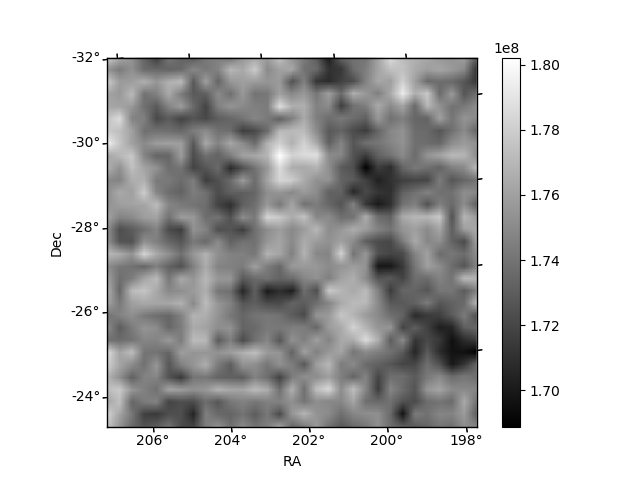
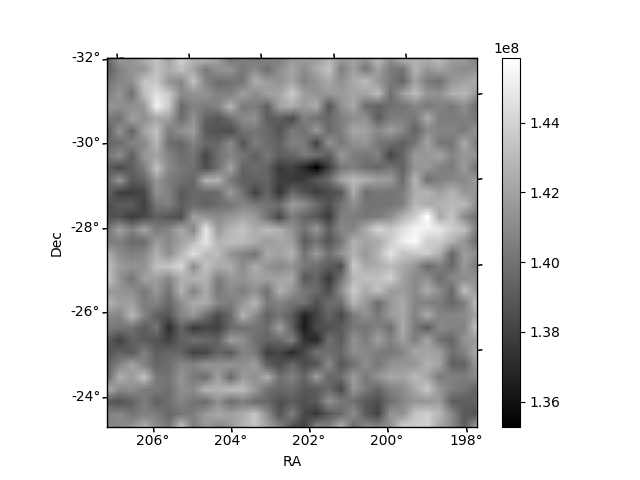
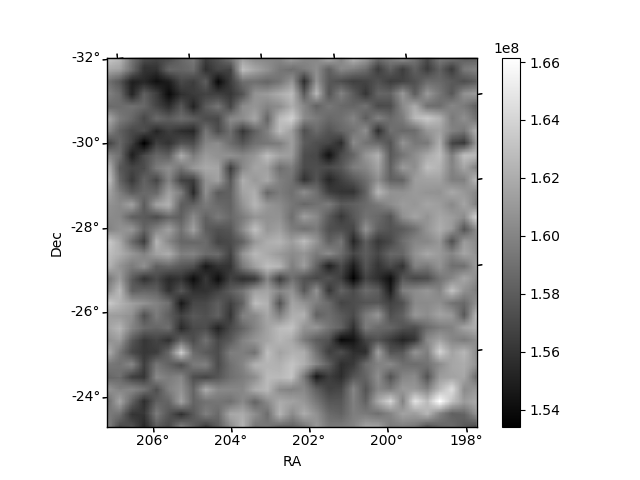
Histogram calculated using DETX and DETY for each event in the final _common_clean file
| Quadrant A | 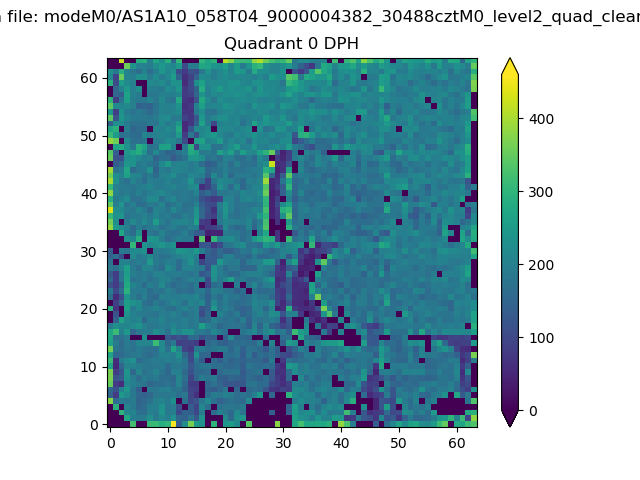 |
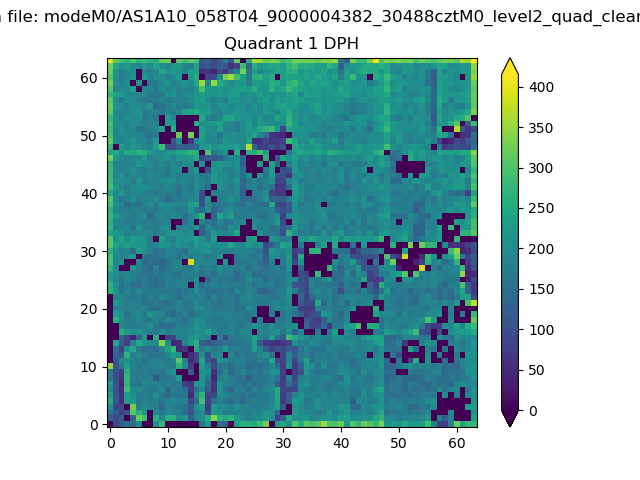 |
Quadrant B |
|---|---|---|---|
| Quadrant D | 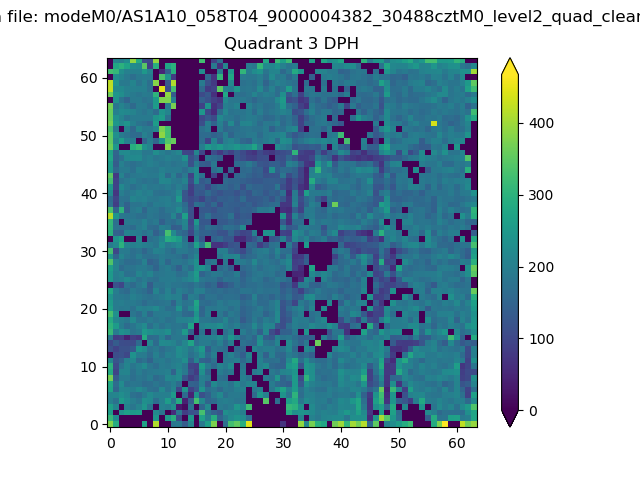 |
 |
Quadrant C |
| Plot type | Count rate plots | Images |
|---|---|---|
| Comparison with Poisson distribution Blue bars denote a histogram of data divided into 1 sec bins. Red curve is a Poisson curve with rate = median count rate of data. |
 |
 |
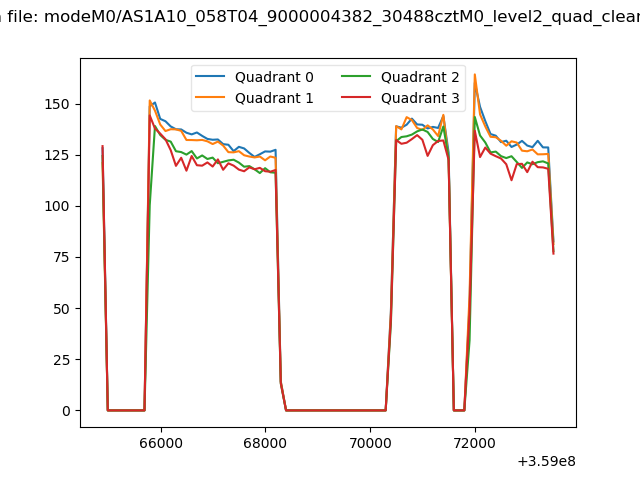
| Quadrant-wise count rates Data is divided into 100 sec bins |
 |
|
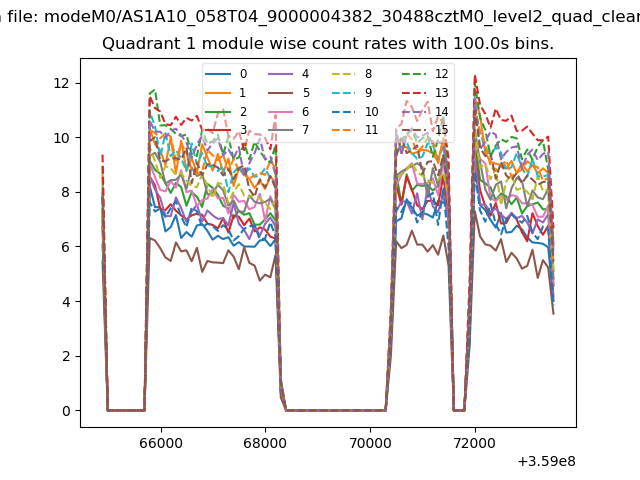
| Module-wise count rates for Quadrant A Data is divided into 100 sec bins |
 |
 |
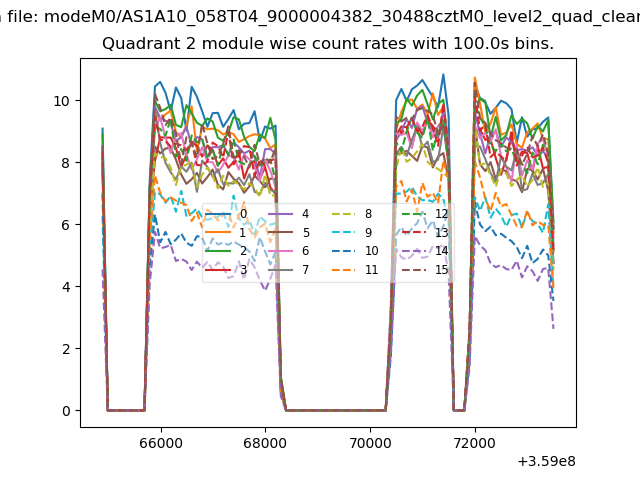
| Module-wise count rates for Quadrant B Data is divided into 100 sec bins |
 |
 |
| Module-wise count rates for Quadrant C Data is divided into 100 sec bins |
 |
 |
| Module-wise count rates for Quadrant D Data is divided into 100 sec bins |
 |
 |
| Parameter | Plot |
|---|---|
| CZT HV Monitor | 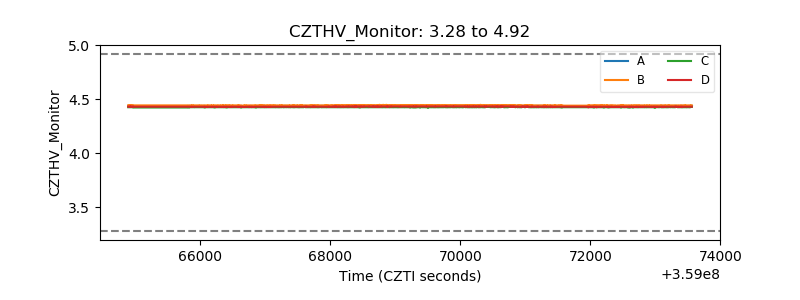 |
| D_VDD | 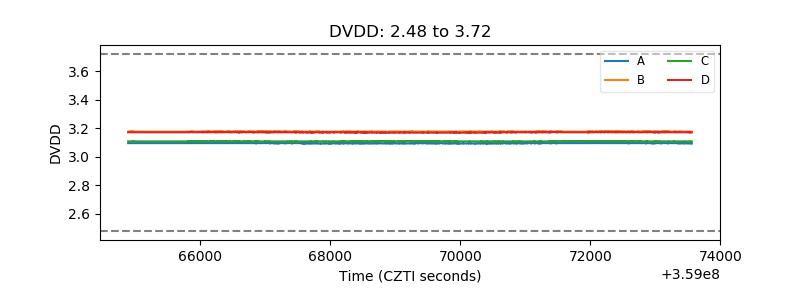 |
| Temperature 1 | 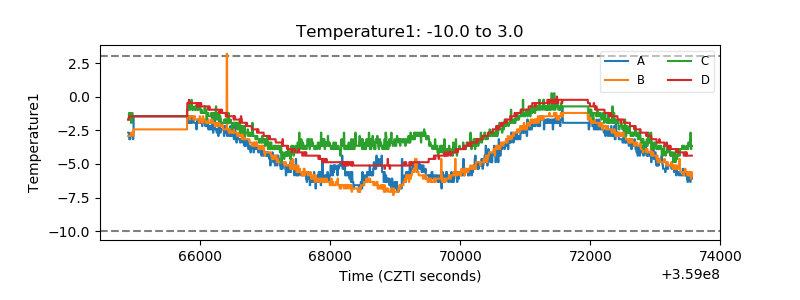 |
| Veto HV Monitor | 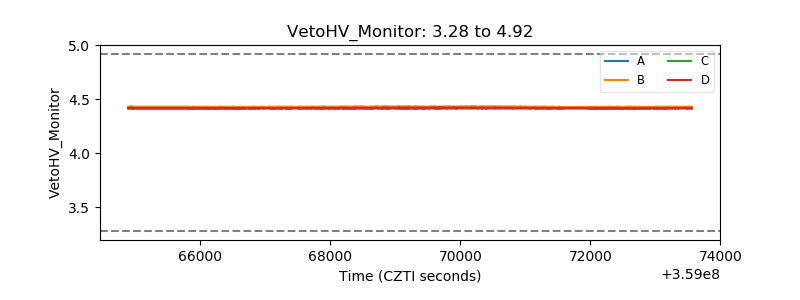 |
| Veto LLD | 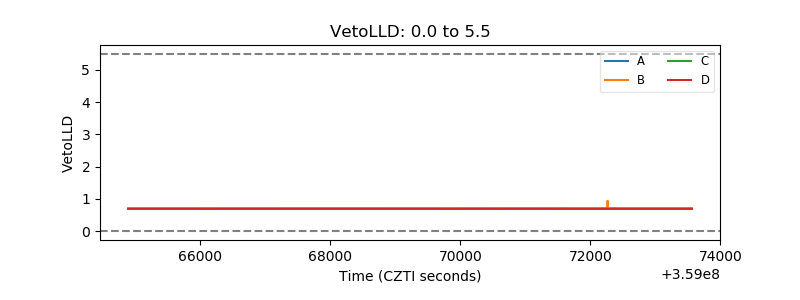 |
| Alpha Counter | 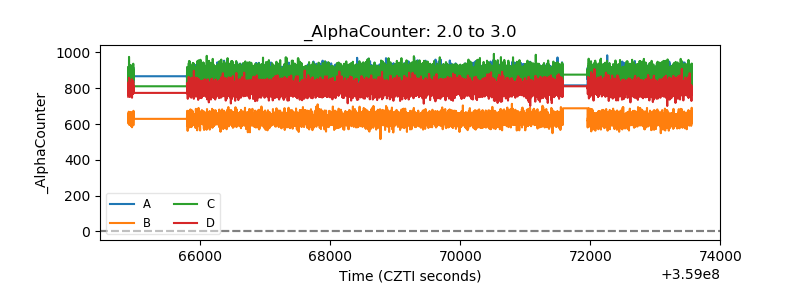 |
| _CPM_Rate | 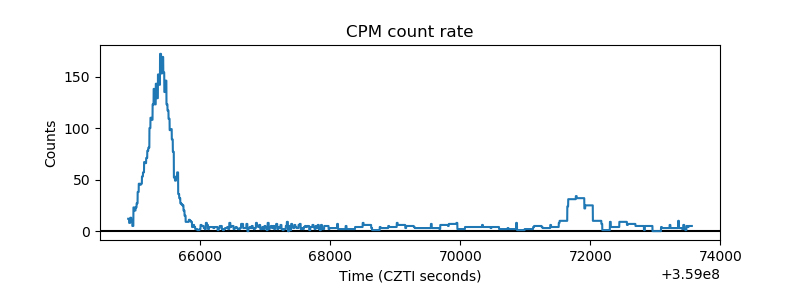 |
| CZT Counter | 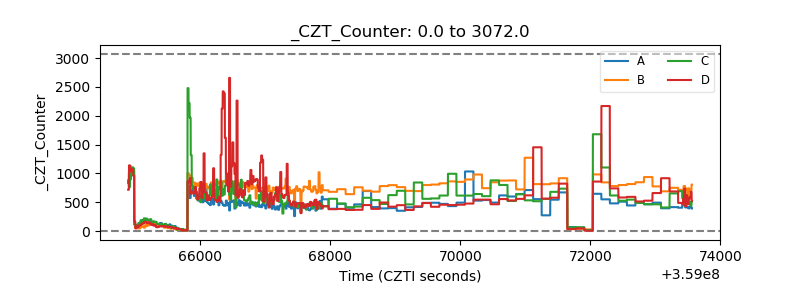 |
| +2.5 Volts monitor |  |
| +5 Volts monitor |  |
| _ROLL_ROT |  |
| _Roll_DEC |  |
| _Roll_RA | 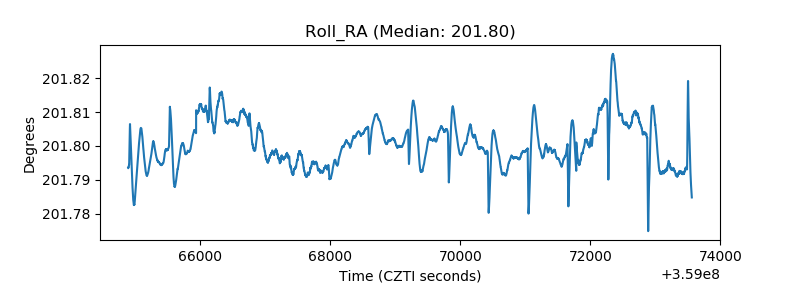 |
| Veto Counter |  |