| Param | Original file | Final file |
|---|---|---|
| Filename | modeM0/AS1A10_058T04_9000004382_30489cztM0_level2.evt | modeM0/AS1A10_058T04_9000004382_30489cztM0_level2_quad_clean.evt |
| Size (bytes) | 770,892,480 | 112,008,960 |
| Size | 735.2 MB | 106.8 MB |
| Events in quadrant A | 4,021,943 | 791,315 |
| Events in quadrant B | 6,431,897 | 785,056 |
| Events in quadrant C | 4,367,063 | 744,791 |
| Events in quadrant D | 7,980,722 | 510,033 |
| Mode SS | |||
|---|---|---|---|
| Quadrant | BADHDUFLAG | Total packets | Discarded packets |
| A | 0 | 164 | 0 |
| B | 0 | 164 | 0 |
| C | 0 | 164 | 0 |
| D | 0 | 164 | 0 |
| Mode M9 | |||
|---|---|---|---|
| Quadrant | BADHDUFLAG | Total packets | Discarded packets |
| A | 0 | 7 | 0 |
| B | 0 | 7 | 0 |
| C | 0 | 7 | 0 |
| D | 0 | 7 | 0 |
| Mode M0 | |||
|---|---|---|---|
| Quadrant | BADHDUFLAG | Total packets | Discarded packets |
| A | 0 | 17170 | 2 |
| B | 0 | 24884 | 2 |
| C | 0 | 18051 | 2 |
| D | 0 | 29279 | 2 |
| Quadrant | Total seconds | Saturated seconds | Saturation percentage |
|---|---|---|---|
| A | 8058 | 86 | 1.067262% |
| B | 8059 | 228 | 2.829135% |
| C | 8059 | 213 | 2.643008% |
| D | 8059 | 2331 | 28.924184% |
Noise dominated data is calculated using 1-second bins in cleaned event files. If a bin has >2000 counts, and if more than 50% of those come from <1% of pixels, then it is considered to be noise-dominated and hence unusable.
| Quadrant | # 1 sec bins | Bins with >0 counts | Bins with >2000 counts | High rate bins dominated by noise | Noise dominated (total time) | Noise dominated (detector-on time) | Marked lightcurve |
|---|---|---|---|---|---|---|---|
| A | 8693 | 8060 | 23 | 23 | 0.26% | 0.29% | 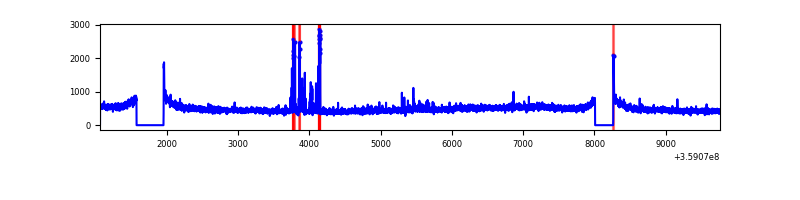 |
| B | 8694 | 8061 | 10 | 10 | 0.12% | 0.12% | 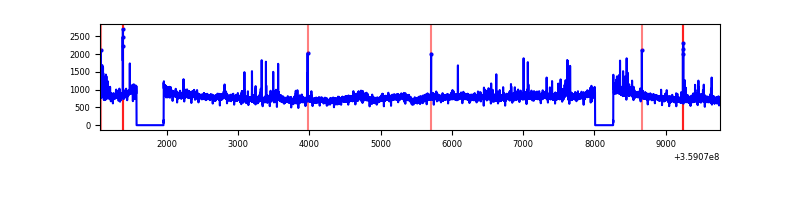 |
| C | 8694 | 8061 | 47 | 47 | 0.54% | 0.58% | 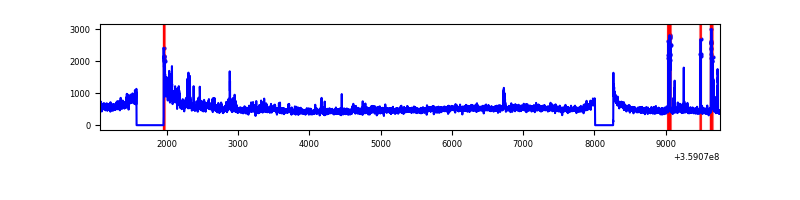 |
| D | 8694 | 8060 | 1311 | 1311 | 15.08% | 16.27% | 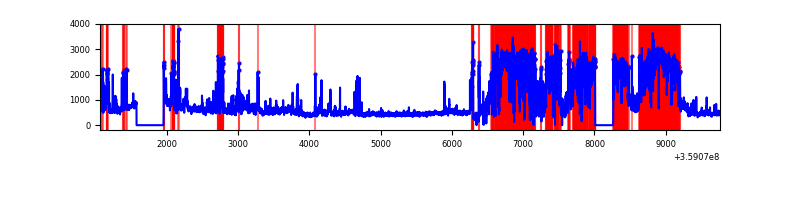 |
Top three noisy pixels from each quadrant. If the there are fewer than three noisy pixels in the level2.evt file, extra rows are filled as -1
| Pixel properties | Quadrant properties | ||||||
|---|---|---|---|---|---|---|---|
| Quadrant | DetID | PixID | Counts | Sigma | Mean | Median | Sigma |
| A | 0 | 13 | 135815 | 665.49 | 999 | 978 | 202.6 |
| A | 8 | 192 | 24595 | 116.56 | 999 | 978 | 202.6 |
| A | 13 | 254 | 16147 | 74.87 | 999 | 978 | 202.6 |
| B | 6 | 159 | 2334012 | 12436.45 | 985 | 961 | 187.6 |
| B | 0 | 229 | 117544 | 621.45 | 985 | 961 | 187.6 |
| B | 5 | 172 | 41504 | 216.12 | 985 | 961 | 187.6 |
| C | 3 | 233 | 356566 | 1615.77 | 940 | 945 | 220.1 |
| C | 10 | 22 | 158651 | 716.54 | 940 | 945 | 220.1 |
| C | 14 | 238 | 150909 | 681.37 | 940 | 945 | 220.1 |
| D | 12 | 218 | 3994415 | 22480.28 | 736 | 716 | 177.7 |
| D | 8 | 195 | 309513 | 1738.2 | 736 | 716 | 177.7 |
| D | 12 | 250 | 221643 | 1243.58 | 736 | 716 | 177.7 |
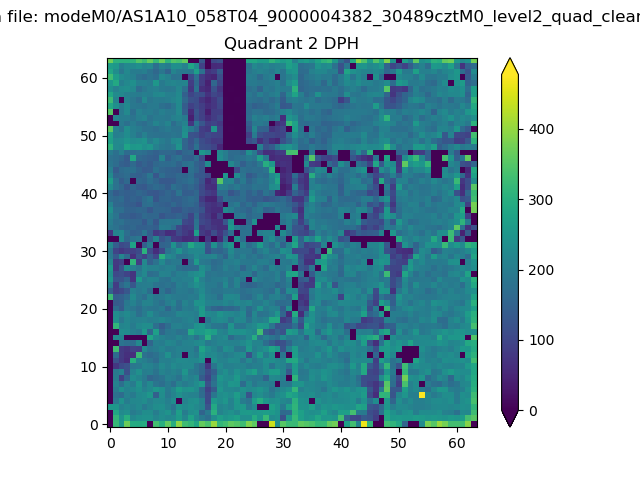
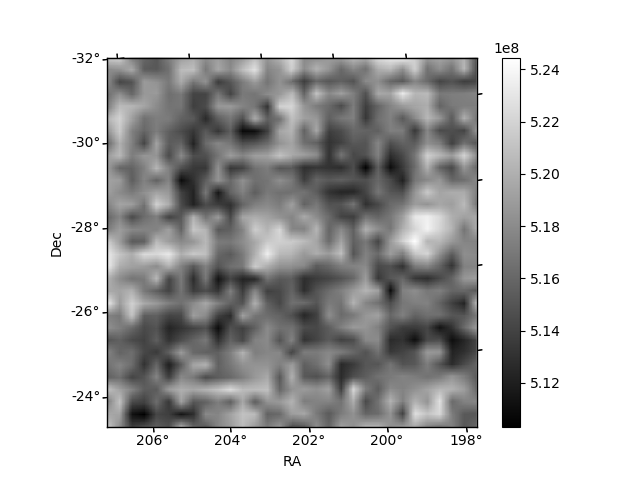
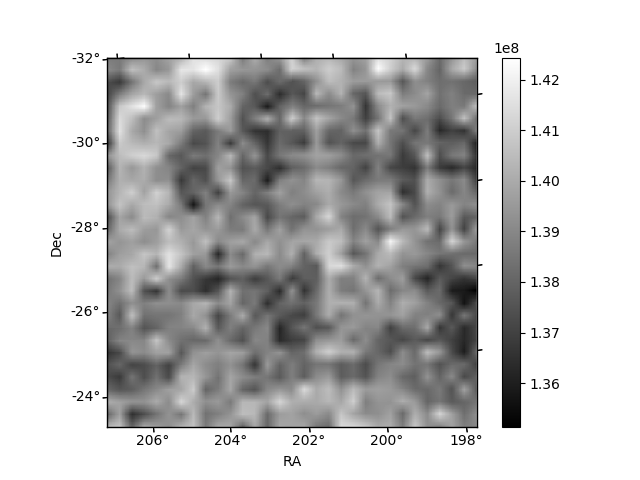
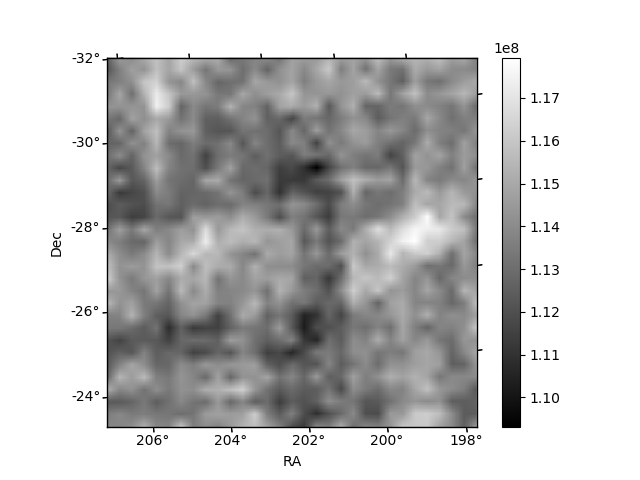
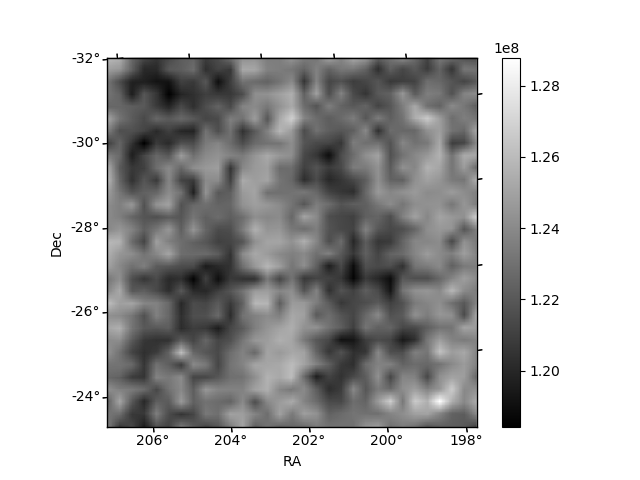
Histogram calculated using DETX and DETY for each event in the final _common_clean file
| Quadrant A | 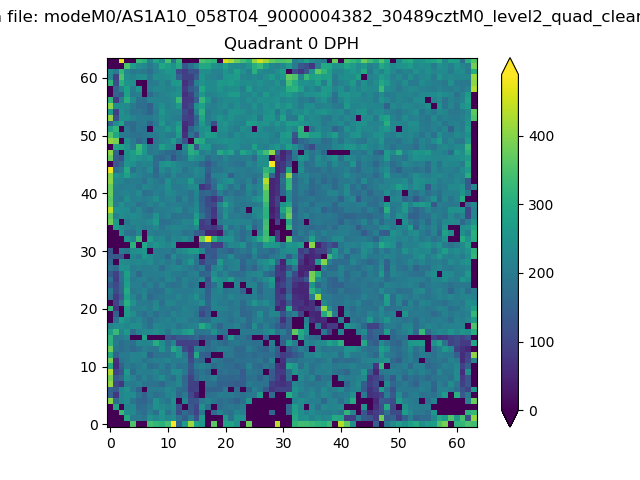 |
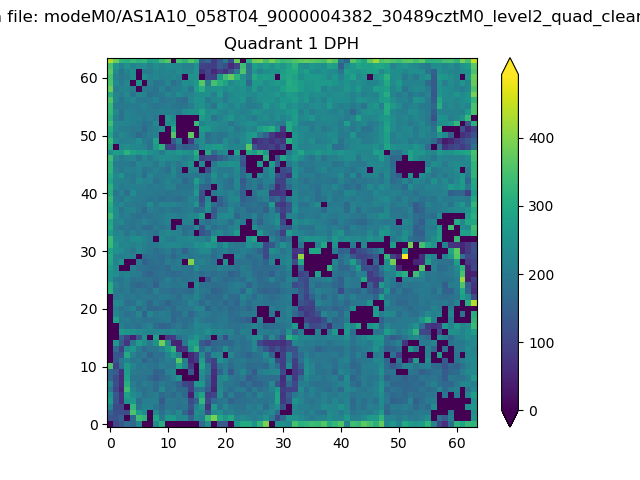 |
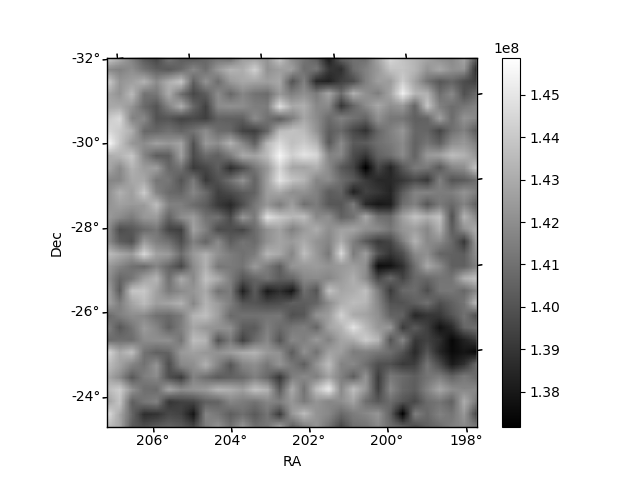
Quadrant B |
|---|---|---|---|
| Quadrant D | 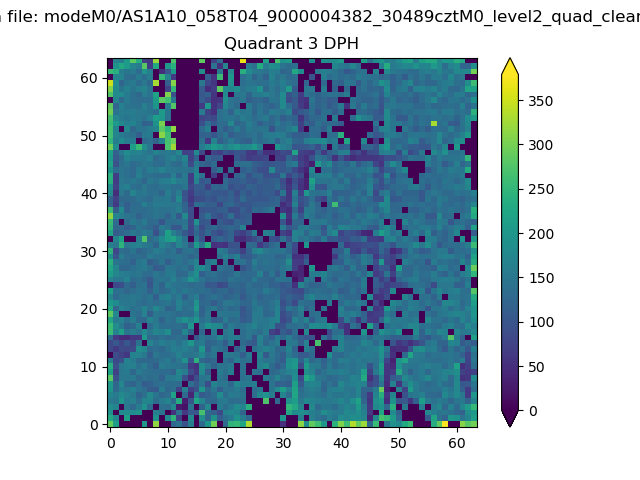 |
 |
Quadrant C |
| Plot type | Count rate plots | Images |
|---|---|---|
| Comparison with Poisson distribution Blue bars denote a histogram of data divided into 1 sec bins. Red curve is a Poisson curve with rate = median count rate of data. |
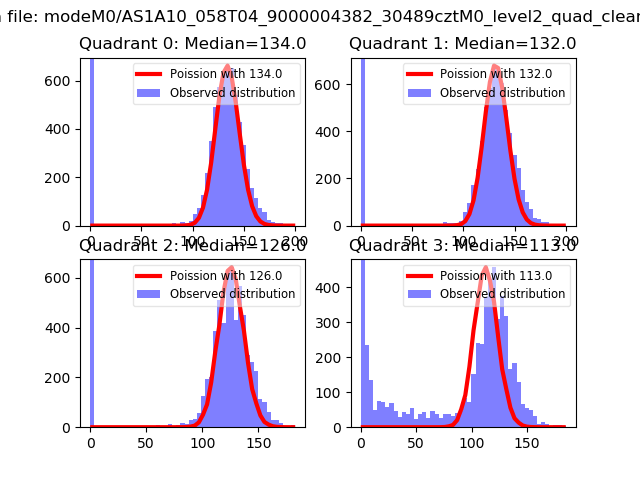 |
 |
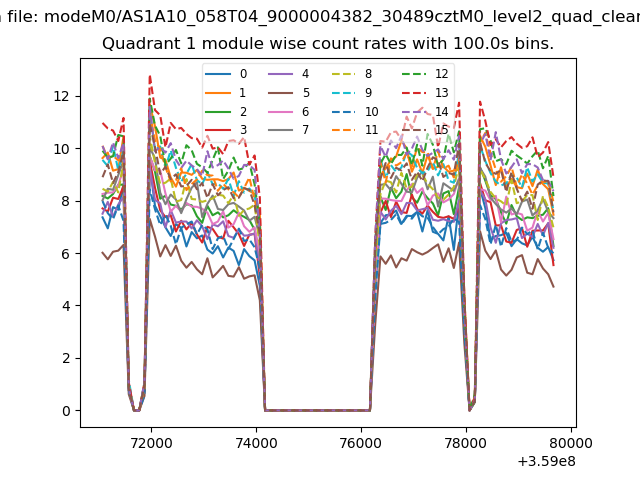
| Quadrant-wise count rates Data is divided into 100 sec bins |
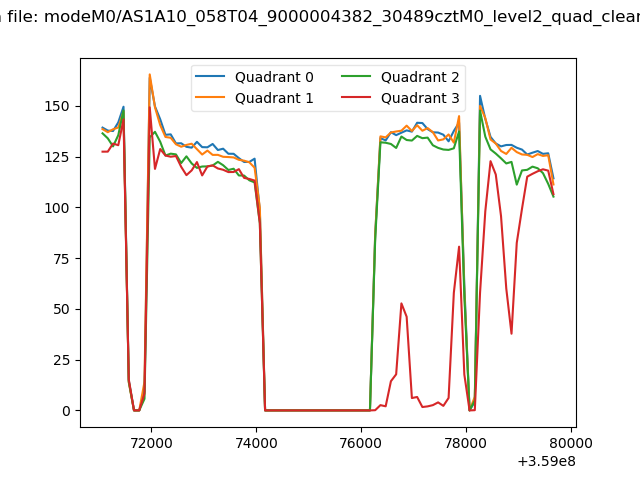 |
|
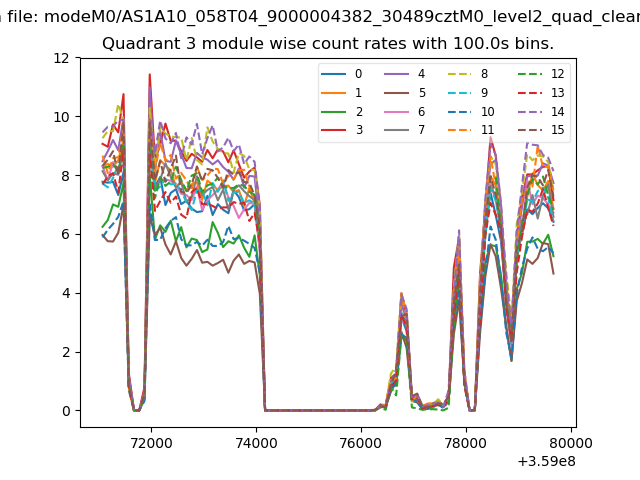
| Module-wise count rates for Quadrant A Data is divided into 100 sec bins |
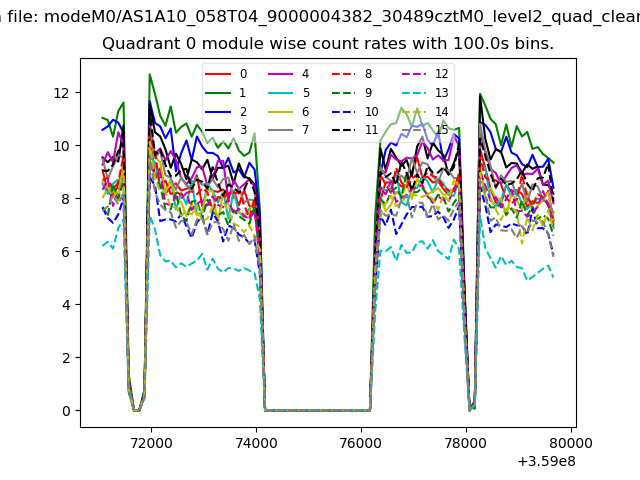 |
 |
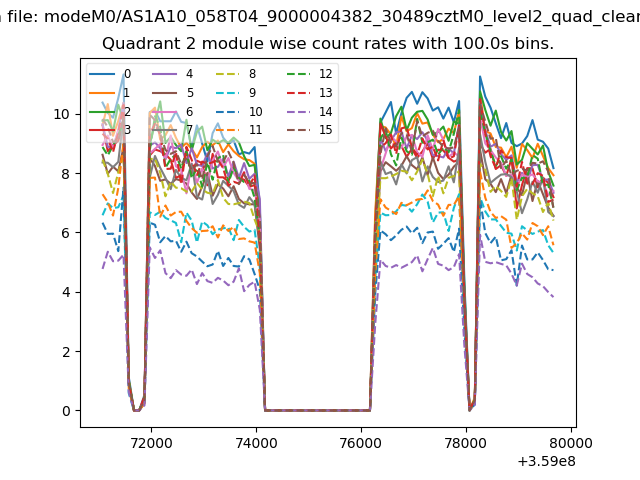
| Module-wise count rates for Quadrant B Data is divided into 100 sec bins |
 |
 |
| Module-wise count rates for Quadrant C Data is divided into 100 sec bins |
 |
 |
| Module-wise count rates for Quadrant D Data is divided into 100 sec bins |
 |
 |
| Parameter | Plot |
|---|---|
| CZT HV Monitor | 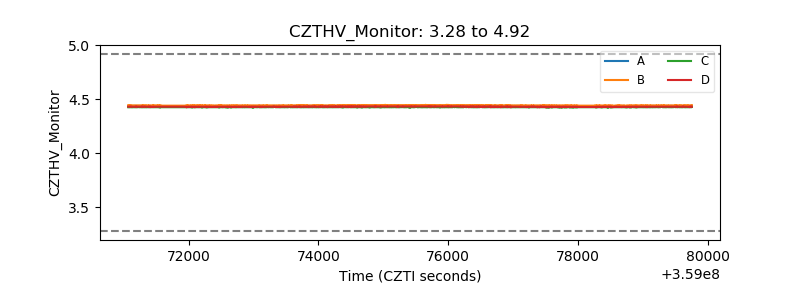 |
| D_VDD | 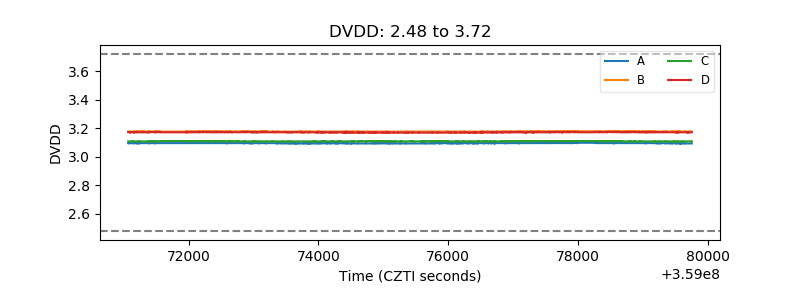 |
| Temperature 1 | 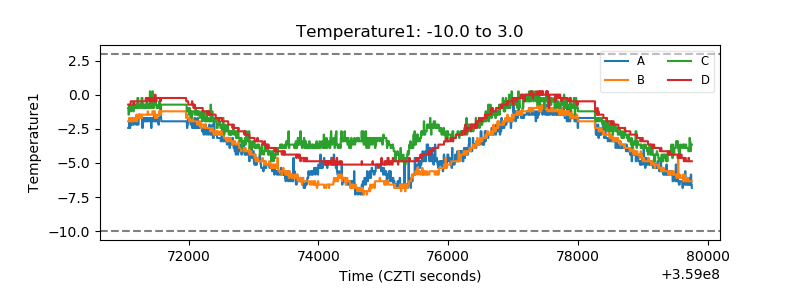 |
| Veto HV Monitor | 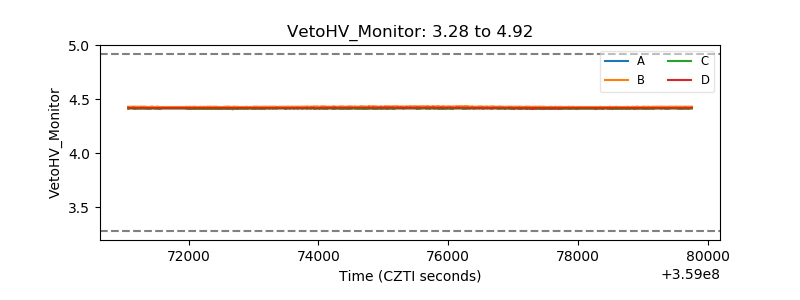 |
| Veto LLD | 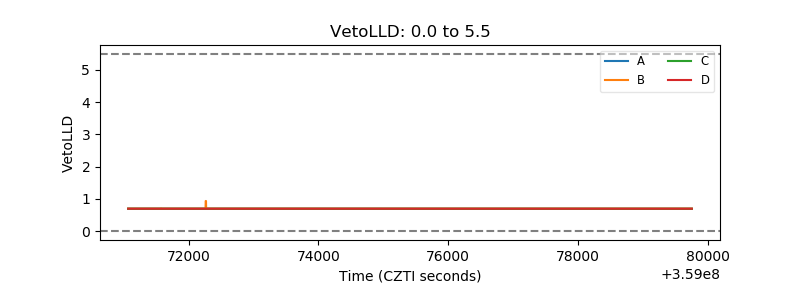 |
| Alpha Counter | 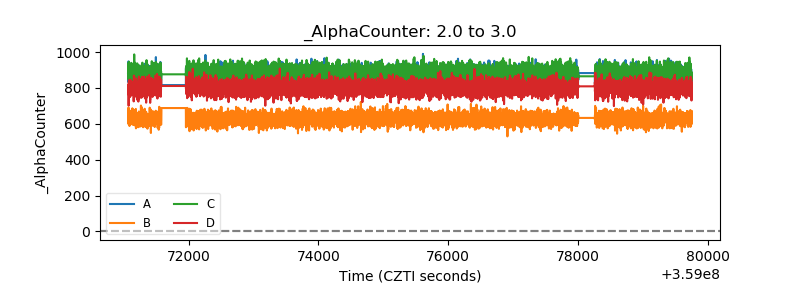 |
| _CPM_Rate | 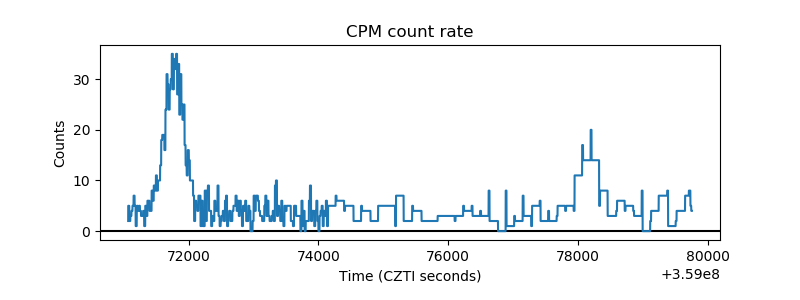 |
| CZT Counter | 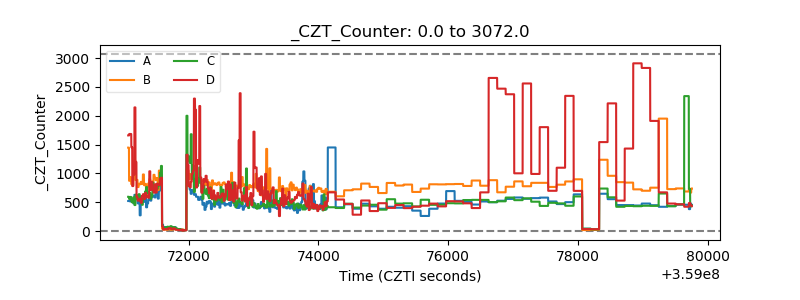 |
| +2.5 Volts monitor | 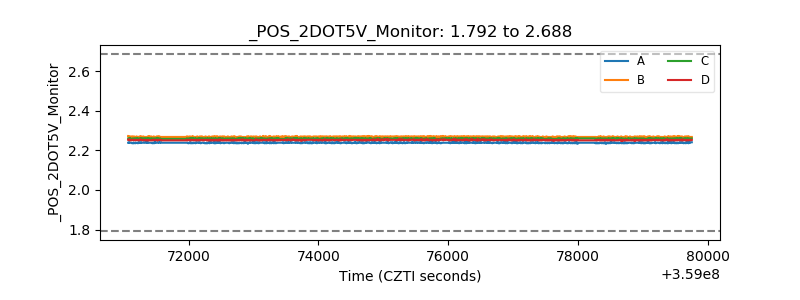 |
| +5 Volts monitor | 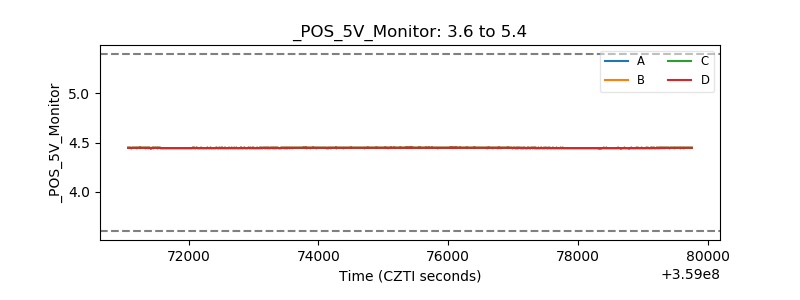 |
| _ROLL_ROT | 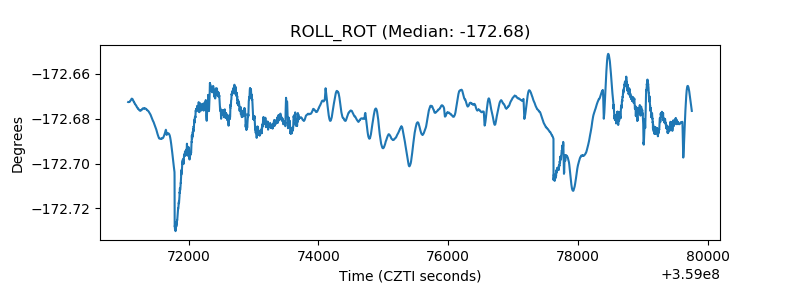 |
| _Roll_DEC | 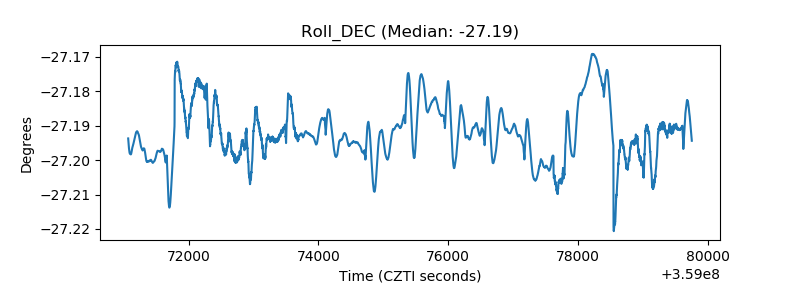 |
| _Roll_RA | 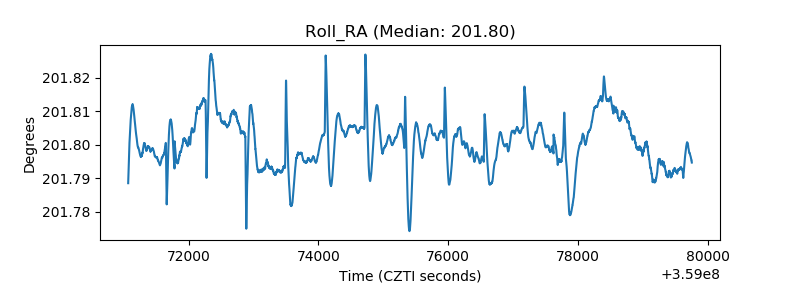 |
| Veto Counter | 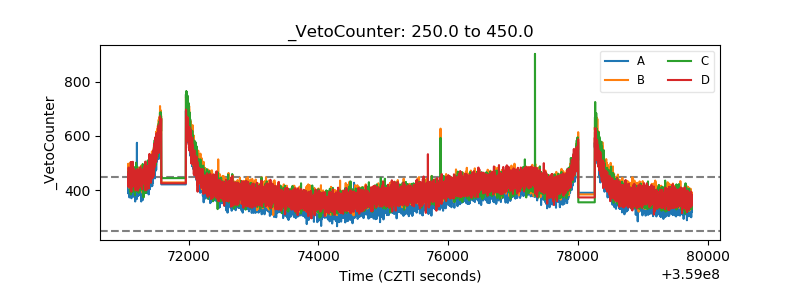 |