| Param | Original file | Final file |
|---|---|---|
| Filename | modeM0/AS1A10_058T04_9000004382_30490cztM0_level2.evt | modeM0/AS1A10_058T04_9000004382_30490cztM0_level2_quad_clean.evt |
| Size (bytes) | 714,677,760 | 93,735,360 |
| Size | 681.6 MB | 89.4 MB |
| Events in quadrant A | 3,737,982 | 635,095 |
| Events in quadrant B | 5,690,629 | 628,209 |
| Events in quadrant C | 3,668,787 | 597,935 |
| Events in quadrant D | 8,049,375 | 464,552 |
| Mode SS | |||
|---|---|---|---|
| Quadrant | BADHDUFLAG | Total packets | Discarded packets |
| A | 0 | 148 | 0 |
| B | 0 | 148 | 0 |
| C | 0 | 148 | 0 |
| D | 0 | 148 | 0 |
| Mode M9 | |||
|---|---|---|---|
| Quadrant | BADHDUFLAG | Total packets | Discarded packets |
| A | 0 | 4 | 0 |
| B | 0 | 4 | 0 |
| C | 0 | 4 | 0 |
| D | 0 | 4 | 0 |
| Mode M0 | |||
|---|---|---|---|
| Quadrant | BADHDUFLAG | Total packets | Discarded packets |
| A | 0 | 15926 | 2 |
| B | 0 | 22417 | 1 |
| C | 0 | 15660 | 1 |
| D | 0 | 29034 | 1 |
| Quadrant | Total seconds | Saturated seconds | Saturation percentage |
|---|---|---|---|
| A | 7359 | 76 | 1.032749% |
| B | 7360 | 93 | 1.263587% |
| C | 7360 | 178 | 2.418478% |
| D | 7360 | 1543 | 20.964674% |
Noise dominated data is calculated using 1-second bins in cleaned event files. If a bin has >2000 counts, and if more than 50% of those come from <1% of pixels, then it is considered to be noise-dominated and hence unusable.
| Quadrant | # 1 sec bins | Bins with >0 counts | Bins with >2000 counts | High rate bins dominated by noise | Noise dominated (total time) | Noise dominated (detector-on time) | Marked lightcurve |
|---|---|---|---|---|---|---|---|
| A | 7749 | 7361 | 38 | 38 | 0.49% | 0.52% | 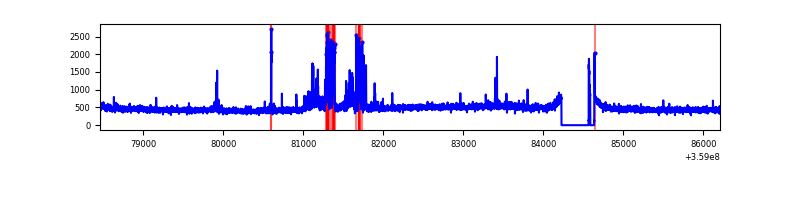 |
| B | 7750 | 7362 | 11 | 11 | 0.14% | 0.15% | 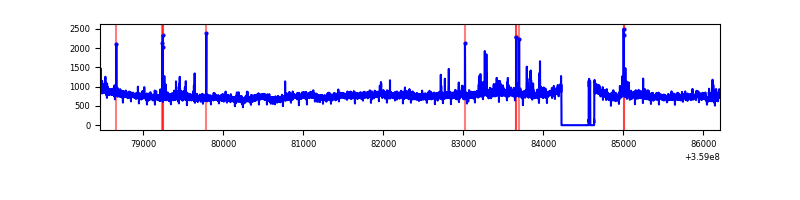 |
| C | 7750 | 7362 | 39 | 39 | 0.50% | 0.53% | 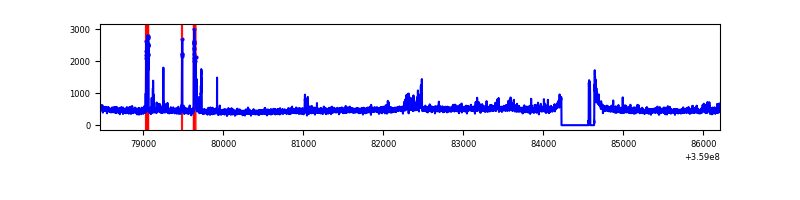 |
| D | 7750 | 7362 | 1292 | 1292 | 16.67% | 17.55% | 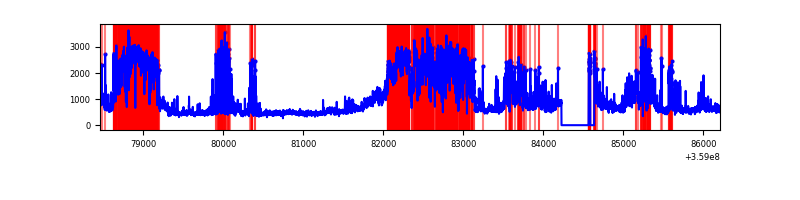 |
Top three noisy pixels from each quadrant. If the there are fewer than three noisy pixels in the level2.evt file, extra rows are filled as -1
| Pixel properties | Quadrant properties | ||||||
|---|---|---|---|---|---|---|---|
| Quadrant | DetID | PixID | Counts | Sigma | Mean | Median | Sigma |
| A | 0 | 13 | 329700 | 1853.85 | 874 | 857 | 177.4 |
| A | 8 | 192 | 19949 | 107.63 | 874 | 857 | 177.4 |
| A | 13 | 254 | 14802 | 78.61 | 874 | 857 | 177.4 |
| B | 6 | 159 | 2112673 | 12794.83 | 865 | 845 | 165.1 |
| B | 0 | 229 | 69235 | 414.35 | 865 | 845 | 165.1 |
| B | 5 | 172 | 37502 | 222.09 | 865 | 845 | 165.1 |
| C | 14 | 238 | 157894 | 806.17 | 826 | 831 | 194.8 |
| C | 10 | 22 | 153576 | 784.01 | 826 | 831 | 194.8 |
| C | 3 | 233 | 89892 | 457.13 | 826 | 831 | 194.8 |
| D | 12 | 218 | 4307887 | 24731.72 | 726 | 707 | 174.2 |
| D | 8 | 195 | 404813 | 2320.37 | 726 | 707 | 174.2 |
| D | 12 | 250 | 114803 | 655.14 | 726 | 707 | 174.2 |
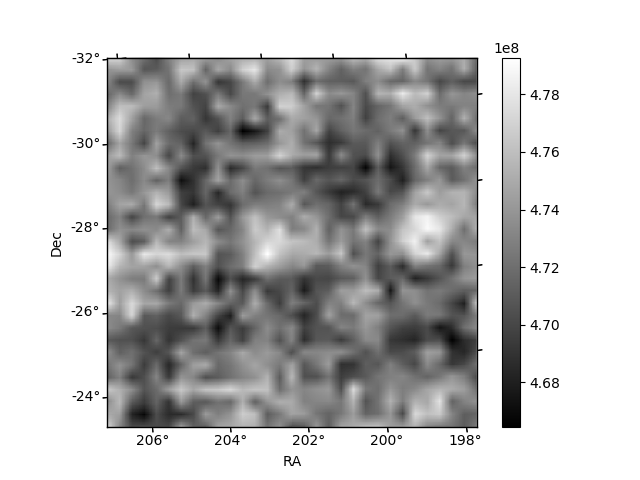
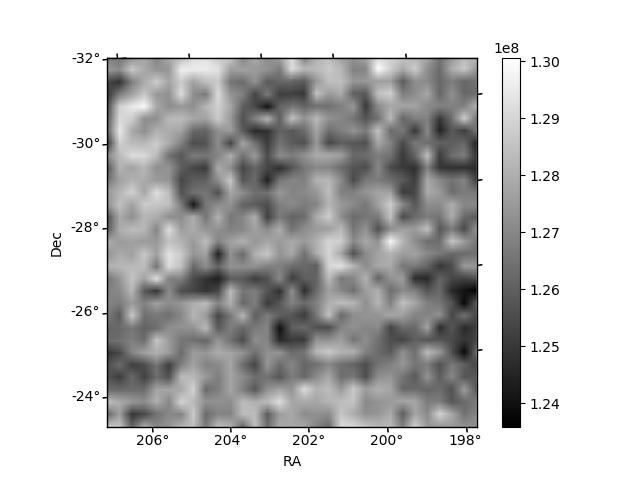
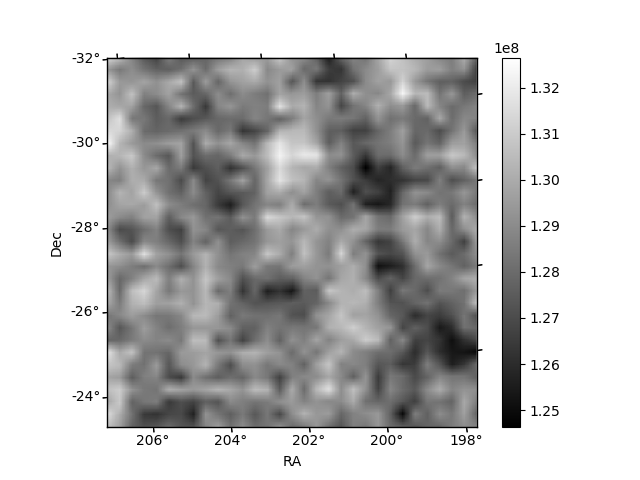
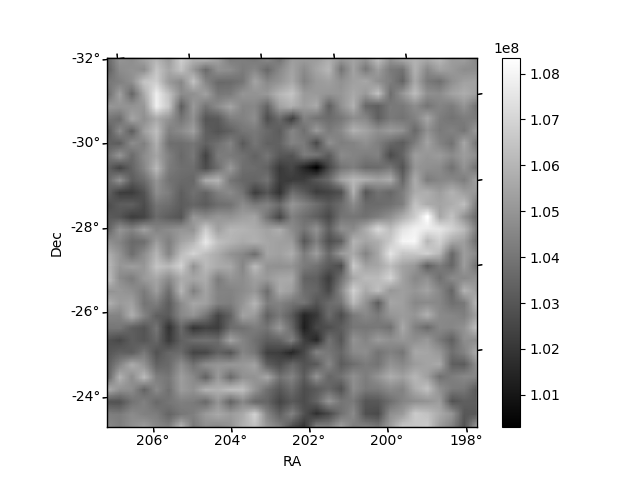
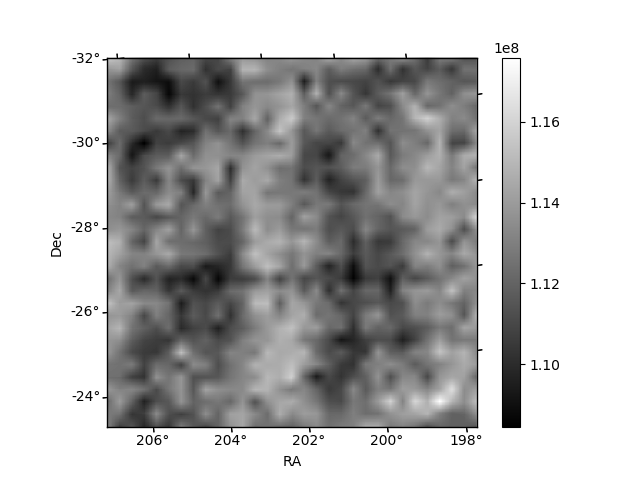
Histogram calculated using DETX and DETY for each event in the final _common_clean file
| Quadrant A | 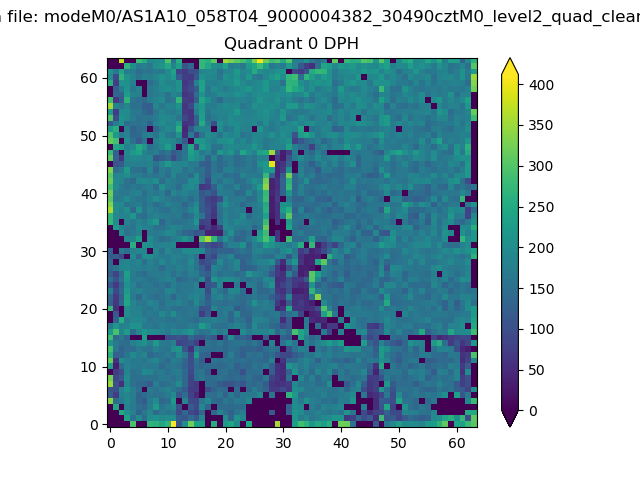 |
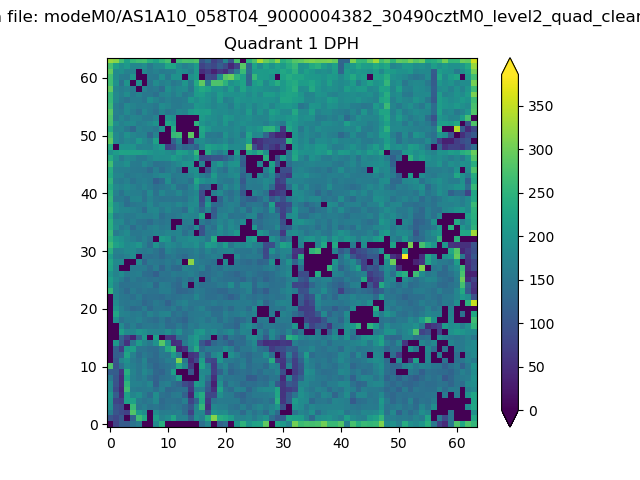 |
Quadrant B |
|---|---|---|---|
| Quadrant D |  |
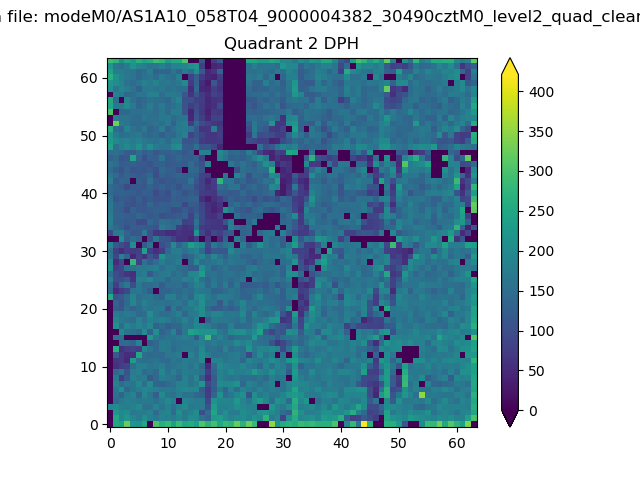 |
Quadrant C |
| Plot type | Count rate plots | Images |
|---|---|---|
| Comparison with Poisson distribution Blue bars denote a histogram of data divided into 1 sec bins. Red curve is a Poisson curve with rate = median count rate of data. |
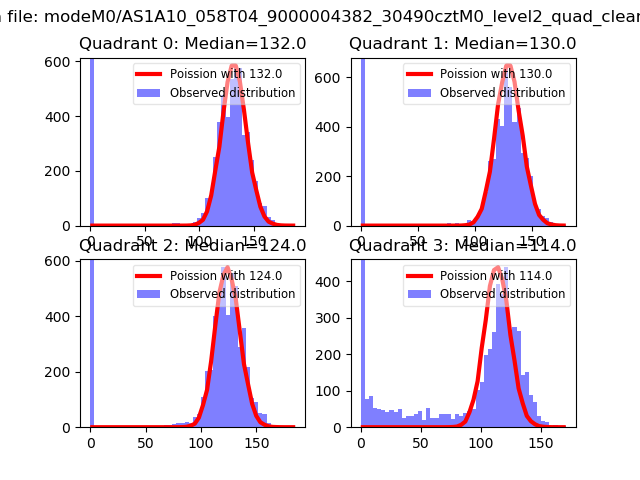 |
 |
| Quadrant-wise count rates Data is divided into 100 sec bins |
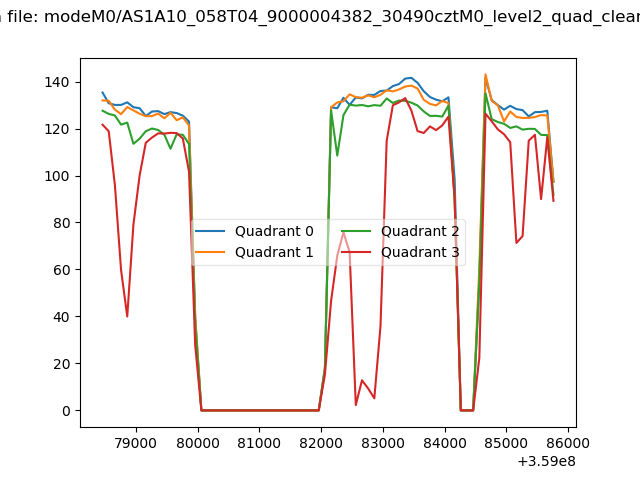 |
|
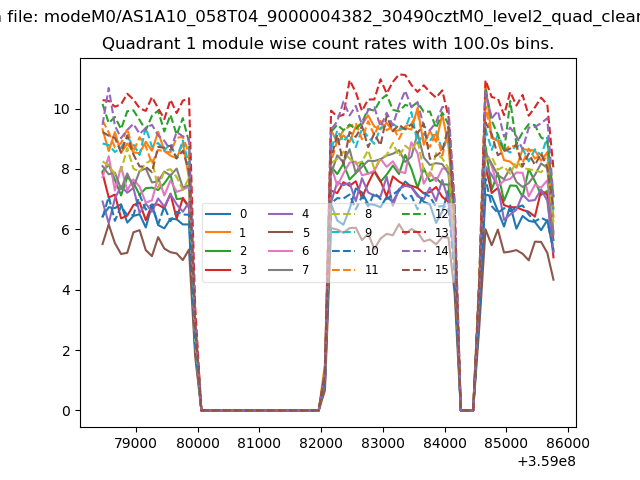
| Module-wise count rates for Quadrant A Data is divided into 100 sec bins |
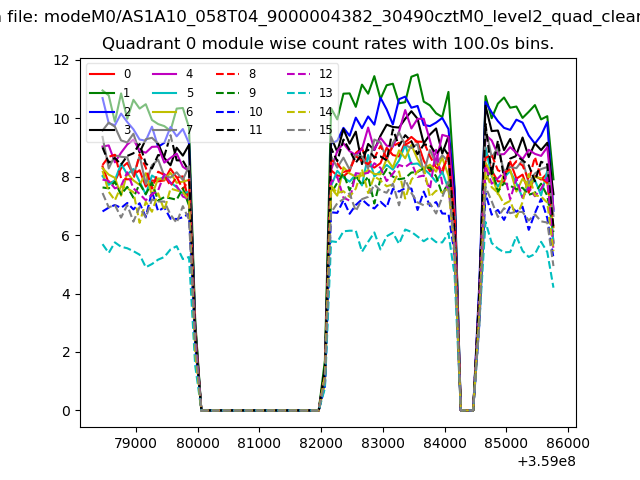 |
 |
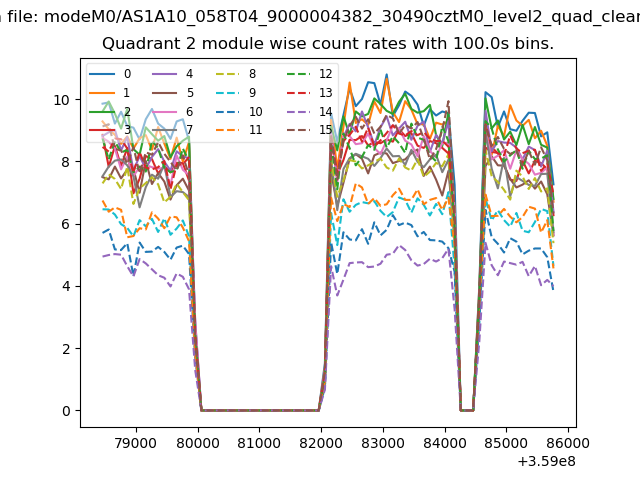
| Module-wise count rates for Quadrant B Data is divided into 100 sec bins |
 |
 |
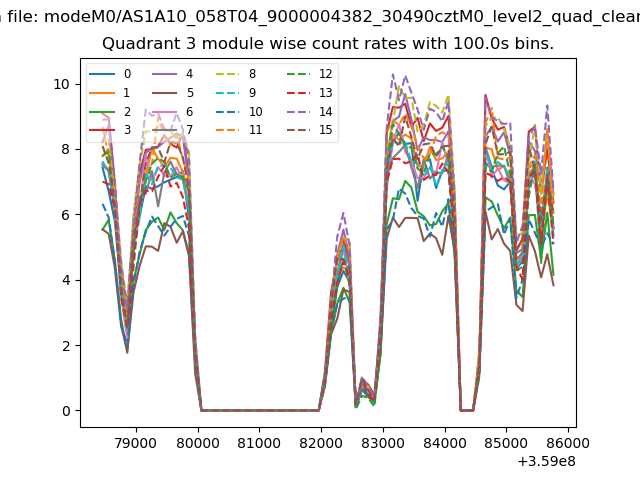
| Module-wise count rates for Quadrant C Data is divided into 100 sec bins |
 |
 |
| Module-wise count rates for Quadrant D Data is divided into 100 sec bins |
 |
 |
| Parameter | Plot |
|---|---|
| CZT HV Monitor | 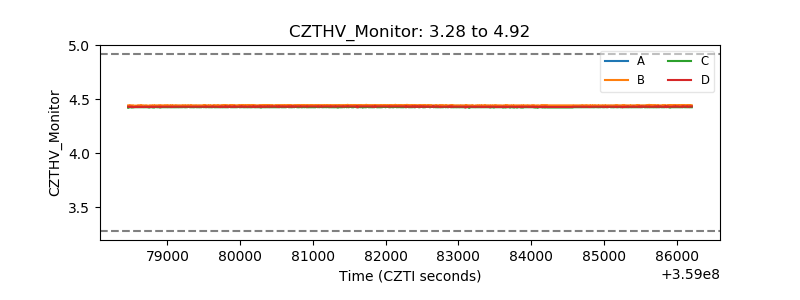 |
| D_VDD | 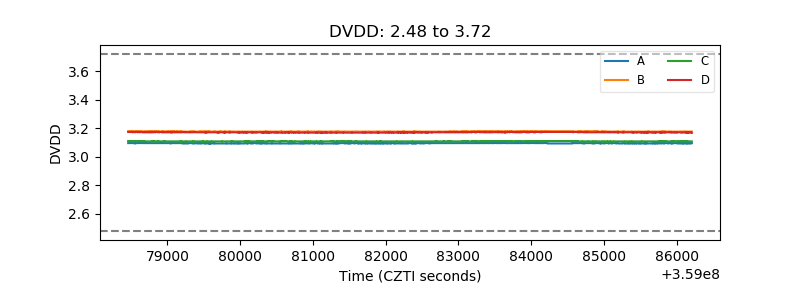 |
| Temperature 1 | 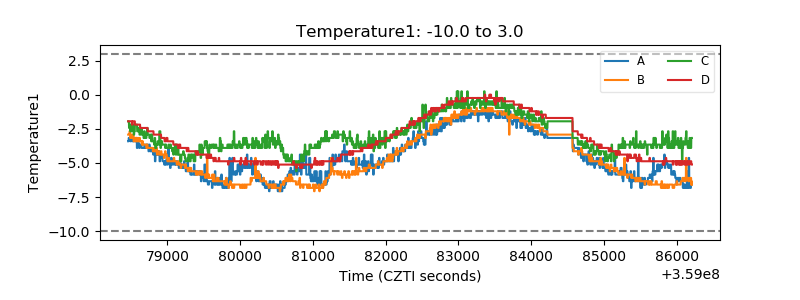 |
| Veto HV Monitor | 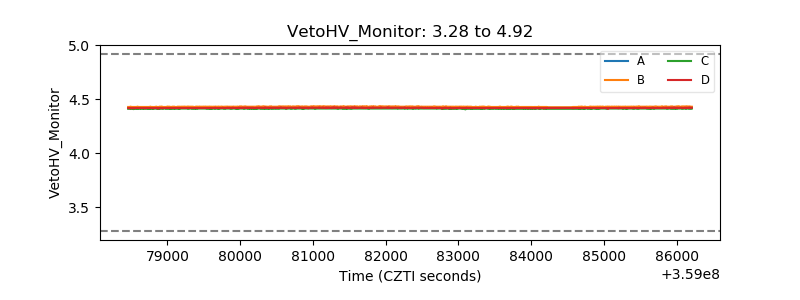 |
| Veto LLD | 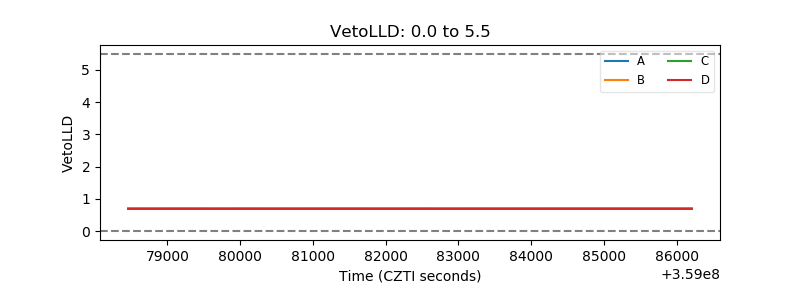 |
| Alpha Counter | 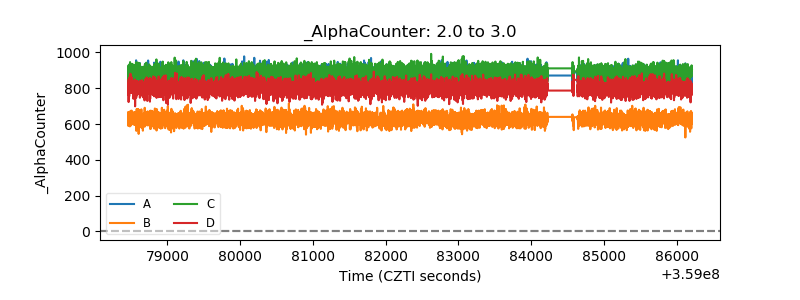 |
| _CPM_Rate | 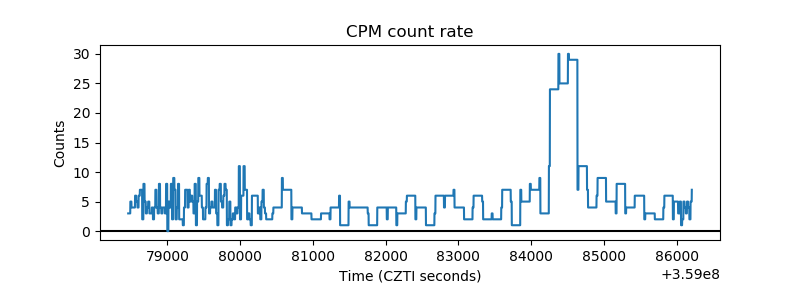 |
| CZT Counter | 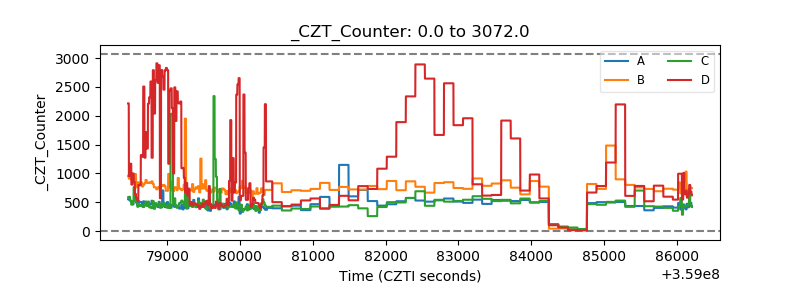 |
| +2.5 Volts monitor | 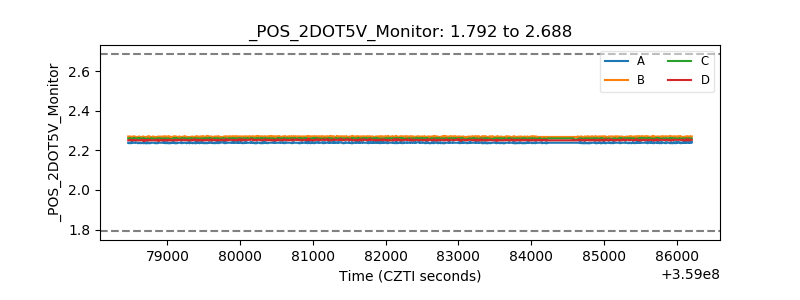 |
| +5 Volts monitor | 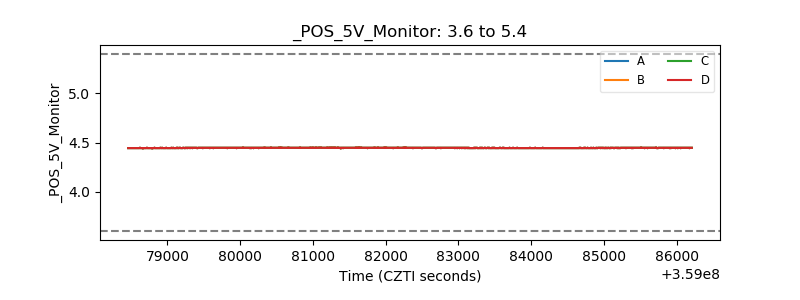 |
| _ROLL_ROT | 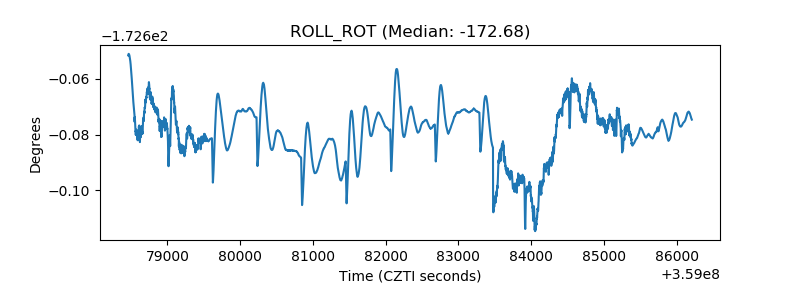 |
| _Roll_DEC | 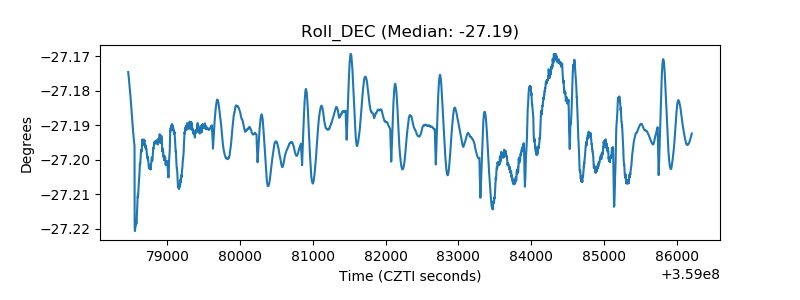 |
| _Roll_RA | 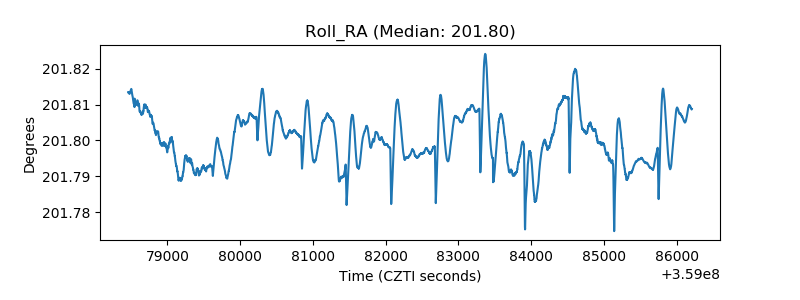 |
| Veto Counter | 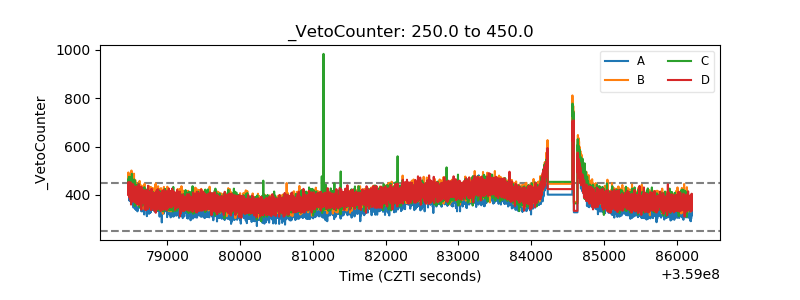 |