| Param | Original file | Final file |
|---|---|---|
| Filename | modeM0/AS1A10_058T04_9000004382_30493cztM0_level2.evt | modeM0/AS1A10_058T04_9000004382_30493cztM0_level2_quad_clean.evt |
| Size (bytes) | 1,936,388,160 | 198,714,240 |
| Size | 1.8 GB | 189.5 MB |
| Events in quadrant A | 8,568,511 | 1,347,587 |
| Events in quadrant B | 14,466,559 | 1,336,722 |
| Events in quadrant C | 9,009,934 | 1,289,804 |
| Events in quadrant D | 25,374,834 | 789,250 |
| Mode SS | |||
|---|---|---|---|
| Quadrant | BADHDUFLAG | Total packets | Discarded packets |
| A | 0 | 374 | 0 |
| B | 0 | 374 | 0 |
| C | 0 | 374 | 0 |
| D | 0 | 374 | 0 |
| Mode M9 | |||
|---|---|---|---|
| Quadrant | BADHDUFLAG | Total packets | Discarded packets |
| A | 0 | 25 | 0 |
| B | 0 | 25 | 0 |
| C | 0 | 25 | 0 |
| D | 0 | 25 | 0 |
| Mode M0 | |||
|---|---|---|---|
| Quadrant | BADHDUFLAG | Total packets | Discarded packets |
| A | 0 | 37227 | 4 |
| B | 0 | 56450 | 4 |
| C | 0 | 38081 | 4 |
| D | 0 | 87686 | 4 |
| Quadrant | Total seconds | Saturated seconds | Saturation percentage |
|---|---|---|---|
| A | 18168 | 140 | 0.770586% |
| B | 18169 | 358 | 1.970389% |
| C | 18169 | 299 | 1.645660% |
| D | 18168 | 8225 | 45.271907% |
Noise dominated data is calculated using 1-second bins in cleaned event files. If a bin has >2000 counts, and if more than 50% of those come from <1% of pixels, then it is considered to be noise-dominated and hence unusable.
| Quadrant | # 1 sec bins | Bins with >0 counts | Bins with >2000 counts | High rate bins dominated by noise | Noise dominated (total time) | Noise dominated (detector-on time) | Marked lightcurve |
|---|---|---|---|---|---|---|---|
| A | 20693 | 18174 | 4 | 4 | 0.02% | 0.02% | 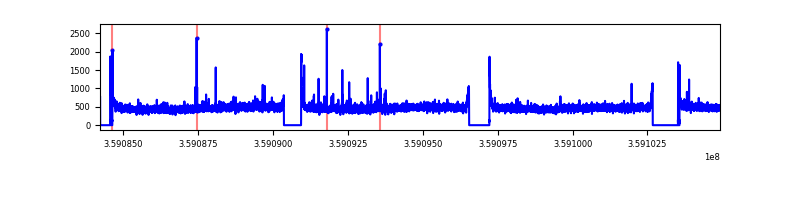 |
| B | 20694 | 18175 | 94 | 94 | 0.45% | 0.52% | 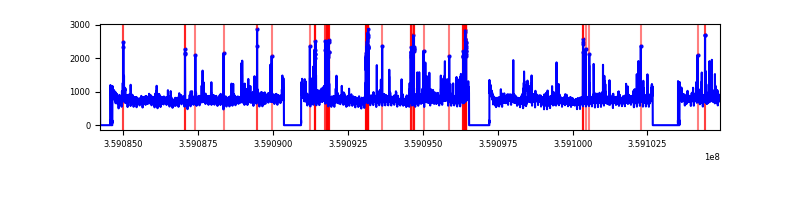 |
| C | 20694 | 18175 | 6 | 6 | 0.03% | 0.03% | 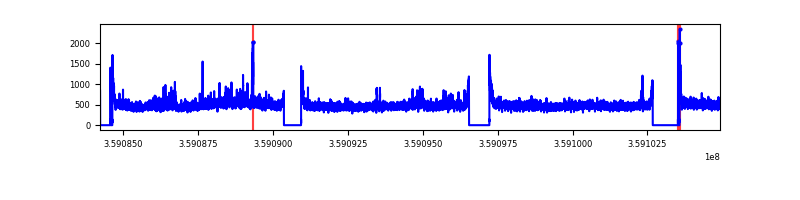 |
| D | 20693 | 18174 | 5702 | 5702 | 27.56% | 31.37% | 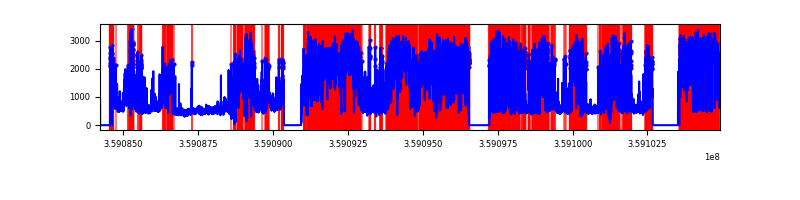 |
Top three noisy pixels from each quadrant. If the there are fewer than three noisy pixels in the level2.evt file, extra rows are filled as -1
| Pixel properties | Quadrant properties | ||||||
|---|---|---|---|---|---|---|---|
| Quadrant | DetID | PixID | Counts | Sigma | Mean | Median | Sigma |
| A | 12 | 96 | 63196 | 139.12 | 2188 | 2145 | 438.8 |
| A | 8 | 192 | 54182 | 118.58 | 2188 | 2145 | 438.8 |
| A | 13 | 254 | 34693 | 74.17 | 2188 | 2145 | 438.8 |
| B | 6 | 159 | 5094857 | 12334.39 | 2161 | 2105 | 412.9 |
| B | 0 | 229 | 592445 | 1429.77 | 2161 | 2105 | 412.9 |
| B | 15 | 36 | 93944 | 222.43 | 2161 | 2105 | 412.9 |
| C | 3 | 233 | 396788 | 808.01 | 2081 | 2095 | 488.5 |
| C | 14 | 238 | 366503 | 746.01 | 2081 | 2095 | 488.5 |
| C | 0 | 10 | 54322 | 106.92 | 2081 | 2095 | 488.5 |
| D | 12 | 218 | 14218849 | 41602.27 | 1406 | 1369 | 341.7 |
| D | 12 | 250 | 1932122 | 5649.64 | 1406 | 1369 | 341.7 |
| D | 12 | 202 | 1211334 | 3540.52 | 1406 | 1369 | 341.7 |
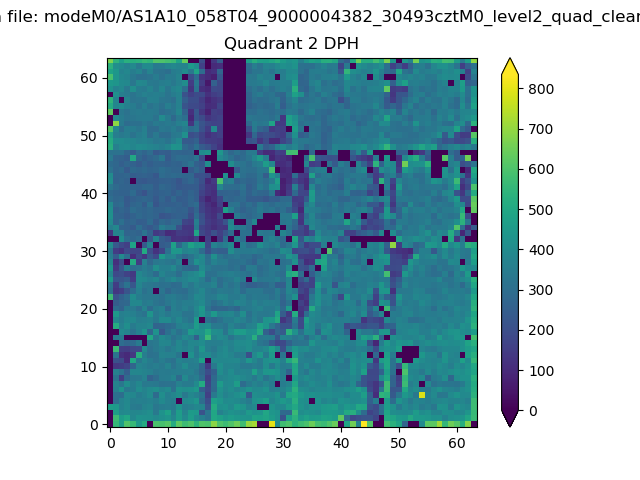
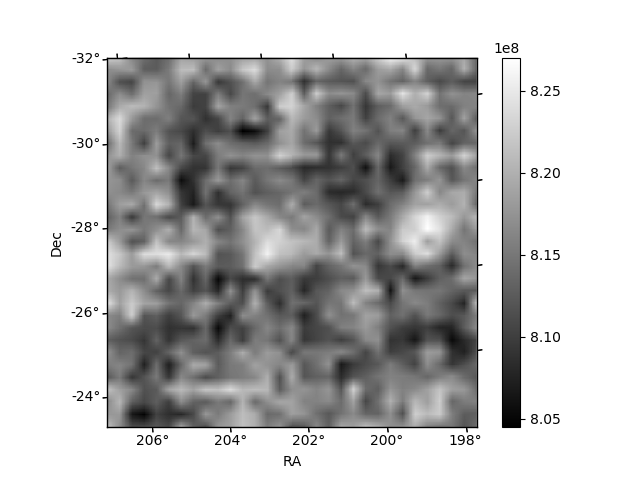
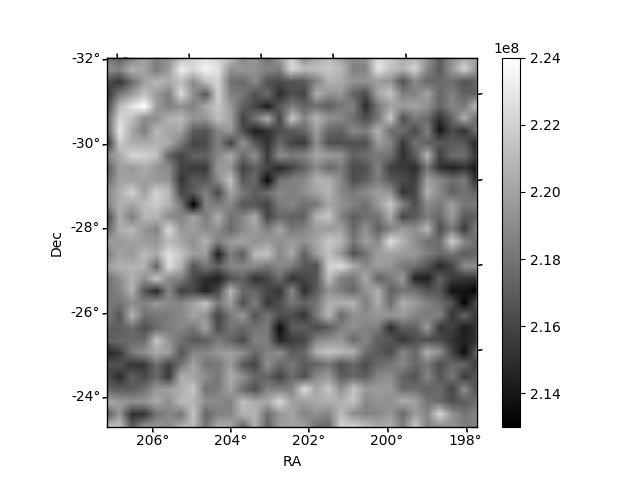
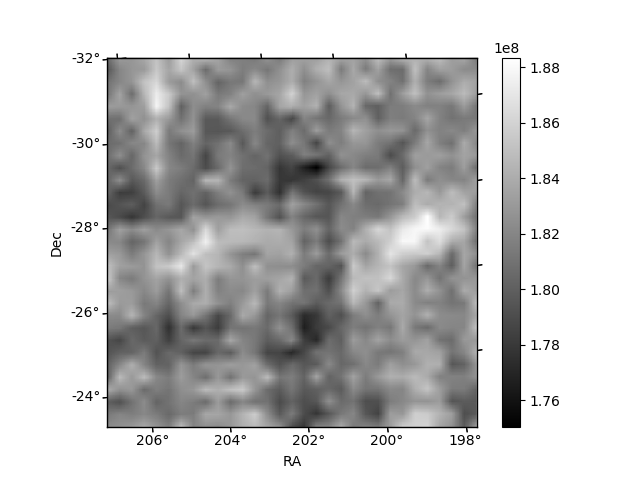
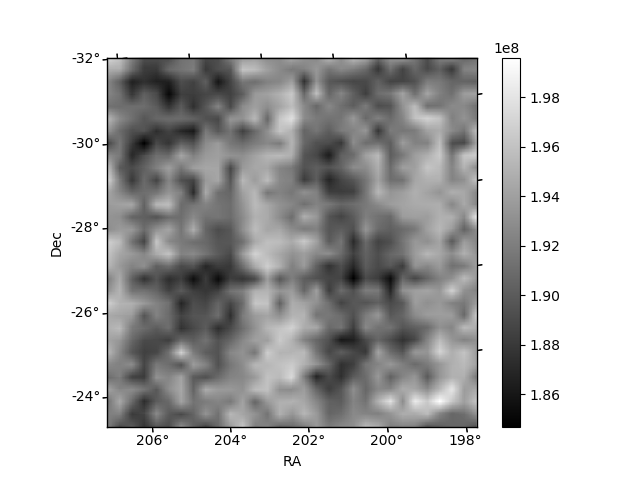
Histogram calculated using DETX and DETY for each event in the final _common_clean file
| Quadrant A | 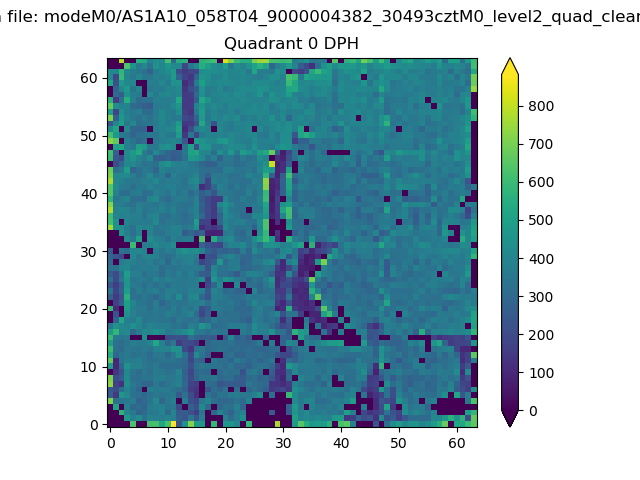 |
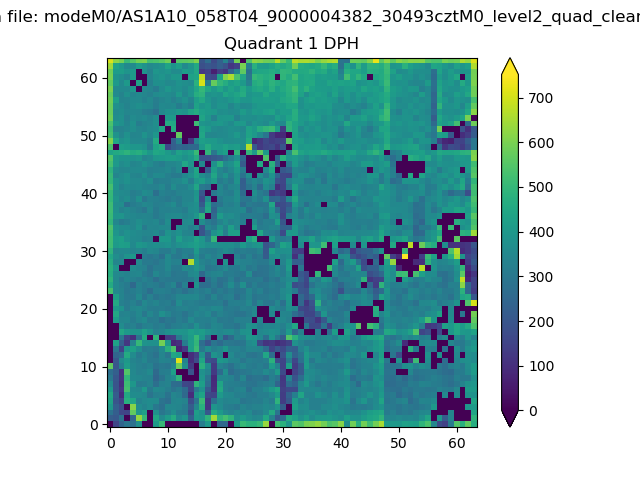 |
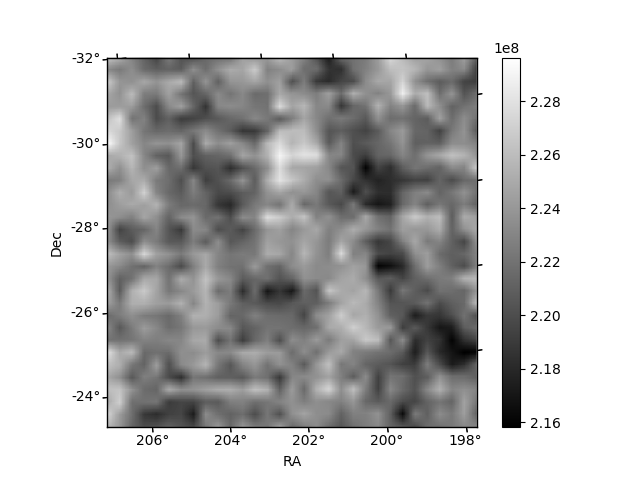
Quadrant B |
|---|---|---|---|
| Quadrant D | 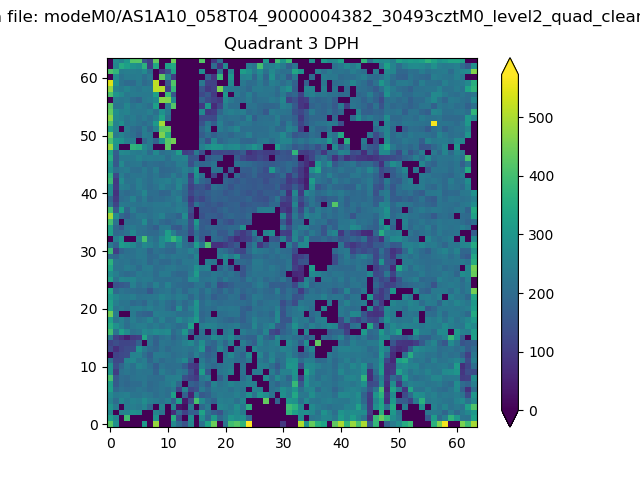 |
 |
Quadrant C |
| Plot type | Count rate plots | Images |
|---|---|---|
| Comparison with Poisson distribution Blue bars denote a histogram of data divided into 1 sec bins. Red curve is a Poisson curve with rate = median count rate of data. |
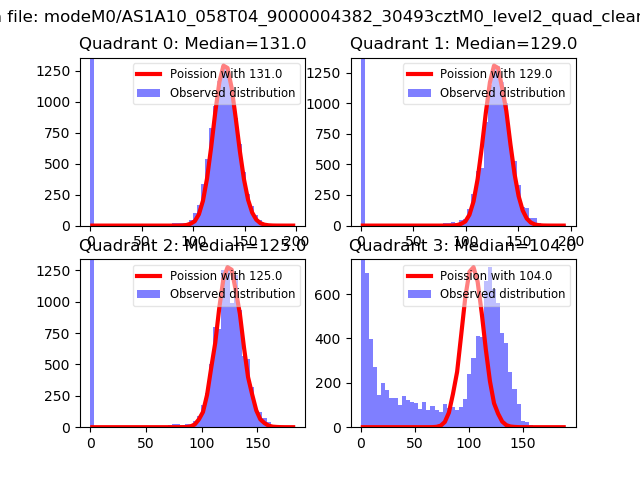 |
 |
| Quadrant-wise count rates Data is divided into 100 sec bins |
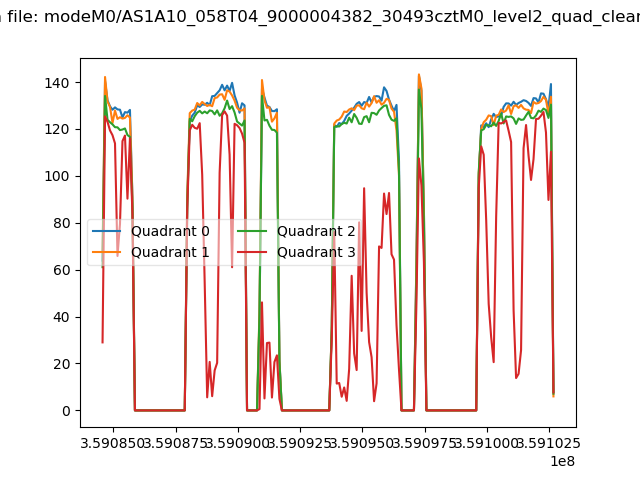 |
|
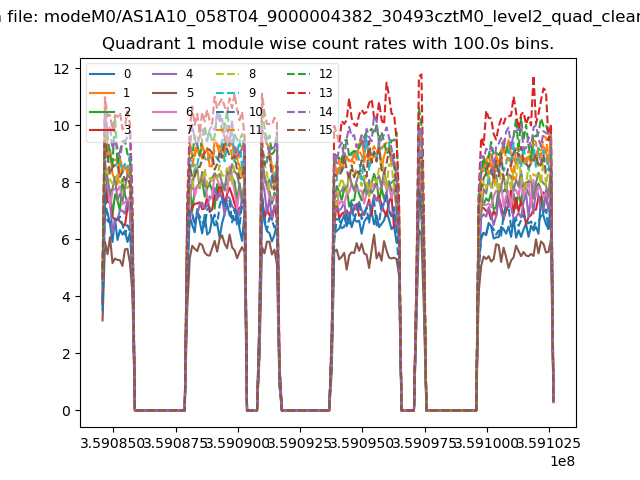
| Module-wise count rates for Quadrant A Data is divided into 100 sec bins |
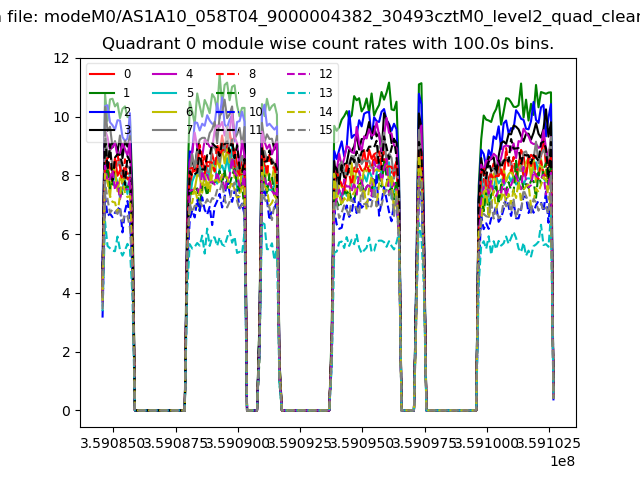 |
 |
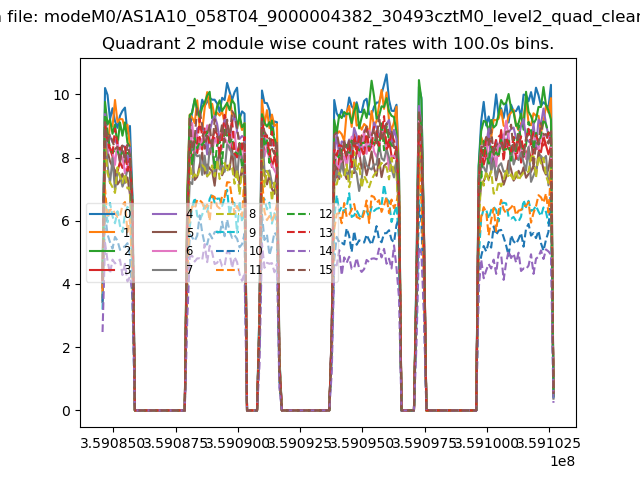
| Module-wise count rates for Quadrant B Data is divided into 100 sec bins |
 |
 |
| Module-wise count rates for Quadrant C Data is divided into 100 sec bins |
 |
 |
| Module-wise count rates for Quadrant D Data is divided into 100 sec bins |
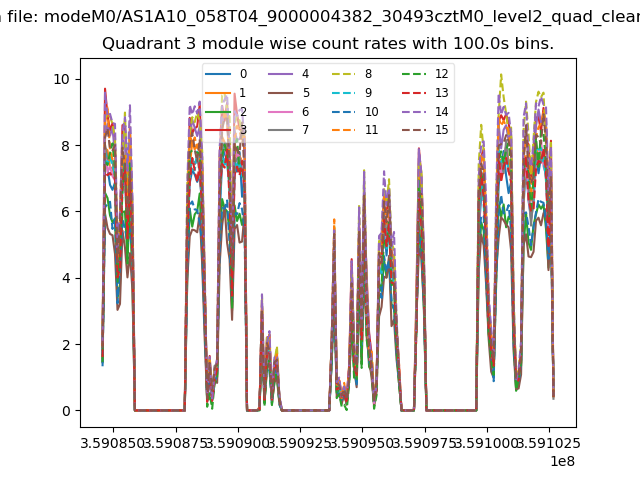 |
 |
| Parameter | Plot |
|---|---|
| CZT HV Monitor | 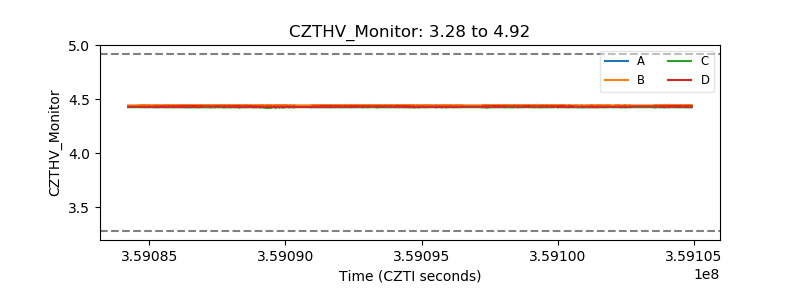 |
| D_VDD | 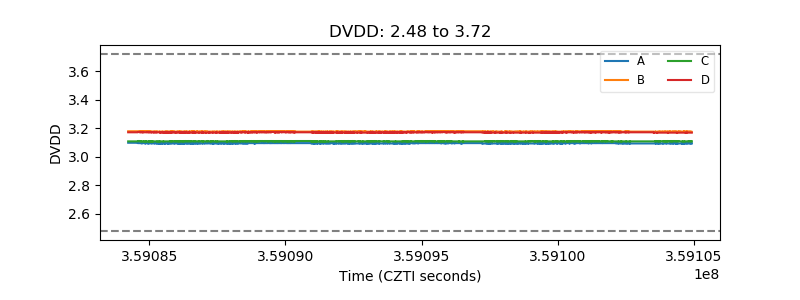 |
| Temperature 1 | 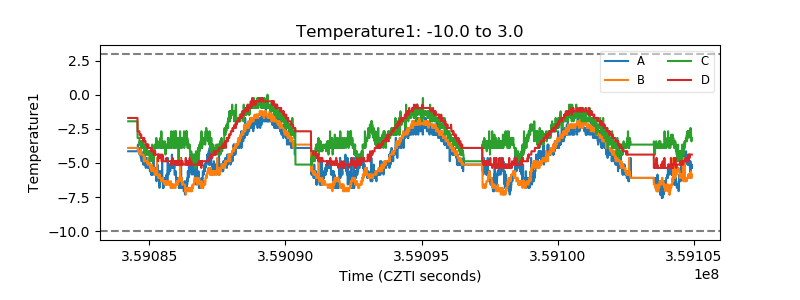 |
| Veto HV Monitor | 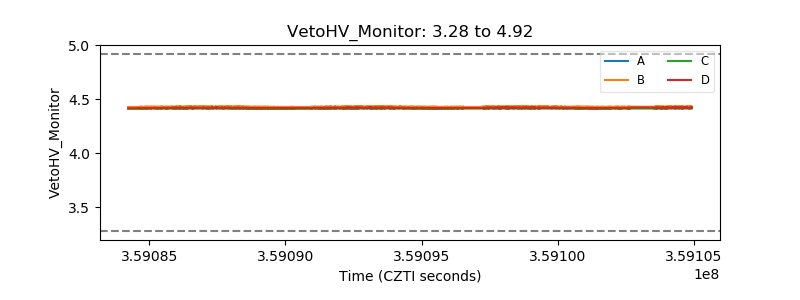 |
| Veto LLD | 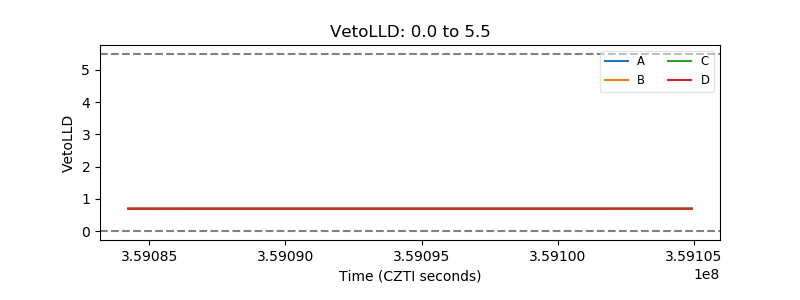 |
| Alpha Counter | 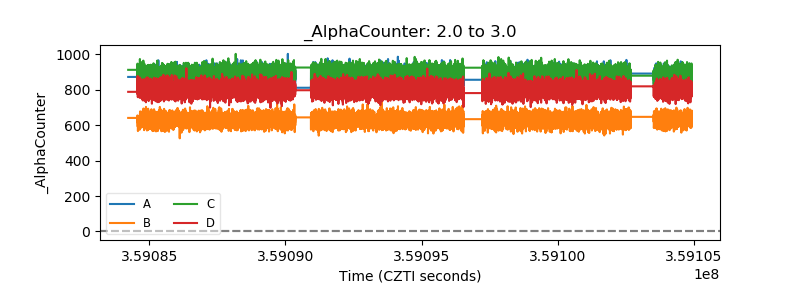 |
| _CPM_Rate | 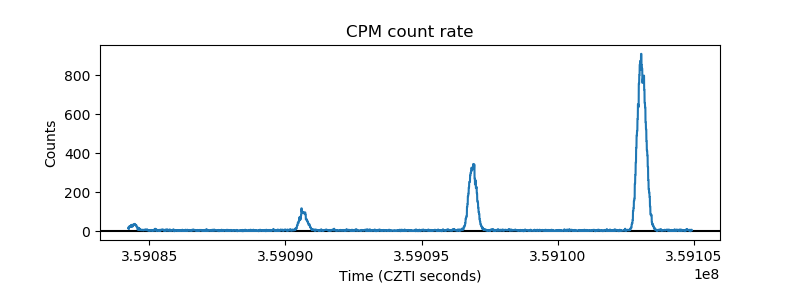 |
| CZT Counter | 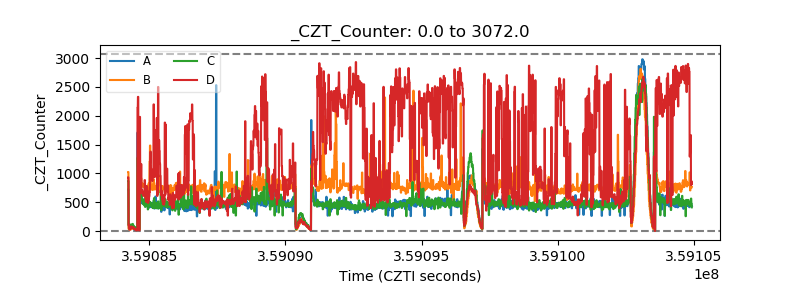 |
| +2.5 Volts monitor | 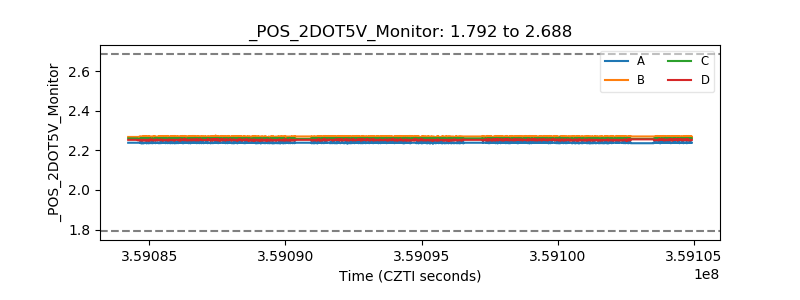 |
| +5 Volts monitor | 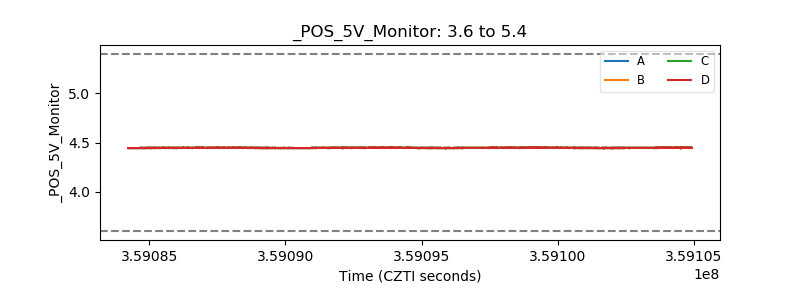 |
| _ROLL_ROT | 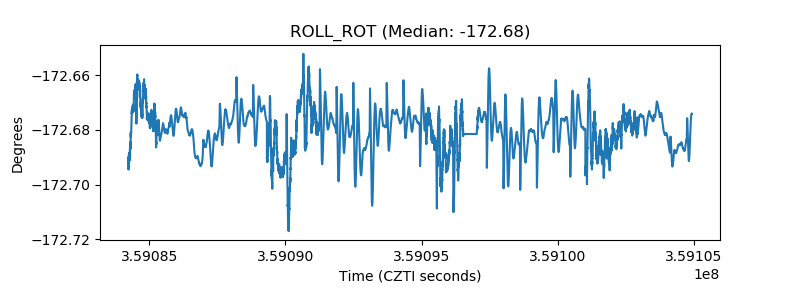 |
| _Roll_DEC | 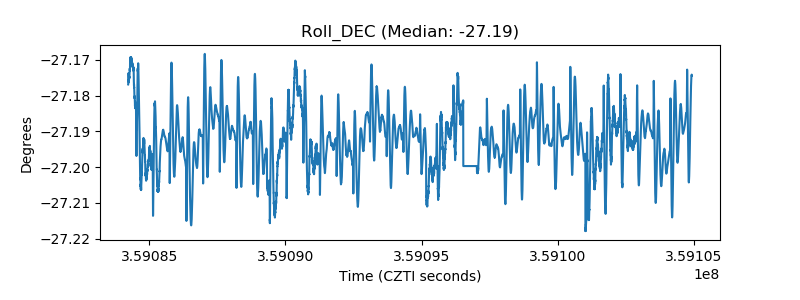 |
| _Roll_RA | 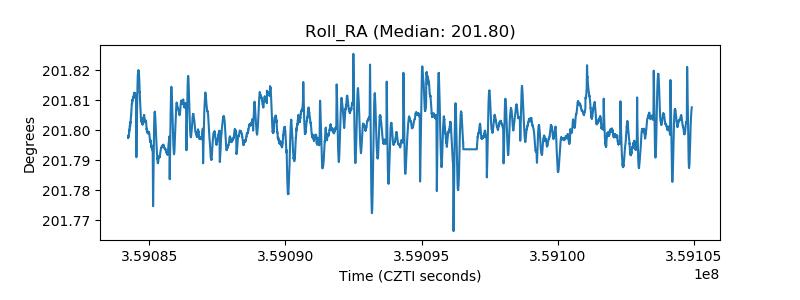 |
| Veto Counter | 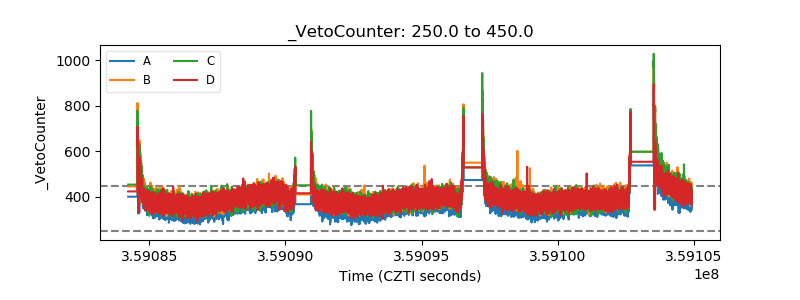 |