| Param | Original file | Final file |
|---|---|---|
| Filename | modeM0/AS1A10_058T04_9000004382_30494cztM0_level2.evt | modeM0/AS1A10_058T04_9000004382_30494cztM0_level2_quad_clean.evt |
| Size (bytes) | 526,893,120 | 46,457,280 |
| Size | 502.5 MB | 44.3 MB |
| Events in quadrant A | 2,046,766 | 302,219 |
| Events in quadrant B | 3,332,746 | 301,470 |
| Events in quadrant C | 2,119,325 | 292,189 |
| Events in quadrant D | 8,164,722 | 205,645 |
| Mode SS | |||
|---|---|---|---|
| Quadrant | BADHDUFLAG | Total packets | Discarded packets |
| A | 0 | 88 | 0 |
| B | 0 | 88 | 0 |
| C | 0 | 88 | 0 |
| D | 0 | 88 | 0 |
| Mode M9 | |||
|---|---|---|---|
| Quadrant | BADHDUFLAG | Total packets | Discarded packets |
| A | 0 | 2 | 0 |
| B | 0 | 3 | 0 |
| C | 0 | 3 | 0 |
| D | 0 | 3 | 0 |
| Mode M0 | |||
|---|---|---|---|
| Quadrant | BADHDUFLAG | Total packets | Discarded packets |
| A | 0 | 8800 | 1 |
| B | 0 | 13219 | 1 |
| C | 0 | 8935 | 1 |
| D | 0 | 27216 | 1 |
| Quadrant | Total seconds | Saturated seconds | Saturation percentage |
|---|---|---|---|
| A | 4326 | 22 | 0.508553% |
| B | 4326 | 37 | 0.855294% |
| C | 4326 | 48 | 1.109570% |
| D | 4326 | 2609 | 60.309755% |
Noise dominated data is calculated using 1-second bins in cleaned event files. If a bin has >2000 counts, and if more than 50% of those come from <1% of pixels, then it is considered to be noise-dominated and hence unusable.
| Quadrant | # 1 sec bins | Bins with >0 counts | Bins with >2000 counts | High rate bins dominated by noise | Noise dominated (total time) | Noise dominated (detector-on time) | Marked lightcurve |
|---|---|---|---|---|---|---|---|
| A | 4361 | 4327 | 0 | 0 | 0.00% | 0.00% | 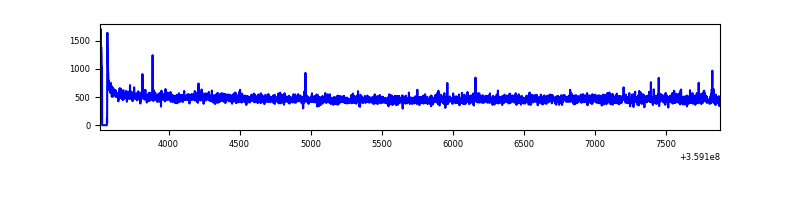 |
| B | 4361 | 4327 | 4 | 4 | 0.09% | 0.09% | 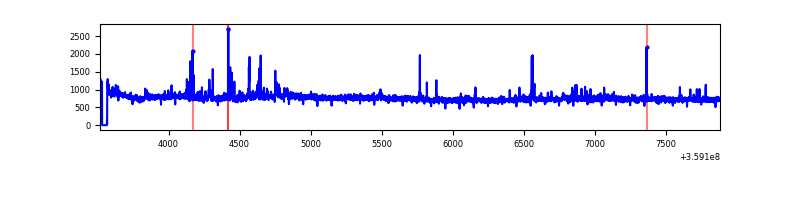 |
| C | 4361 | 4327 | 4 | 4 | 0.09% | 0.09% | 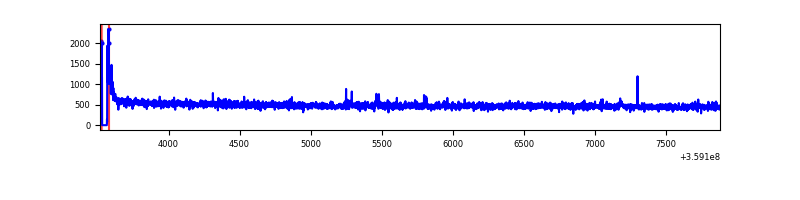 |
| D | 4361 | 4327 | 2270 | 2270 | 52.05% | 52.46% | 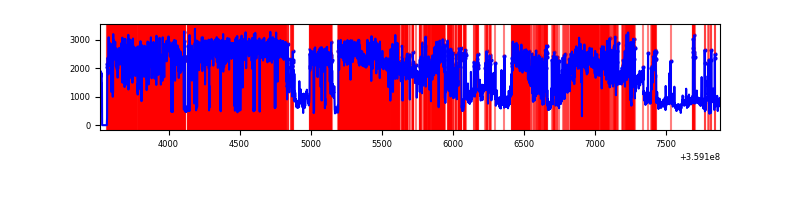 |
Top three noisy pixels from each quadrant. If the there are fewer than three noisy pixels in the level2.evt file, extra rows are filled as -1
| Pixel properties | Quadrant properties | ||||||
|---|---|---|---|---|---|---|---|
| Quadrant | DetID | PixID | Counts | Sigma | Mean | Median | Sigma |
| A | 8 | 192 | 13290 | 121.45 | 523 | 511 | 105.2 |
| A | 12 | 96 | 10917 | 98.9 | 523 | 511 | 105.2 |
| A | 13 | 254 | 7977 | 70.95 | 523 | 511 | 105.2 |
| B | 6 | 159 | 1169928 | 11791.62 | 515 | 503 | 99.2 |
| B | 0 | 229 | 108206 | 1086.0 | 515 | 503 | 99.2 |
| B | 12 | 111 | 12031 | 116.24 | 515 | 503 | 99.2 |
| C | 14 | 238 | 83532 | 707.76 | 498 | 501 | 117.3 |
| C | 3 | 233 | 40461 | 340.62 | 498 | 501 | 117.3 |
| C | 0 | 10 | 35688 | 299.93 | 498 | 501 | 117.3 |
| D | 12 | 218 | 5339769 | 79823.04 | 278 | 271 | 66.9 |
| D | 12 | 250 | 604082 | 9026.7 | 278 | 271 | 66.9 |
| D | 13 | 104 | 564238 | 8431.05 | 278 | 271 | 66.9 |
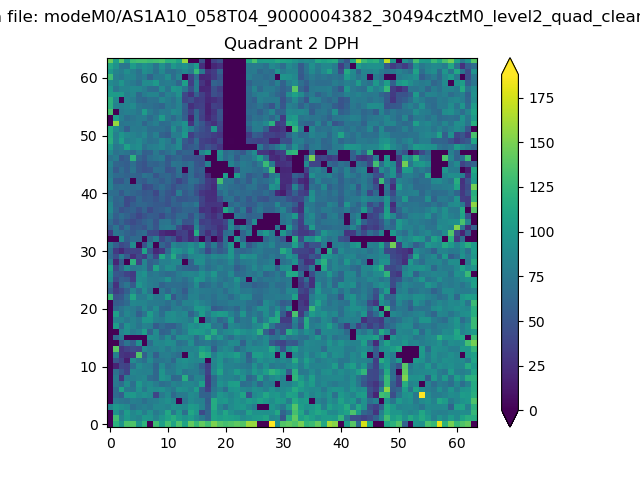
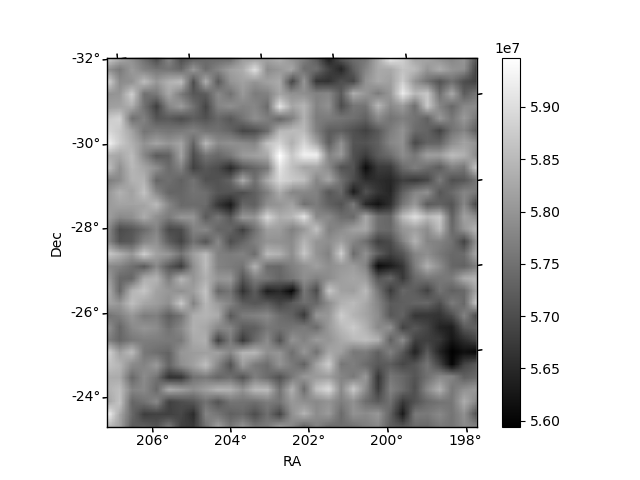
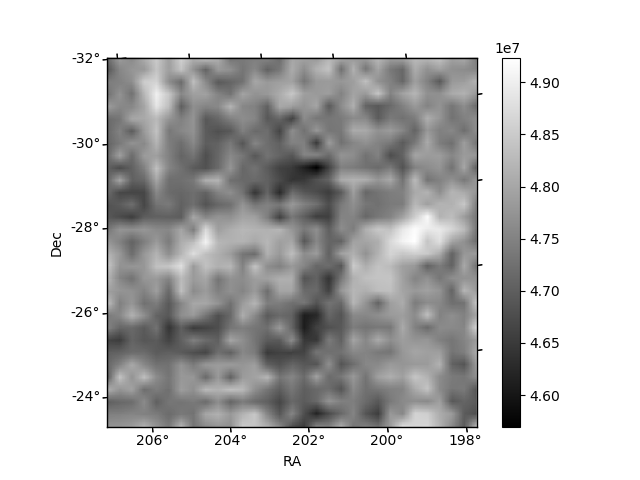
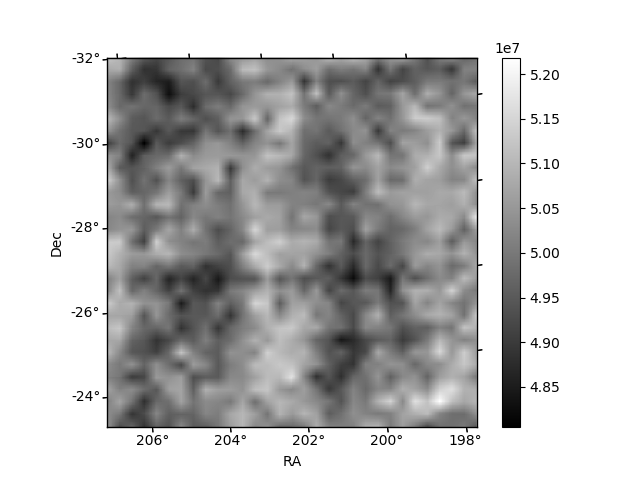
Histogram calculated using DETX and DETY for each event in the final _common_clean file
| Quadrant A | 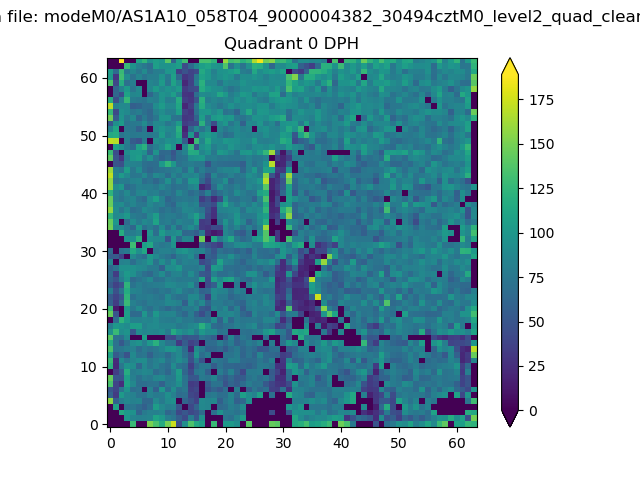 |
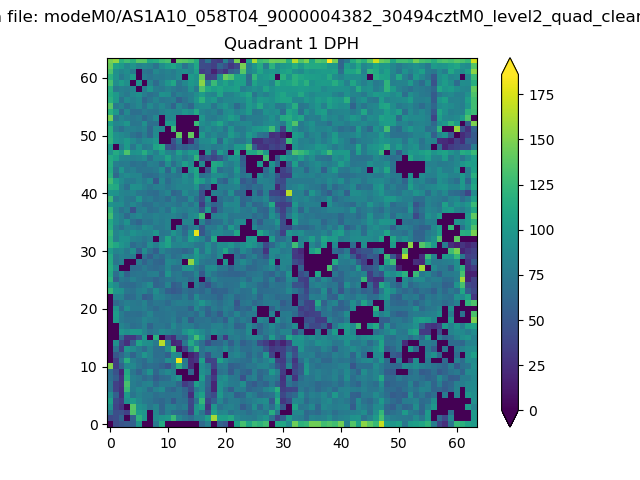 |
Quadrant B |
|---|---|---|---|
| Quadrant D | 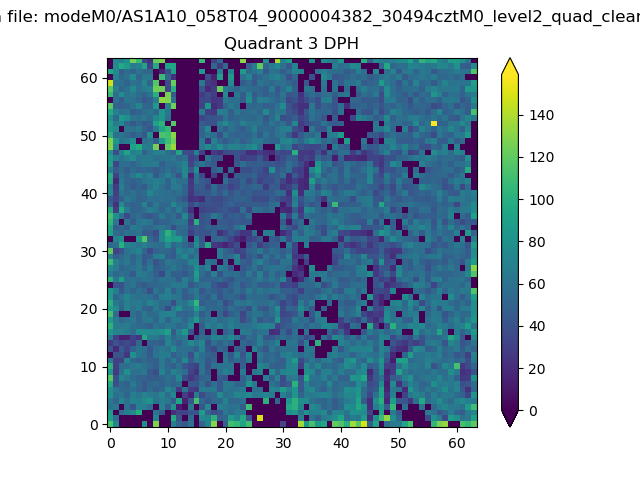 |
 |
Quadrant C |
| Plot type | Count rate plots | Images |
|---|---|---|
| Comparison with Poisson distribution Blue bars denote a histogram of data divided into 1 sec bins. Red curve is a Poisson curve with rate = median count rate of data. |
 |
 |
| Quadrant-wise count rates Data is divided into 100 sec bins |
 |
|
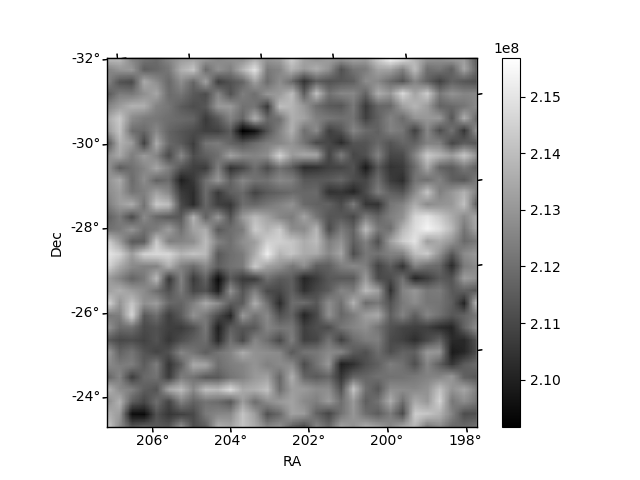
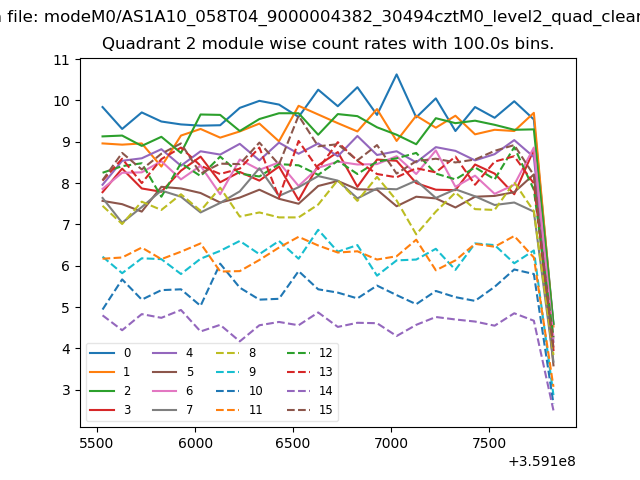
| Module-wise count rates for Quadrant A Data is divided into 100 sec bins |
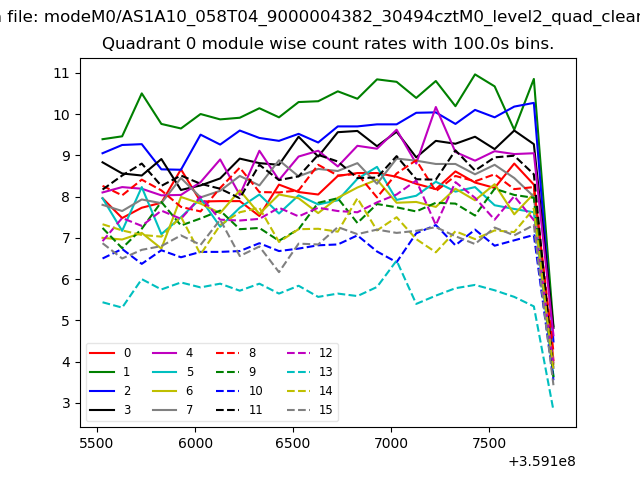 |
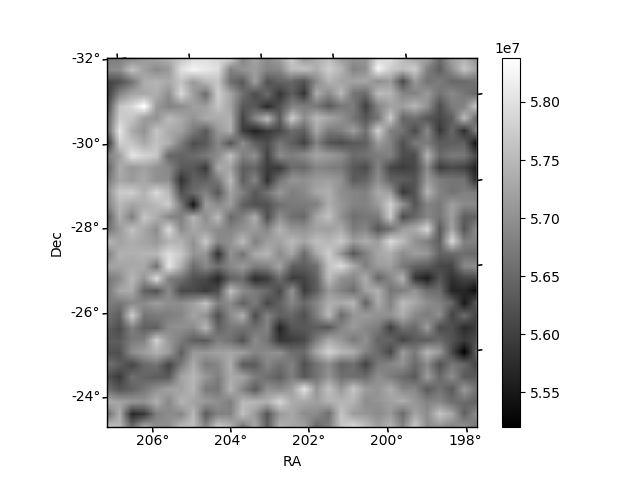 |
| Module-wise count rates for Quadrant B Data is divided into 100 sec bins |
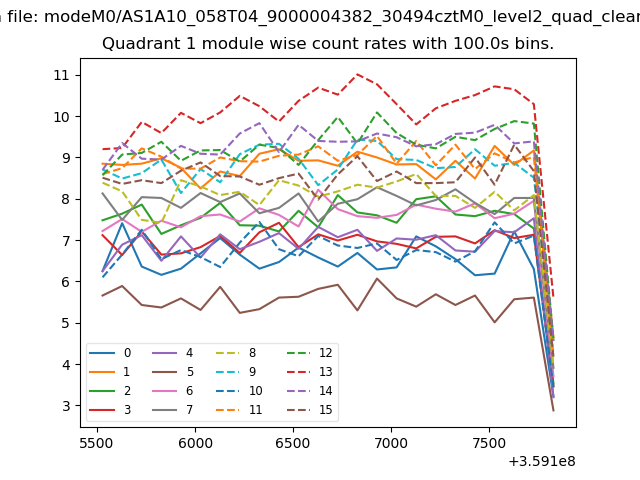 |
 |
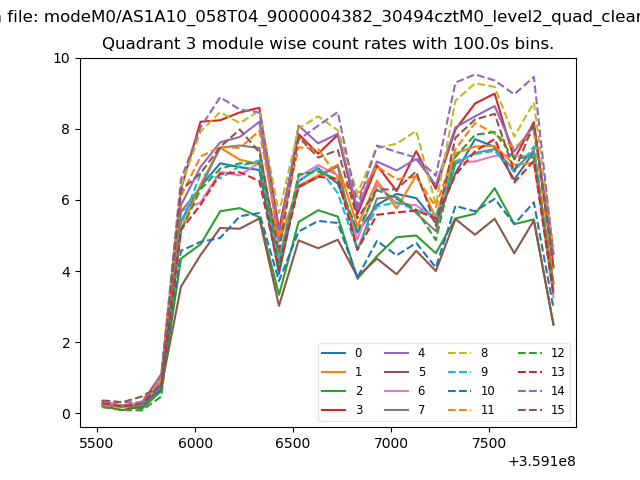
| Module-wise count rates for Quadrant C Data is divided into 100 sec bins |
 |
 |
| Module-wise count rates for Quadrant D Data is divided into 100 sec bins |
 |
 |
| Parameter | Plot |
|---|---|
| CZT HV Monitor | 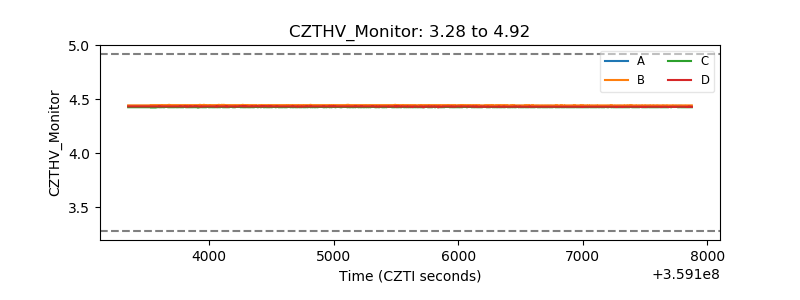 |
| D_VDD | 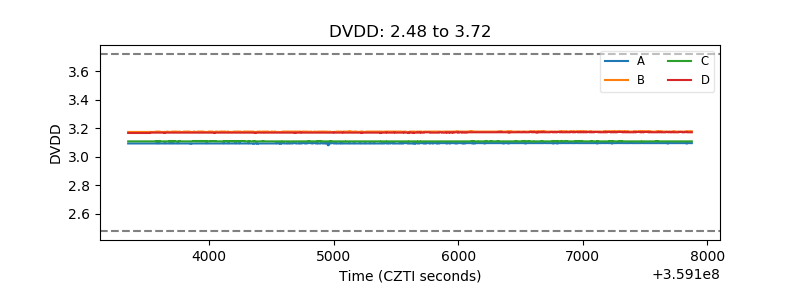 |
| Temperature 1 | 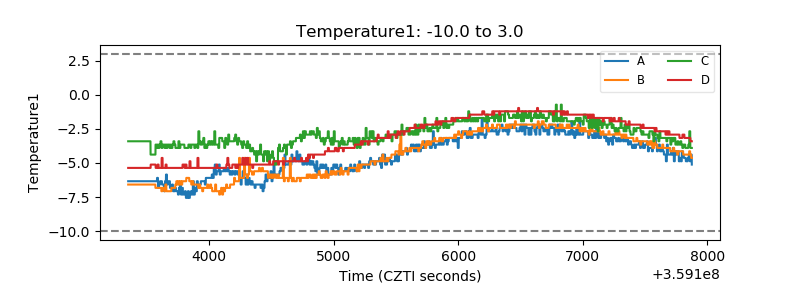 |
| Veto HV Monitor |  |
| Veto LLD | 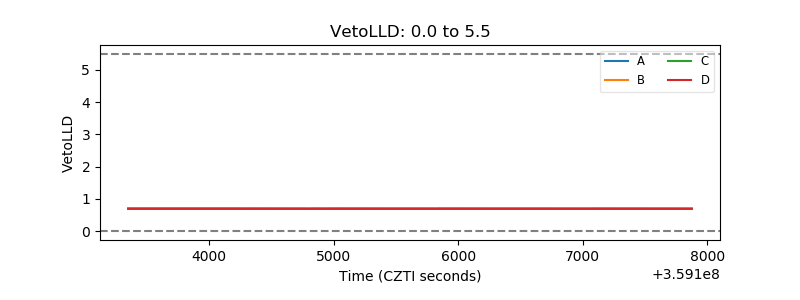 |
| Alpha Counter |  |
| _CPM_Rate | 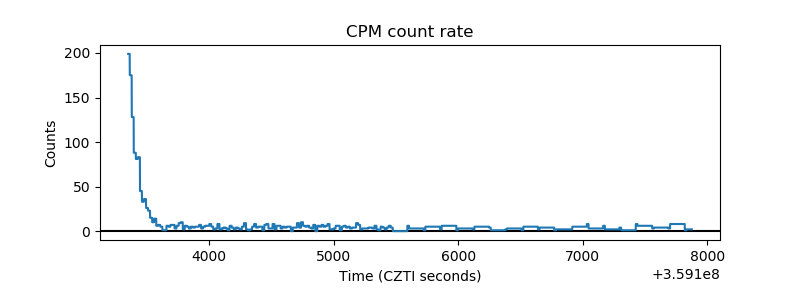 |
| CZT Counter | 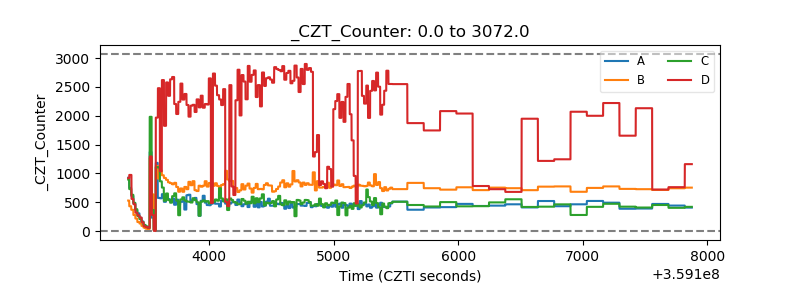 |
| +2.5 Volts monitor |  |
| +5 Volts monitor |  |
| _ROLL_ROT | 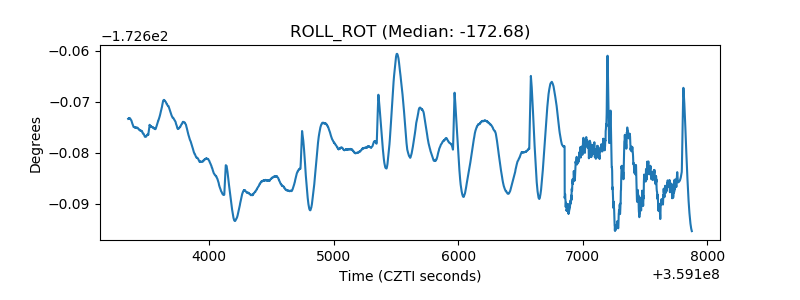 |
| _Roll_DEC | 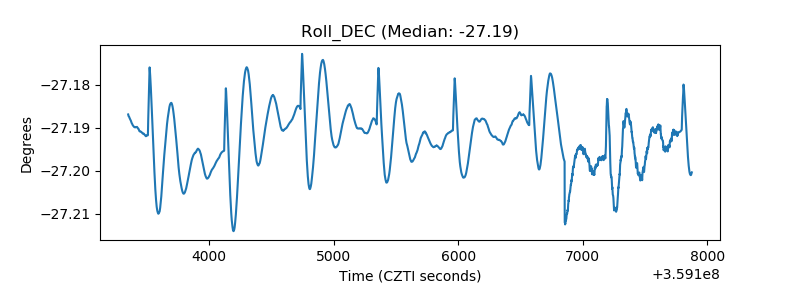 |
| _Roll_RA | 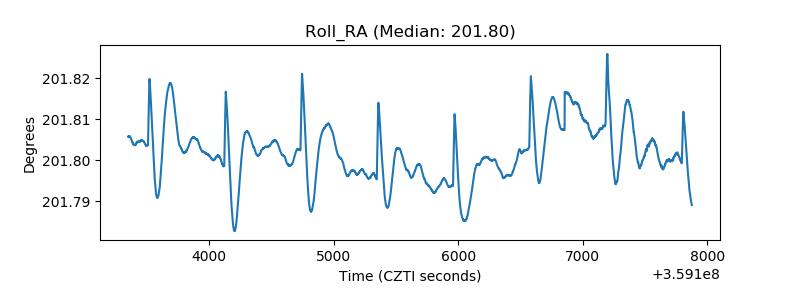 |
| Veto Counter | 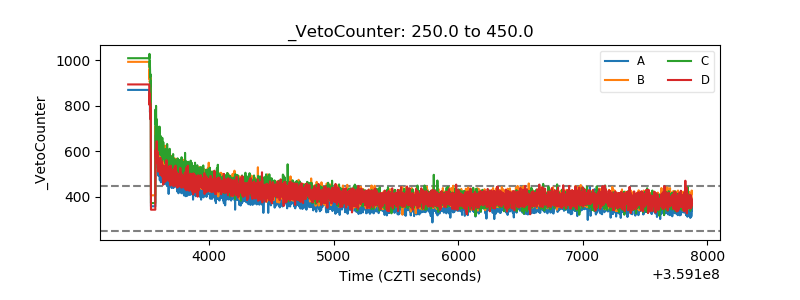 |