| Param | Original file | Final file |
|---|---|---|
| Filename | modeM0/AS1A10_053T22_9000004384cztM0_level2.fits | modeM0/AS1A10_053T22_9000004384cztM0_level2_quad_clean.evt |
| Size (bytes) | 254,790,720 | 98,902,080 |
| Size | 243.0 MB | 94.3 MB |
| Events in quadrant A | 1,677,022 | 371,123 |
| Events in quadrant B | 1,564,274 | 366,242 |
| Events in quadrant C | 1,549,498 | 344,921 |
| Events in quadrant D | 1,323,300 | 308,290 |
| Mode M9 | |||
|---|---|---|---|
| Quadrant | BADHDUFLAG | Total packets | Discarded packets |
| A | 0 | 57 | 0 |
| B | 0 | 57 | 0 |
| C | 0 | 57 | 0 |
| D | 0 | 57 | 0 |
| Mode SS | |||
|---|---|---|---|
| Quadrant | BADHDUFLAG | Total packets | Discarded packets |
| A | 0 | 472 | 0 |
| B | 0 | 472 | 0 |
| C | 0 | 472 | 0 |
| D | 0 | 472 | 0 |
| Mode M0 | |||
|---|---|---|---|
| Quadrant | BADHDUFLAG | Total packets | Discarded packets |
| A | 0 | 51249 | 0 |
| B | 0 | 71455 | 0 |
| C | 0 | 54471 | 0 |
| D | 0 | 75082 | 0 |
| Quadrant | Total seconds | Saturated seconds | Saturation percentage |
|---|---|---|---|
| A | 23276 | 308 | 1.323251% |
| B | 23276 | 397 | 1.705620% |
| C | 23276 | 617 | 2.650799% |
| D | 23276 | 2453 | 10.538752% |
Noise dominated data is calculated using 1-second bins in cleaned event files. If a bin has >2000 counts, and if more than 50% of those come from <1% of pixels, then it is considered to be noise-dominated and hence unusable.
| Quadrant | # 1 sec bins | Bins with >0 counts | Bins with >2000 counts | High rate bins dominated by noise | Noise dominated (total time) | Noise dominated (detector-on time) | Marked lightcurve |
|---|---|---|---|---|---|---|---|
| A | 28249 | 23272 | 0 | 0 | 0.00% | 0.00% |  |
| B | 28249 | 23273 | 0 | 0 | 0.00% | 0.00% |  |
| C | 28249 | 23273 | 0 | 0 | 0.00% | 0.00% |  |
| D | 28249 | 23180 | 0 | 0 | 0.00% | 0.00% |  |
Top three noisy pixels from each quadrant. If the there are fewer than three noisy pixels in the level2.evt file, extra rows are filled as -1
| Pixel properties | Quadrant properties | ||||||
|---|---|---|---|---|---|---|---|
| Quadrant | DetID | PixID | Counts | Sigma | Mean | Median | Sigma |
| A | 0 | 29 | 1566 | 10.95 | 437 | 415 | 105.2 |
| A | 9 | 19 | 1240 | 7.85 | 437 | 415 | 105.2 |
| A | 0 | 30 | 1224 | 7.69 | 437 | 415 | 105.2 |
| B | 2 | 9 | 1214 | 9.87 | 413 | 398 | 82.7 |
| B | 3 | 80 | 1095 | 8.43 | 413 | 398 | 82.7 |
| B | 5 | 255 | 1041 | 7.78 | 413 | 398 | 82.7 |
| C | 1 | 81 | 1222 | 7.99 | 410 | 387 | 104.5 |
| C | 1 | 80 | 1186 | 7.65 | 410 | 387 | 104.5 |
| C | 12 | 241 | 1108 | 6.9 | 410 | 387 | 104.5 |
| D | 15 | 46 | 1042 | 7.0 | 378 | 348 | 99.1 |
| D | 10 | 189 | 956 | 6.14 | 378 | 348 | 99.1 |
| D | 6 | 67 | 940 | 5.97 | 378 | 348 | 99.1 |
Histogram calculated using DETX and DETY for each event in the final _common_clean file
| Quadrant A | 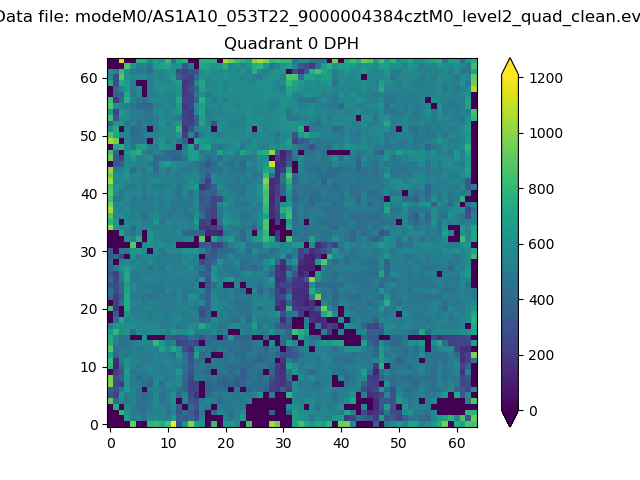 |
 |
Quadrant B |
|---|---|---|---|
| Quadrant D |  |
 |
Quadrant C |
| Plot type | Count rate plots | Images |
|---|---|---|
| Comparison with Poisson distribution Blue bars denote a histogram of data divided into 1 sec bins. Red curve is a Poisson curve with rate = median count rate of data. |
 |
 |
| Quadrant-wise count rates Data is divided into 100 sec bins |
 |
|
| Module-wise count rates for Quadrant A Data is divided into 100 sec bins |
 |
 |
| Module-wise count rates for Quadrant B Data is divided into 100 sec bins |
 |
 |
| Module-wise count rates for Quadrant C Data is divided into 100 sec bins |
 |
 |
| Module-wise count rates for Quadrant D Data is divided into 100 sec bins |
 |
 |
| Parameter | Plot |
|---|---|
| CZT HV Monitor |  |
| D_VDD |  |
| Temperature 1 |  |
| Veto HV Monitor |  |
| Veto LLD |  |
| Alpha Counter |  |
| _CPM_Rate |  |
| CZT Counter |  |
| +2.5 Volts monitor |  |
| +5 Volts monitor |  |
| _ROLL_ROT |  |
| _Roll_DEC |  |
| _Roll_RA |  |
| Veto Counter |  |