| Param | Original file | Final file |
|---|---|---|
| Filename | modeM0/AS1A10_053T22_9000004384_30494cztM0_level2.evt | modeM0/AS1A10_053T22_9000004384_30494cztM0_level2_quad_clean.evt |
| Size (bytes) | 165,582,720 | 28,062,720 |
| Size | 157.9 MB | 26.8 MB |
| Events in quadrant A | 737,052 | 212,627 |
| Events in quadrant B | 1,113,543 | 211,895 |
| Events in quadrant C | 857,629 | 199,449 |
| Events in quadrant D | 2,209,710 | 121,658 |
| Mode M9 | |||
|---|---|---|---|
| Quadrant | BADHDUFLAG | Total packets | Discarded packets |
| A | 0 | 7 | 0 |
| B | 0 | 7 | 0 |
| C | 0 | 7 | 0 |
| D | 0 | 7 | 0 |
| Mode SS | |||
|---|---|---|---|
| Quadrant | BADHDUFLAG | Total packets | Discarded packets |
| A | 0 | 28 | 0 |
| B | 0 | 28 | 0 |
| C | 0 | 28 | 0 |
| D | 0 | 28 | 0 |
| Mode M0 | |||
|---|---|---|---|
| Quadrant | BADHDUFLAG | Total packets | Discarded packets |
| A | 0 | 2987 | 1 |
| B | 0 | 4214 | 1 |
| C | 0 | 3426 | 1 |
| D | 0 | 7447 | 1 |
| Quadrant | Total seconds | Saturated seconds | Saturation percentage |
|---|---|---|---|
| A | 1387 | 11 | 0.793079% |
| B | 1387 | 14 | 1.009373% |
| C | 1386 | 56 | 4.040404% |
| D | 1386 | 764 | 55.122655% |
Noise dominated data is calculated using 1-second bins in cleaned event files. If a bin has >2000 counts, and if more than 50% of those come from <1% of pixels, then it is considered to be noise-dominated and hence unusable.
| Quadrant | # 1 sec bins | Bins with >0 counts | Bins with >2000 counts | High rate bins dominated by noise | Noise dominated (total time) | Noise dominated (detector-on time) | Marked lightcurve |
|---|---|---|---|---|---|---|---|
| A | 1387 | 1387 | 0 | 0 | 0.00% | 0.00% | 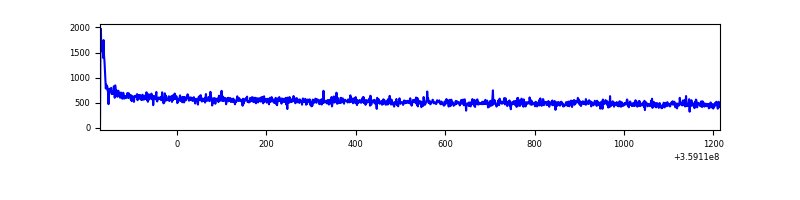 |
| B | 1387 | 1387 | 0 | 0 | 0.00% | 0.00% | 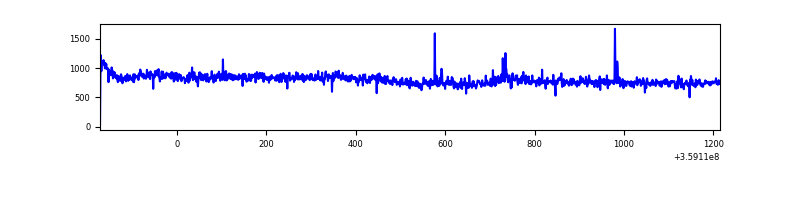 |
| C | 1386 | 1386 | 13 | 13 | 0.94% | 0.94% | 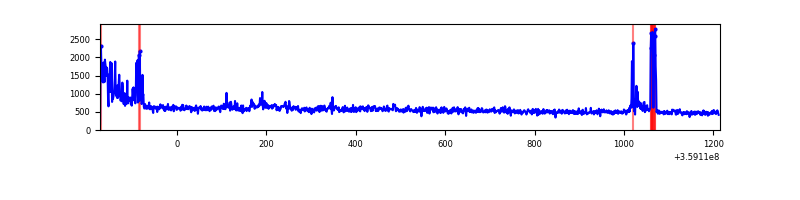 |
| D | 1386 | 1386 | 712 | 712 | 51.37% | 51.37% | 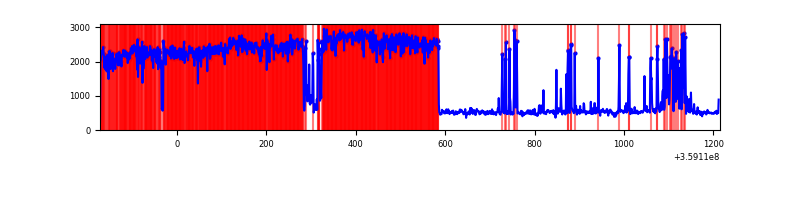 |
Top three noisy pixels from each quadrant. If the there are fewer than three noisy pixels in the level2.evt file, extra rows are filled as -1
| Pixel properties | Quadrant properties | ||||||
|---|---|---|---|---|---|---|---|
| Quadrant | DetID | PixID | Counts | Sigma | Mean | Median | Sigma |
| A | 8 | 192 | 10910 | 278.17 | 187 | 184 | 38.6 |
| A | 13 | 254 | 2486 | 59.7 | 187 | 184 | 38.6 |
| A | 12 | 96 | 2140 | 50.73 | 187 | 184 | 38.6 |
| B | 6 | 159 | 380647 | 10284.9 | 183 | 179 | 37.0 |
| B | 0 | 230 | 5618 | 147.03 | 183 | 179 | 37.0 |
| B | 0 | 229 | 5457 | 142.68 | 183 | 179 | 37.0 |
| C | 0 | 10 | 49157 | 1127.08 | 179 | 180 | 43.5 |
| C | 3 | 233 | 41181 | 943.53 | 179 | 180 | 43.5 |
| C | 10 | 22 | 36222 | 829.42 | 179 | 180 | 43.5 |
| D | 12 | 218 | 880587 | 30238.47 | 116 | 113 | 29.1 |
| D | 12 | 250 | 396923 | 13627.8 | 116 | 113 | 29.1 |
| D | 12 | 202 | 158094 | 5425.6 | 116 | 113 | 29.1 |
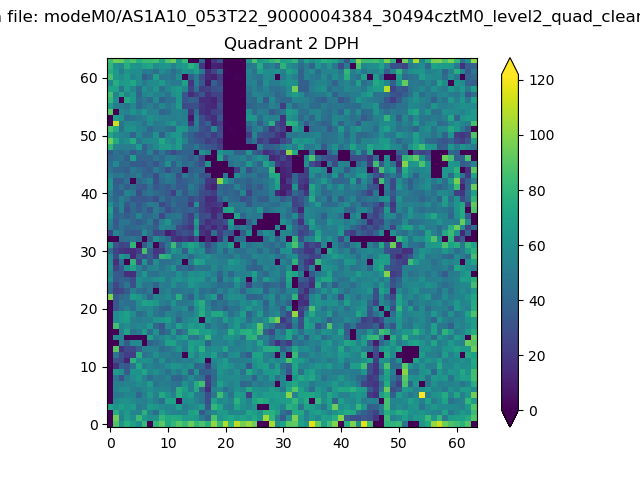
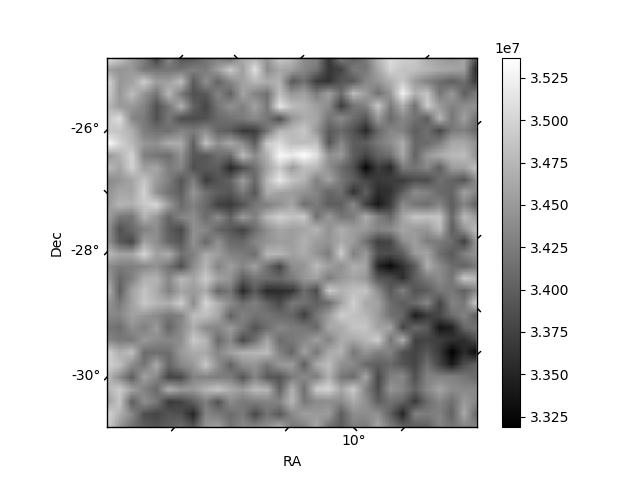
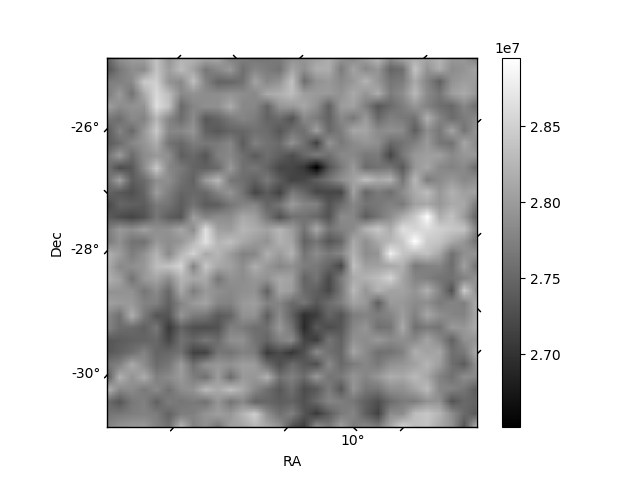
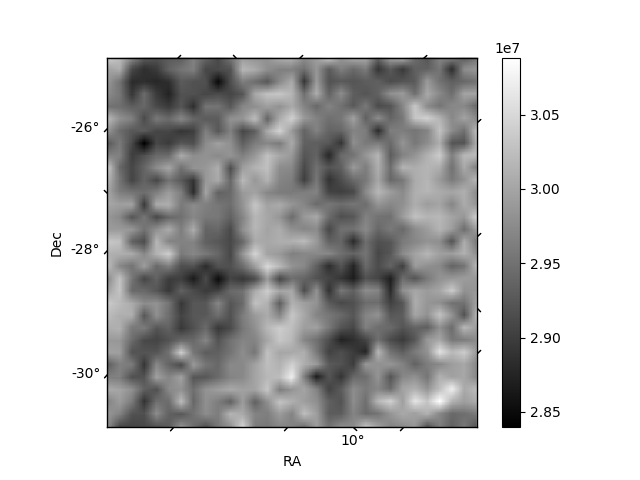
Histogram calculated using DETX and DETY for each event in the final _common_clean file
| Quadrant A | 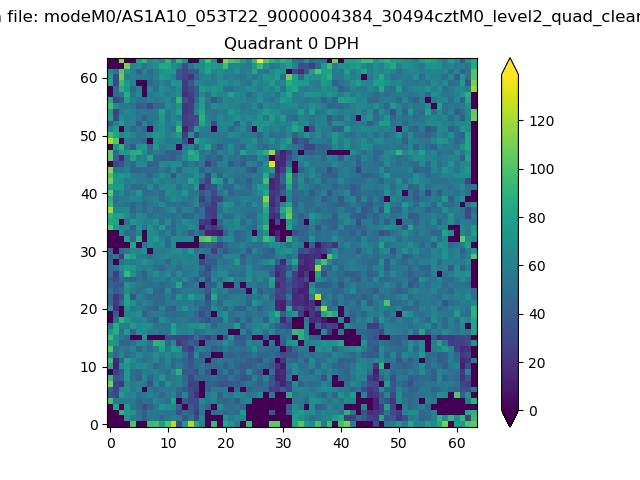 |
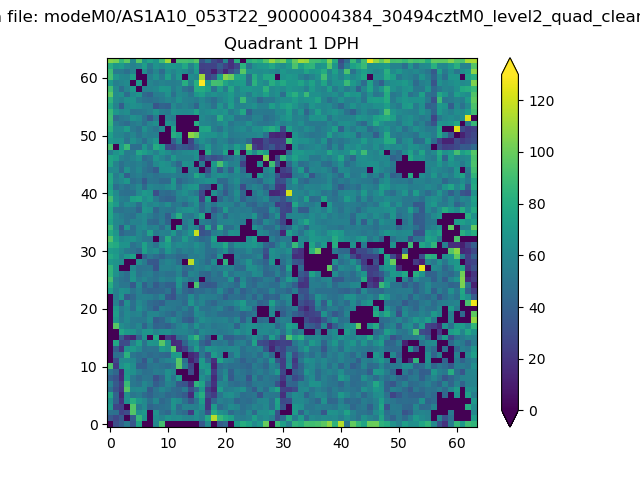 |
Quadrant B |
|---|---|---|---|
| Quadrant D | 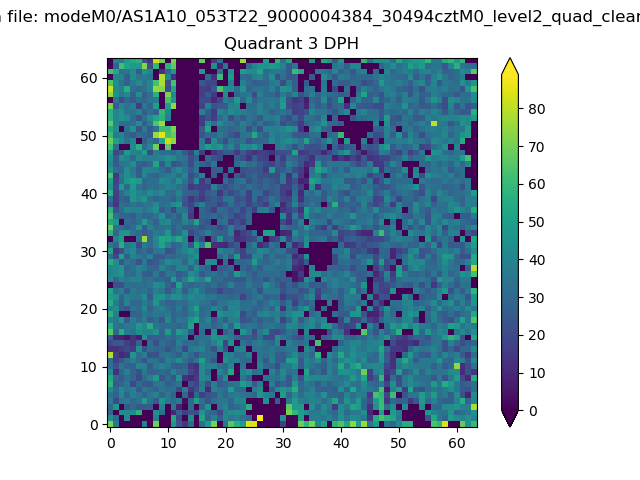 |
 |
Quadrant C |
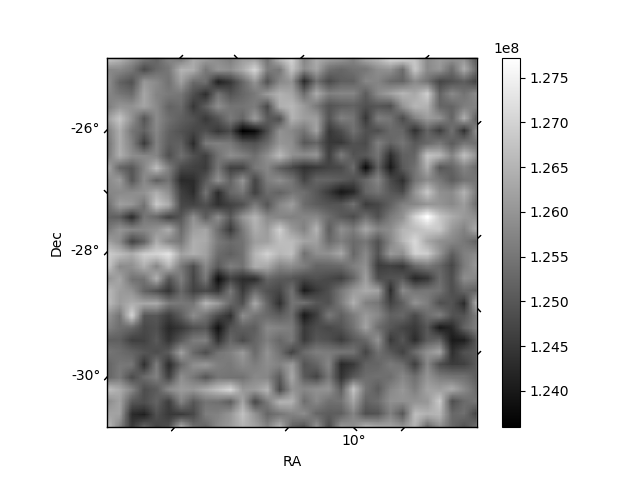
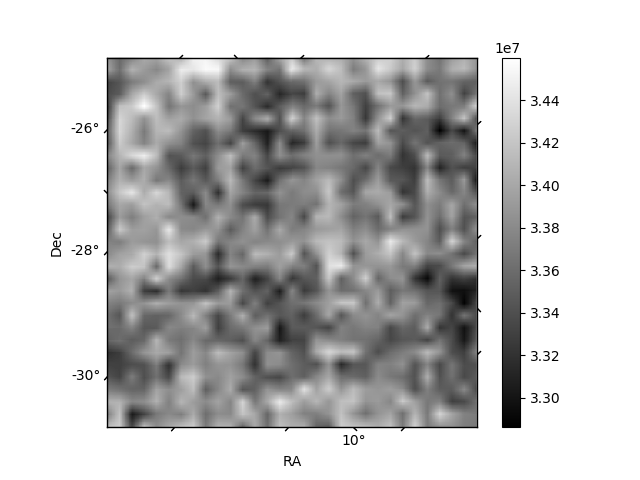
| Plot type | Count rate plots | Images |
|---|---|---|
| Comparison with Poisson distribution Blue bars denote a histogram of data divided into 1 sec bins. Red curve is a Poisson curve with rate = median count rate of data. |
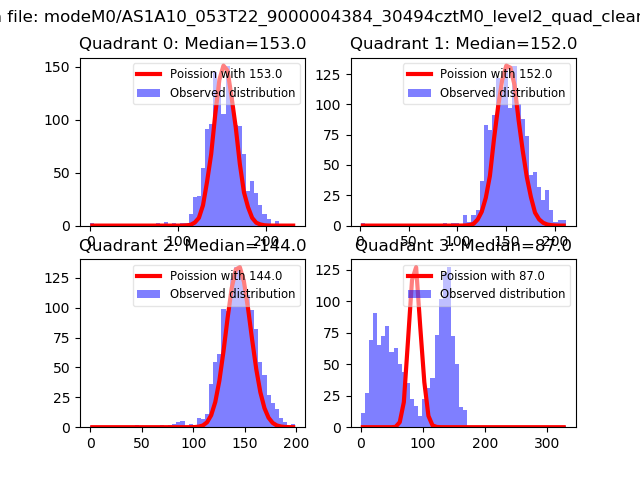 |
 |
| Quadrant-wise count rates Data is divided into 100 sec bins |
 |
|
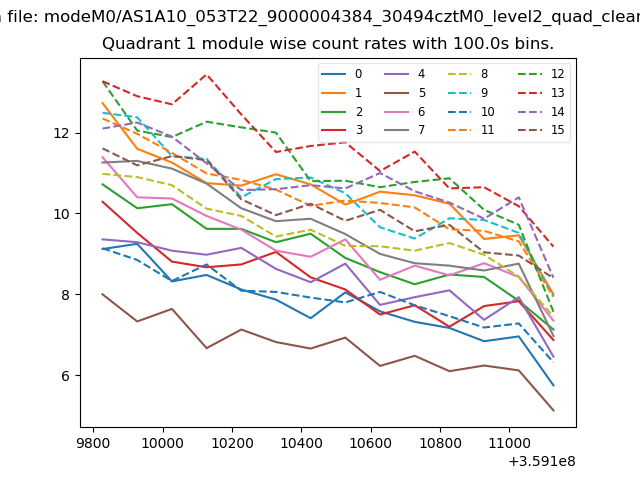
| Module-wise count rates for Quadrant A Data is divided into 100 sec bins |
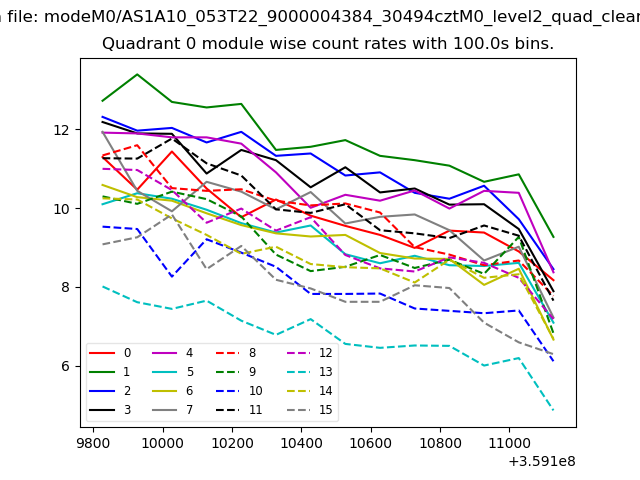 |
 |
| Module-wise count rates for Quadrant B Data is divided into 100 sec bins |
 |
 |
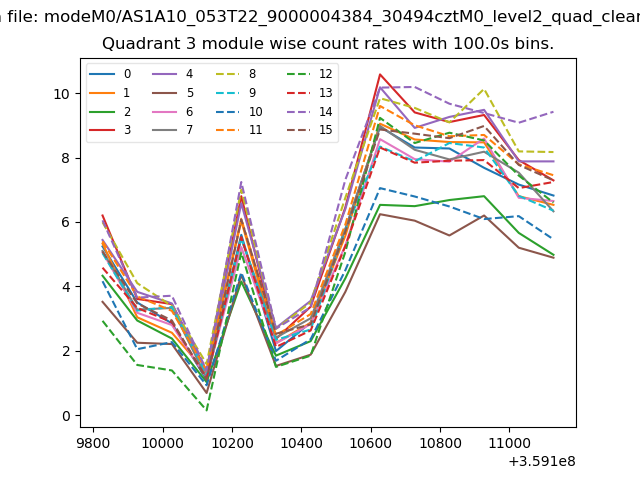
| Module-wise count rates for Quadrant C Data is divided into 100 sec bins |
 |
 |
| Module-wise count rates for Quadrant D Data is divided into 100 sec bins |
 |
 |
| Parameter | Plot |
|---|---|
| CZT HV Monitor | 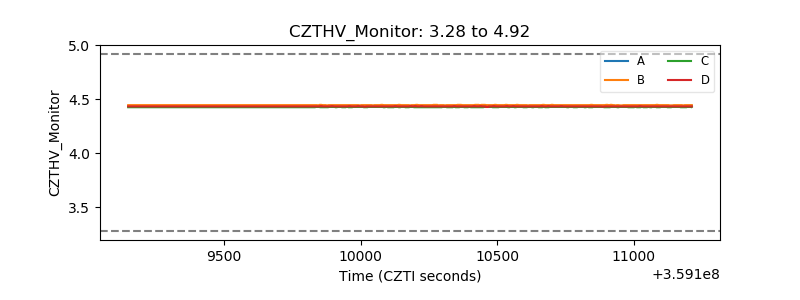 |
| D_VDD | 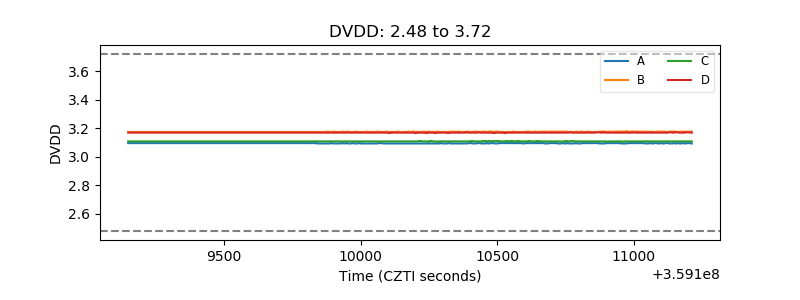 |
| Temperature 1 | 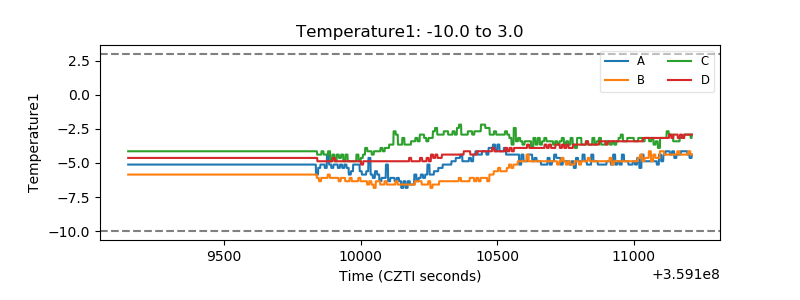 |
| Veto HV Monitor | 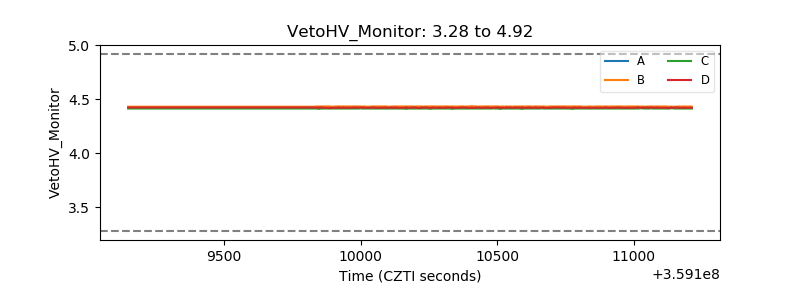 |
| Veto LLD | 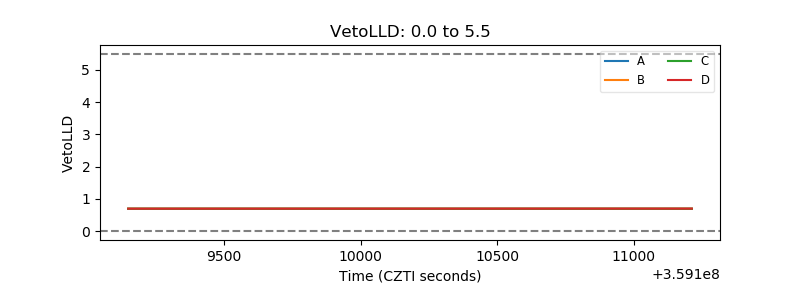 |
| Alpha Counter | 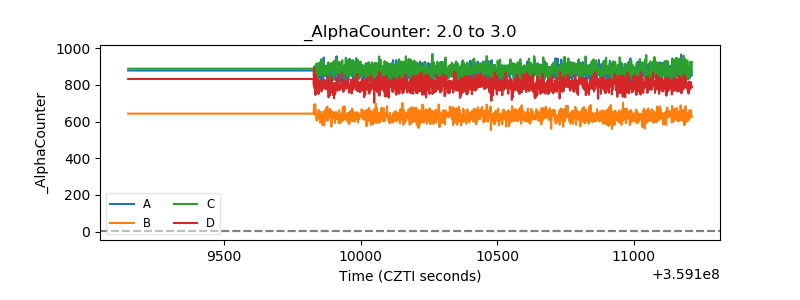 |
| _CPM_Rate | 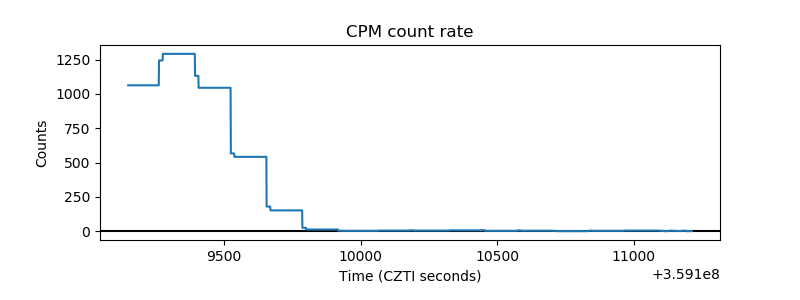 |
| CZT Counter | 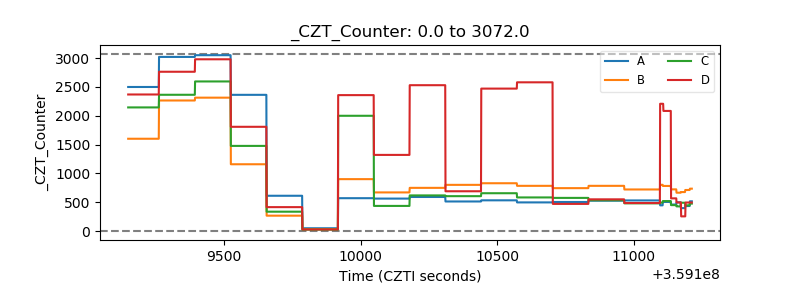 |
| +2.5 Volts monitor | 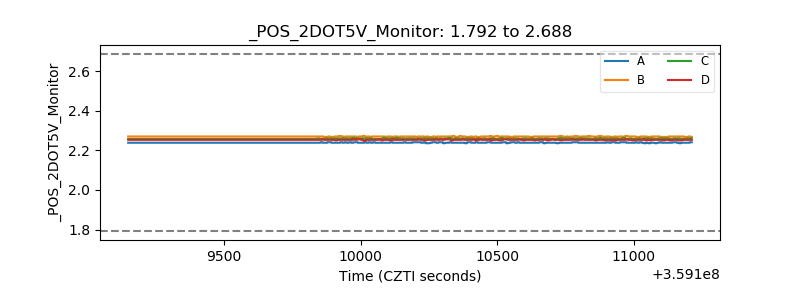 |
| +5 Volts monitor |  |
| _ROLL_ROT | 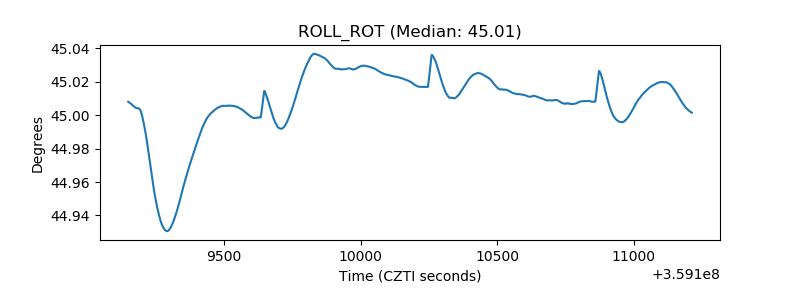 |
| _Roll_DEC | 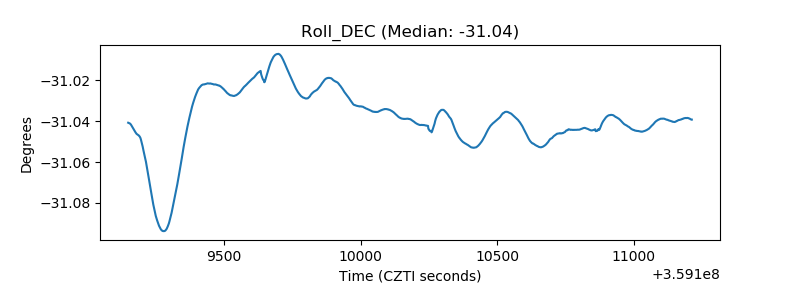 |
| _Roll_RA | 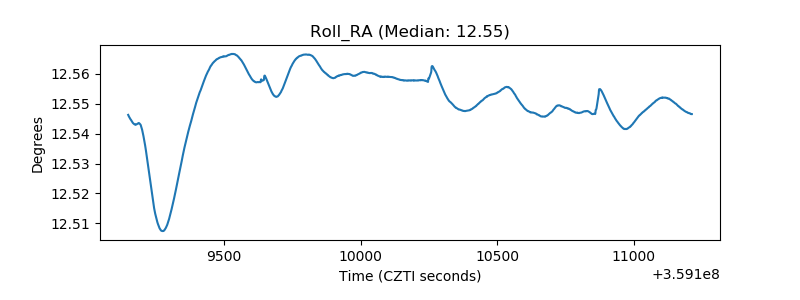 |
| Veto Counter | 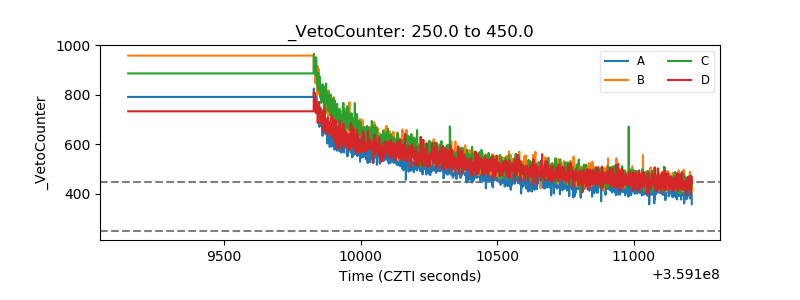 |