| Param | Original file | Final file |
|---|---|---|
| Filename | modeM0/AS1A10_053T22_9000004384_30497cztM0_level2.evt | modeM0/AS1A10_053T22_9000004384_30497cztM0_level2_quad_clean.evt |
| Size (bytes) | 525,841,920 | 81,861,120 |
| Size | 501.5 MB | 78.1 MB |
| Events in quadrant A | 2,973,705 | 542,243 |
| Events in quadrant B | 4,508,527 | 540,281 |
| Events in quadrant C | 3,318,867 | 503,282 |
| Events in quadrant D | 4,741,880 | 498,455 |
| Mode M9 | |||
|---|---|---|---|
| Quadrant | BADHDUFLAG | Total packets | Discarded packets |
| A | 0 | 13 | 0 |
| B | 0 | 13 | 0 |
| C | 0 | 13 | 0 |
| D | 0 | 13 | 0 |
| Mode SS | |||
|---|---|---|---|
| Quadrant | BADHDUFLAG | Total packets | Discarded packets |
| A | 0 | 112 | 0 |
| B | 0 | 112 | 0 |
| C | 0 | 112 | 0 |
| D | 0 | 112 | 0 |
| Mode M0 | |||
|---|---|---|---|
| Quadrant | BADHDUFLAG | Total packets | Discarded packets |
| A | 0 | 12187 | 1 |
| B | 0 | 17351 | 1 |
| C | 0 | 13369 | 1 |
| D | 0 | 17873 | 1 |
| Quadrant | Total seconds | Saturated seconds | Saturation percentage |
|---|---|---|---|
| A | 5651 | 58 | 1.026367% |
| B | 5651 | 89 | 1.574942% |
| C | 5651 | 142 | 2.512830% |
| D | 5652 | 597 | 10.562633% |
Noise dominated data is calculated using 1-second bins in cleaned event files. If a bin has >2000 counts, and if more than 50% of those come from <1% of pixels, then it is considered to be noise-dominated and hence unusable.
| Quadrant | # 1 sec bins | Bins with >0 counts | Bins with >2000 counts | High rate bins dominated by noise | Noise dominated (total time) | Noise dominated (detector-on time) | Marked lightcurve |
|---|---|---|---|---|---|---|---|
| A | 6871 | 5652 | 3 | 3 | 0.04% | 0.05% | 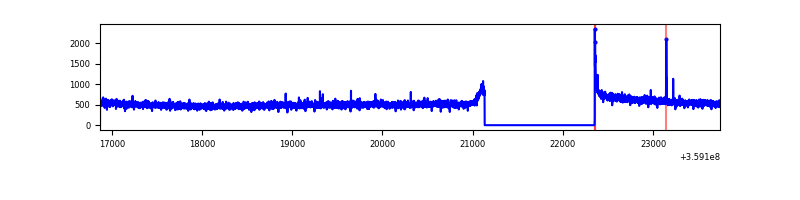 |
| B | 6871 | 5652 | 1 | 1 | 0.01% | 0.02% | 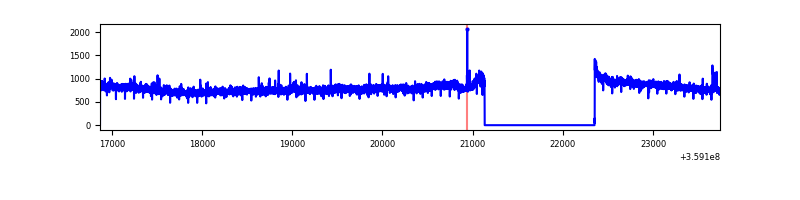 |
| C | 6871 | 5652 | 34 | 34 | 0.49% | 0.60% | 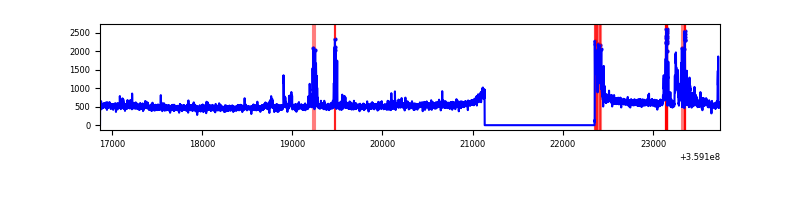 |
| D | 6872 | 5653 | 387 | 387 | 5.63% | 6.85% | 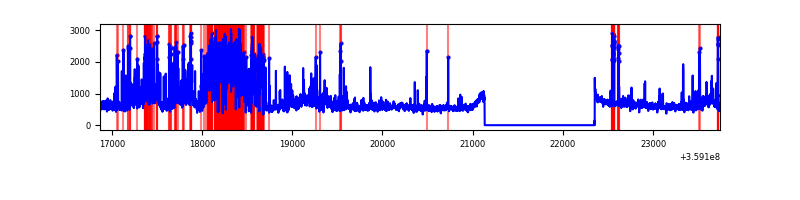 |
Top three noisy pixels from each quadrant. If the there are fewer than three noisy pixels in the level2.evt file, extra rows are filled as -1
| Pixel properties | Quadrant properties | ||||||
|---|---|---|---|---|---|---|---|
| Quadrant | DetID | PixID | Counts | Sigma | Mean | Median | Sigma |
| A | 8 | 192 | 11162 | 68.54 | 765 | 753 | 151.9 |
| A | 13 | 254 | 9977 | 60.74 | 765 | 753 | 151.9 |
| A | 4 | 2 | 8368 | 50.14 | 765 | 753 | 151.9 |
| B | 6 | 159 | 1512072 | 10666.88 | 745 | 729 | 141.7 |
| B | 0 | 229 | 63978 | 446.4 | 745 | 729 | 141.7 |
| B | 12 | 111 | 16809 | 113.49 | 745 | 729 | 141.7 |
| C | 10 | 22 | 186894 | 1128.57 | 708 | 714 | 165.0 |
| C | 3 | 233 | 168856 | 1019.23 | 708 | 714 | 165.0 |
| C | 14 | 238 | 117034 | 705.1 | 708 | 714 | 165.0 |
| D | 1 | 52 | 1218033 | 7460.52 | 699 | 684 | 163.2 |
| D | 8 | 195 | 264128 | 1614.51 | 699 | 684 | 163.2 |
| D | 13 | 104 | 240670 | 1470.75 | 699 | 684 | 163.2 |
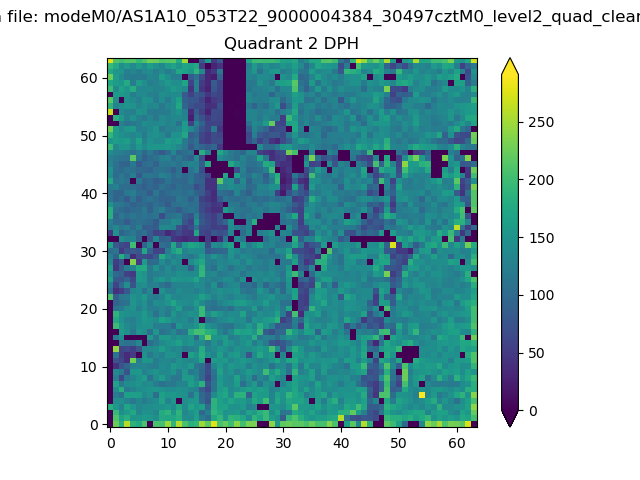
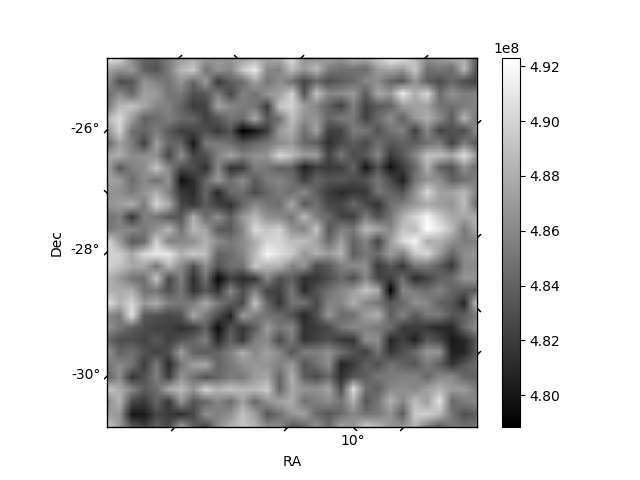
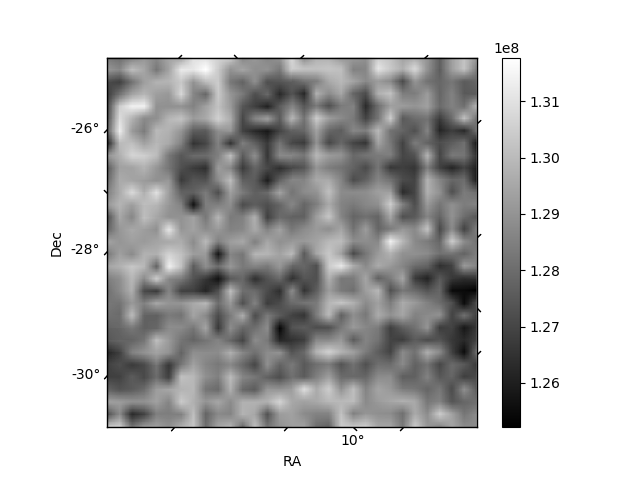
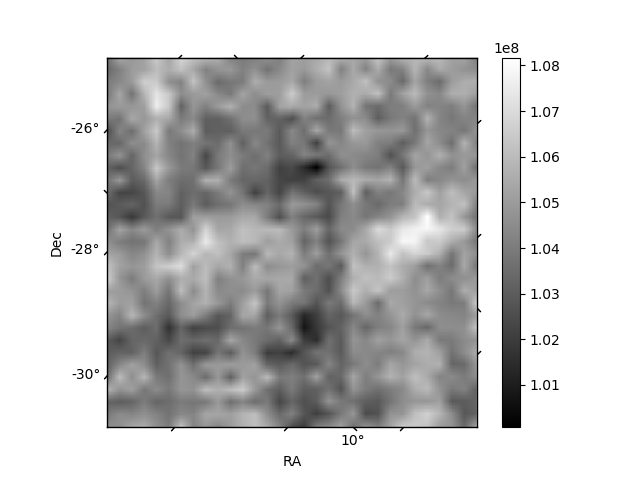
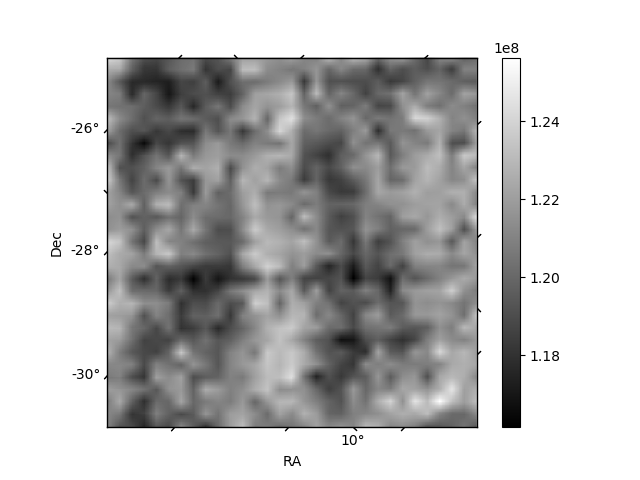
Histogram calculated using DETX and DETY for each event in the final _common_clean file
| Quadrant A | 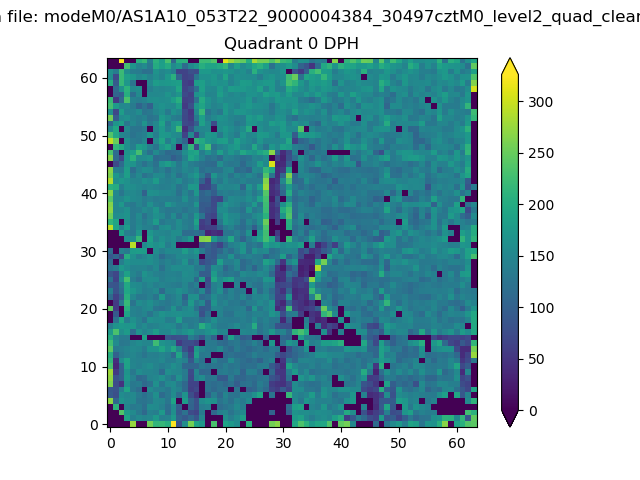 |
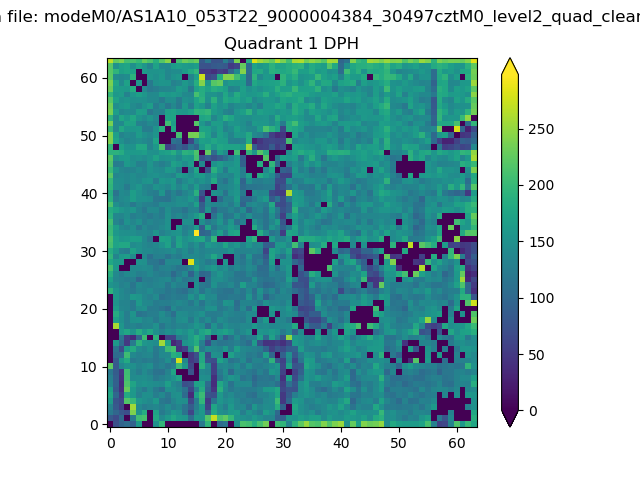 |
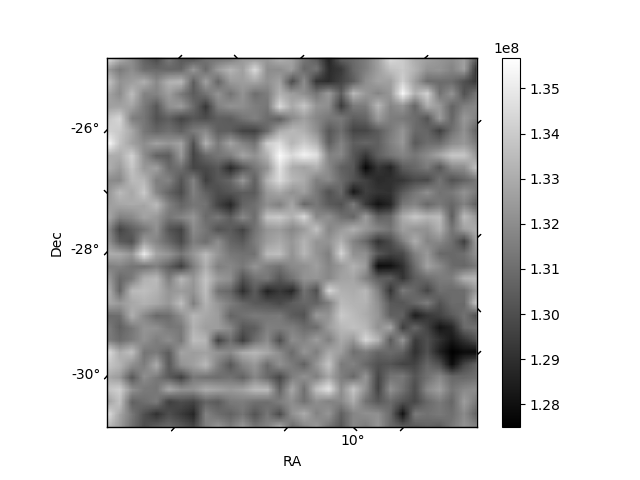
Quadrant B |
|---|---|---|---|
| Quadrant D | 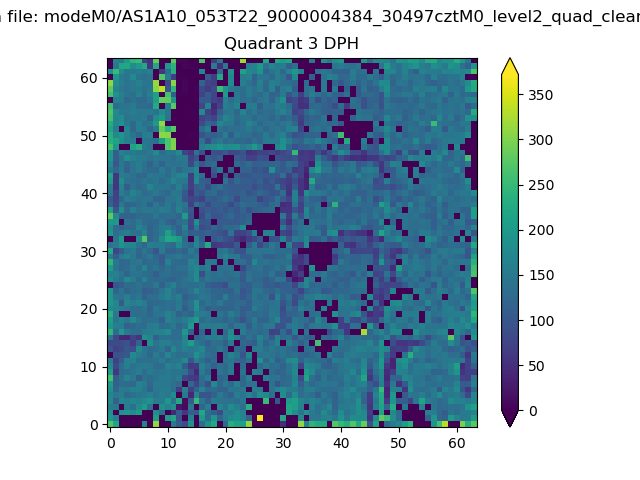 |
 |
Quadrant C |
| Plot type | Count rate plots | Images |
|---|---|---|
| Comparison with Poisson distribution Blue bars denote a histogram of data divided into 1 sec bins. Red curve is a Poisson curve with rate = median count rate of data. |
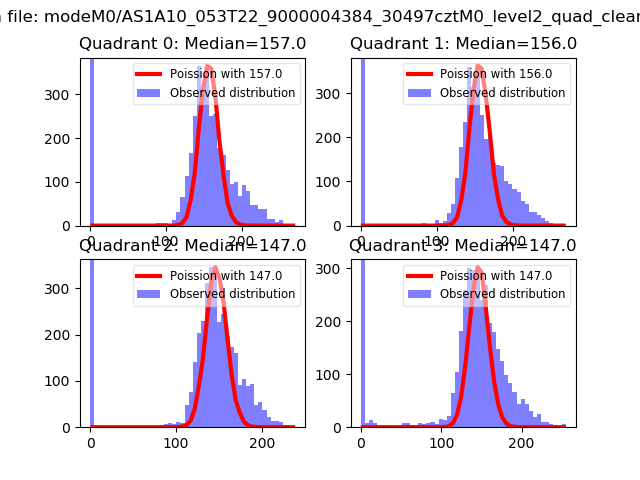 |
 |
| Quadrant-wise count rates Data is divided into 100 sec bins |
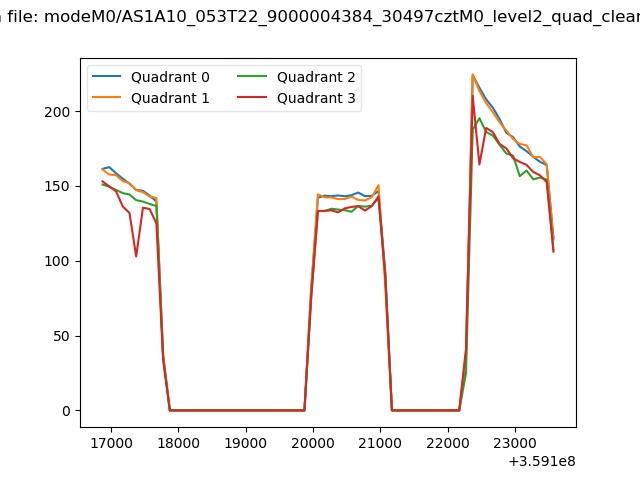 |
|
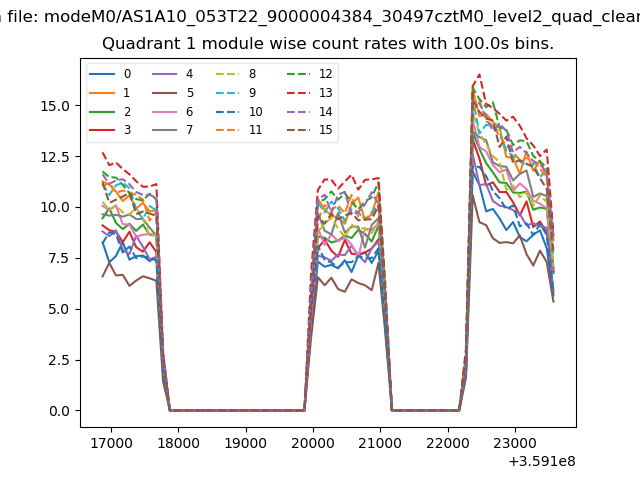
| Module-wise count rates for Quadrant A Data is divided into 100 sec bins |
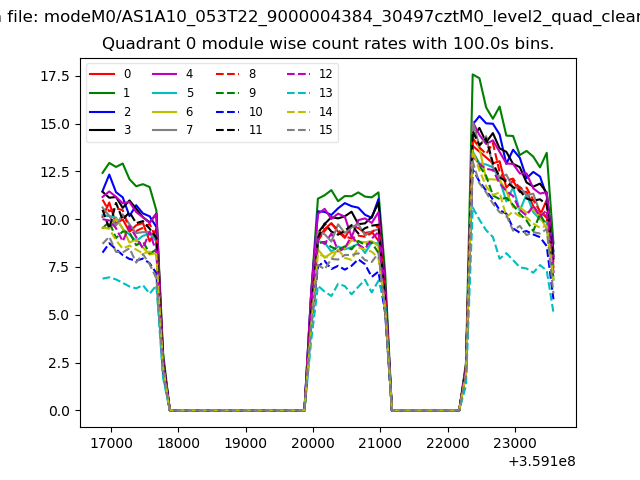 |
 |
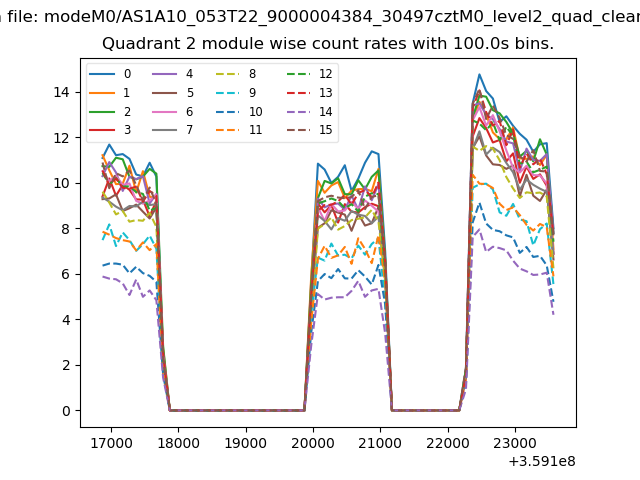
| Module-wise count rates for Quadrant B Data is divided into 100 sec bins |
 |
 |
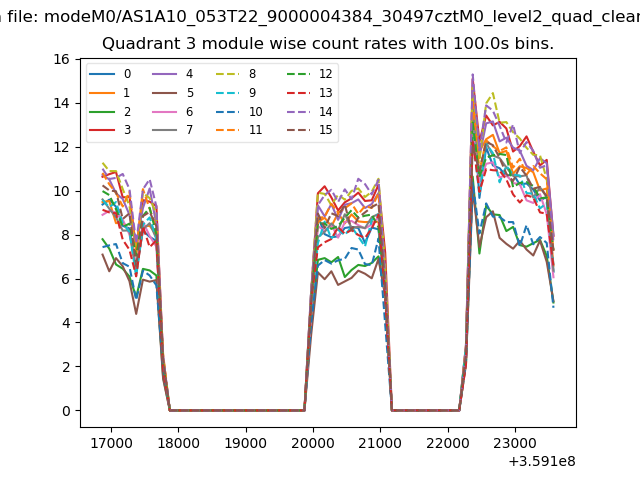
| Module-wise count rates for Quadrant C Data is divided into 100 sec bins |
 |
 |
| Module-wise count rates for Quadrant D Data is divided into 100 sec bins |
 |
 |
| Parameter | Plot |
|---|---|
| CZT HV Monitor | 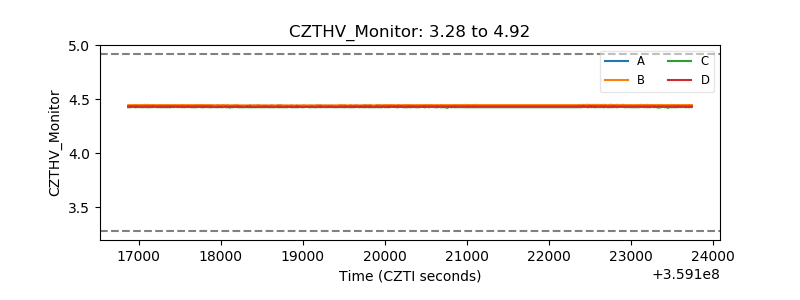 |
| D_VDD | 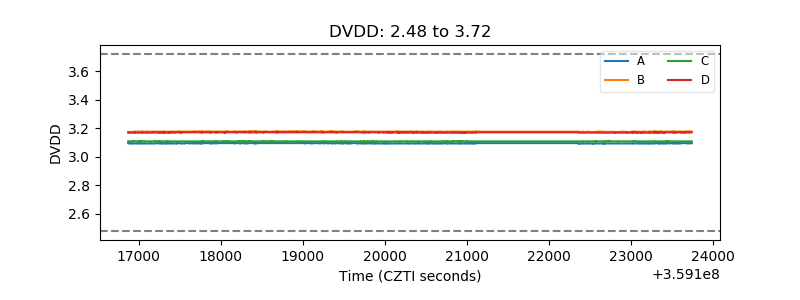 |
| Temperature 1 | 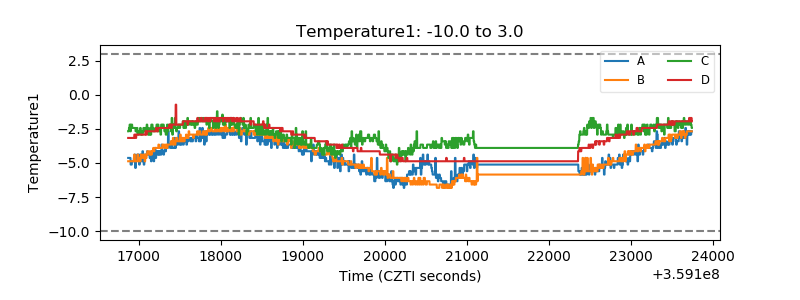 |
| Veto HV Monitor | 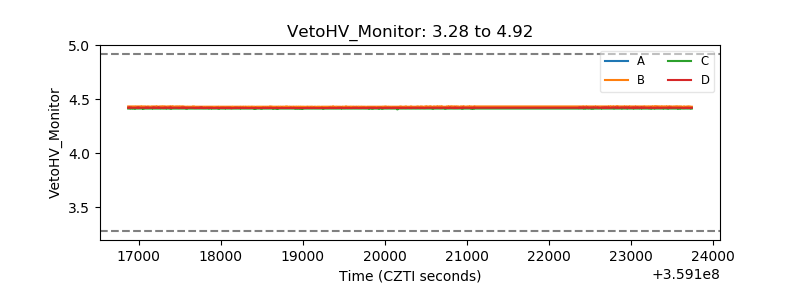 |
| Veto LLD | 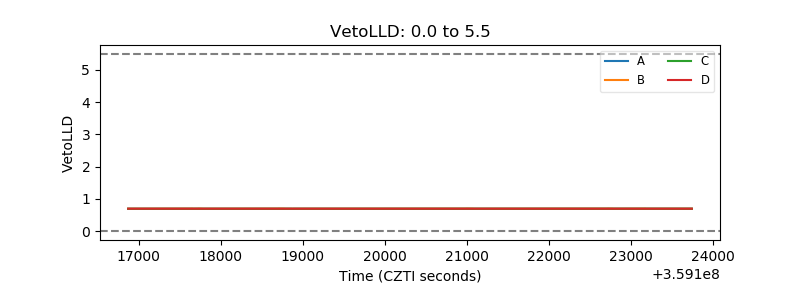 |
| Alpha Counter | 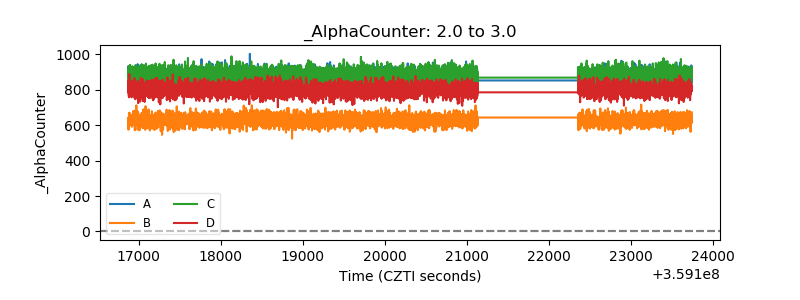 |
| _CPM_Rate | 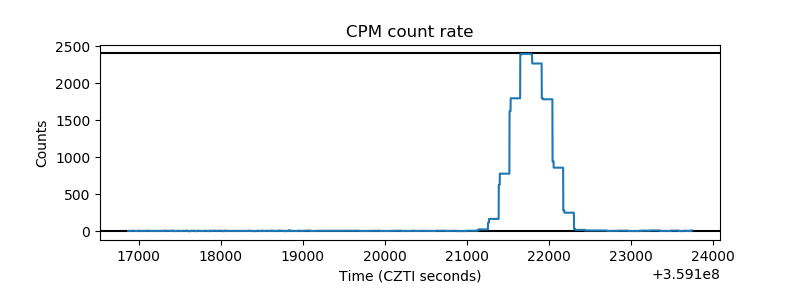 |
| CZT Counter | 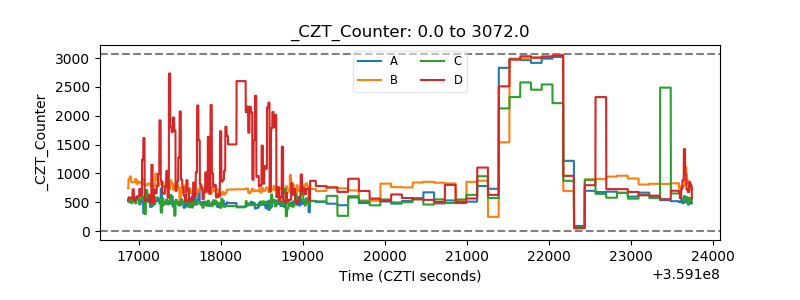 |
| +2.5 Volts monitor |  |
| +5 Volts monitor |  |
| _ROLL_ROT | 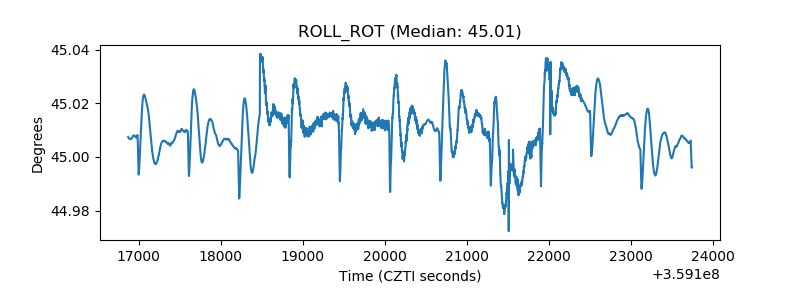 |
| _Roll_DEC | 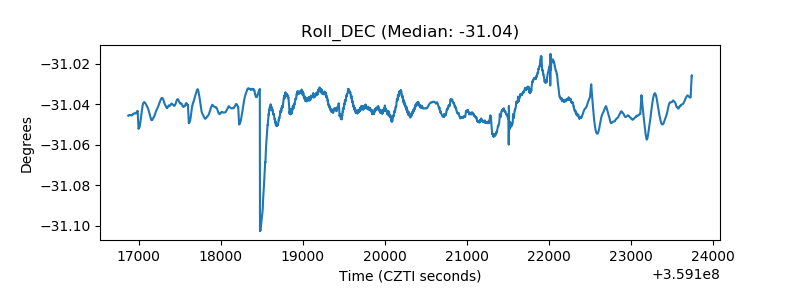 |
| _Roll_RA | 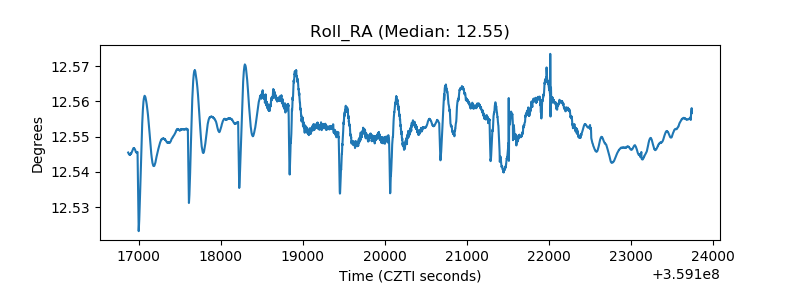 |
| Veto Counter | 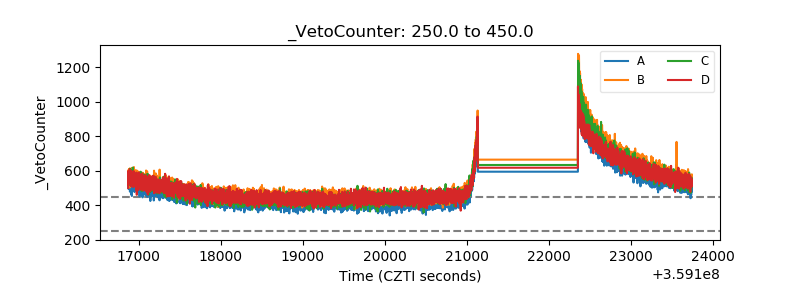 |