| Param | Original file | Final file |
|---|---|---|
| Filename | modeM0/AS1A10_053T22_9000004384_30498cztM0_level2.evt | modeM0/AS1A10_053T22_9000004384_30498cztM0_level2_quad_clean.evt |
| Size (bytes) | 578,756,160 | 84,401,280 |
| Size | 551.9 MB | 80.5 MB |
| Events in quadrant A | 3,364,483 | 555,408 |
| Events in quadrant B | 5,018,952 | 554,545 |
| Events in quadrant C | 3,948,759 | 512,812 |
| Events in quadrant D | 4,785,349 | 509,311 |
| Mode M9 | |||
|---|---|---|---|
| Quadrant | BADHDUFLAG | Total packets | Discarded packets |
| A | 0 | 13 | 0 |
| B | 0 | 13 | 0 |
| C | 0 | 13 | 0 |
| D | 0 | 13 | 0 |
| Mode SS | |||
|---|---|---|---|
| Quadrant | BADHDUFLAG | Total packets | Discarded packets |
| A | 0 | 124 | 0 |
| B | 0 | 124 | 0 |
| C | 0 | 124 | 0 |
| D | 0 | 124 | 0 |
| Mode M0 | |||
|---|---|---|---|
| Quadrant | BADHDUFLAG | Total packets | Discarded packets |
| A | 0 | 13569 | 1 |
| B | 0 | 18865 | 1 |
| C | 0 | 15528 | 1 |
| D | 0 | 18429 | 1 |
| Quadrant | Total seconds | Saturated seconds | Saturation percentage |
|---|---|---|---|
| A | 6065 | 71 | 1.170651% |
| B | 6066 | 123 | 2.027695% |
| C | 6066 | 222 | 3.659743% |
| D | 6066 | 224 | 3.692713% |
Noise dominated data is calculated using 1-second bins in cleaned event files. If a bin has >2000 counts, and if more than 50% of those come from <1% of pixels, then it is considered to be noise-dominated and hence unusable.
| Quadrant | # 1 sec bins | Bins with >0 counts | Bins with >2000 counts | High rate bins dominated by noise | Noise dominated (total time) | Noise dominated (detector-on time) | Marked lightcurve |
|---|---|---|---|---|---|---|---|
| A | 7350 | 6066 | 3 | 3 | 0.04% | 0.05% | 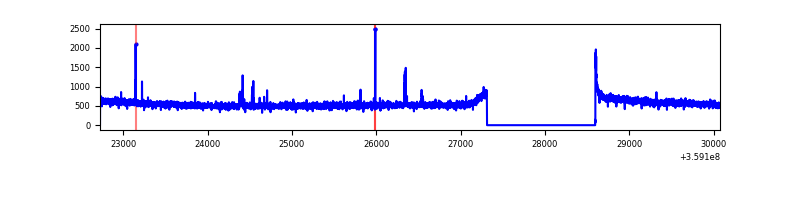 |
| B | 7351 | 6067 | 9 | 9 | 0.12% | 0.15% | 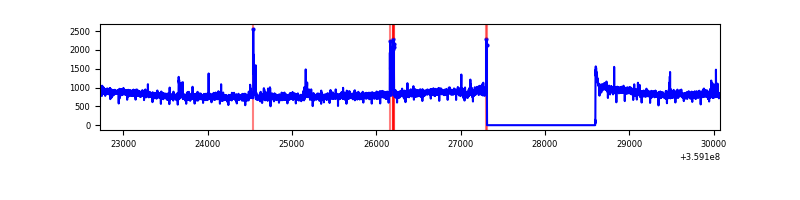 |
| C | 7351 | 6067 | 90 | 90 | 1.22% | 1.48% | 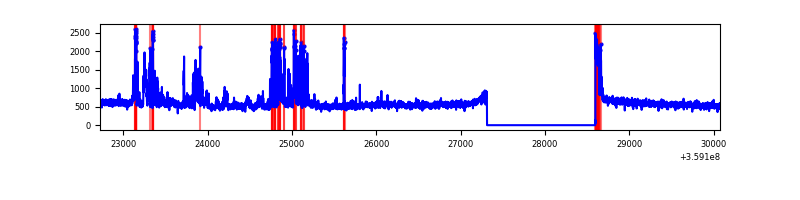 |
| D | 7351 | 6067 | 195 | 195 | 2.65% | 3.21% | 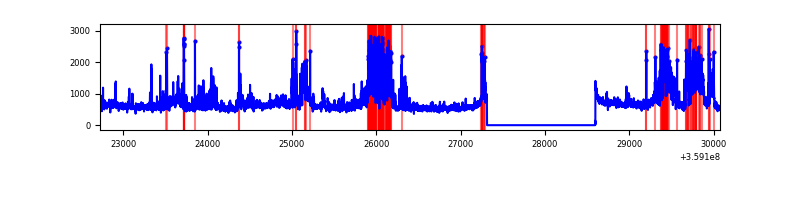 |
Top three noisy pixels from each quadrant. If the there are fewer than three noisy pixels in the level2.evt file, extra rows are filled as -1
| Pixel properties | Quadrant properties | ||||||
|---|---|---|---|---|---|---|---|
| Quadrant | DetID | PixID | Counts | Sigma | Mean | Median | Sigma |
| A | 0 | 31 | 27209 | 156.45 | 857 | 845 | 168.5 |
| A | 12 | 96 | 14668 | 82.03 | 857 | 845 | 168.5 |
| A | 8 | 192 | 11894 | 65.57 | 857 | 845 | 168.5 |
| B | 6 | 159 | 1618006 | 10336.71 | 835 | 818 | 156.5 |
| B | 0 | 229 | 92265 | 584.51 | 835 | 818 | 156.5 |
| B | 15 | 36 | 21837 | 134.35 | 835 | 818 | 156.5 |
| C | 10 | 22 | 397684 | 2205.62 | 786 | 793 | 179.9 |
| C | 3 | 233 | 254771 | 1411.42 | 786 | 793 | 179.9 |
| C | 14 | 238 | 132425 | 731.51 | 786 | 793 | 179.9 |
| D | 13 | 104 | 1256506 | 6649.45 | 810 | 793 | 188.8 |
| D | 8 | 195 | 289021 | 1526.27 | 810 | 793 | 188.8 |
| D | 12 | 218 | 63955 | 334.47 | 810 | 793 | 188.8 |
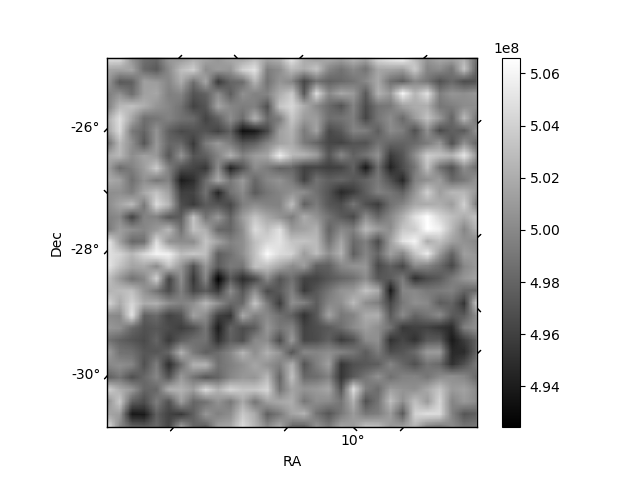
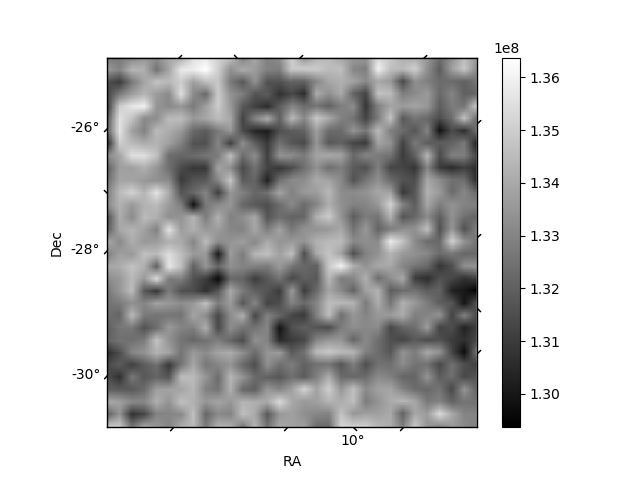
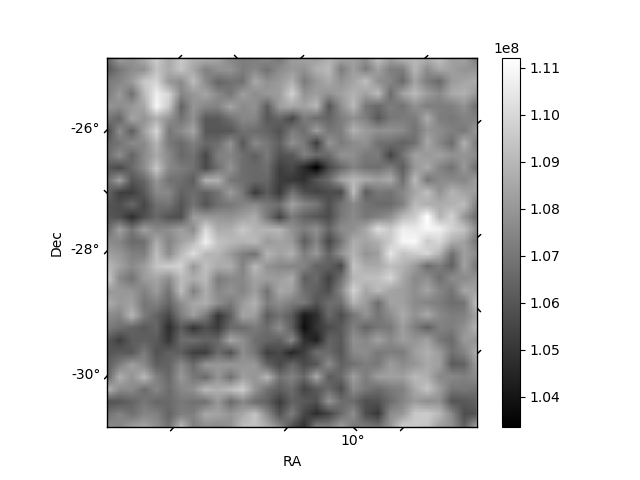
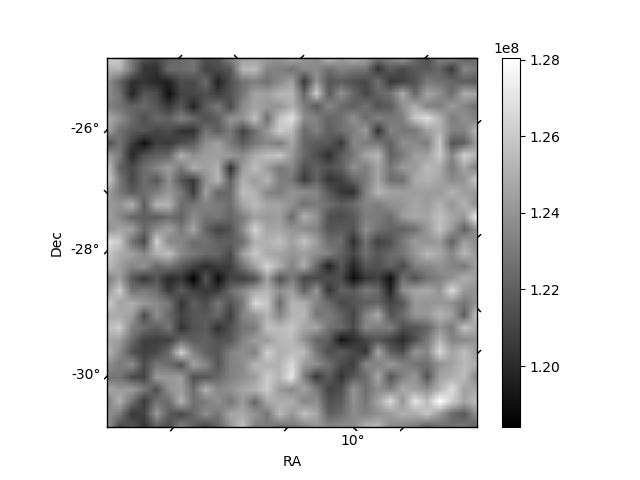
Histogram calculated using DETX and DETY for each event in the final _common_clean file
| Quadrant A | 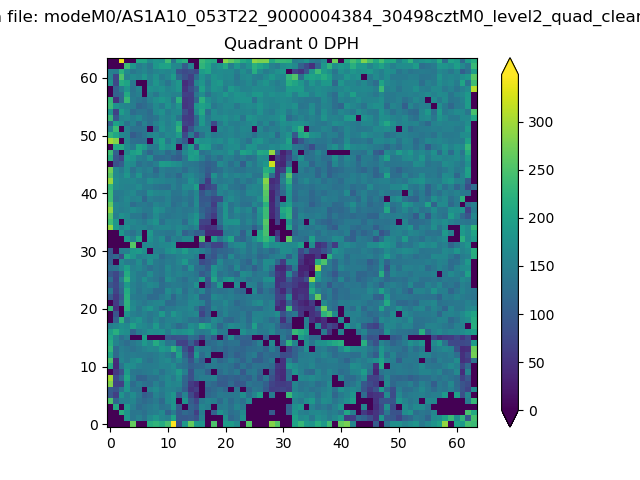 |
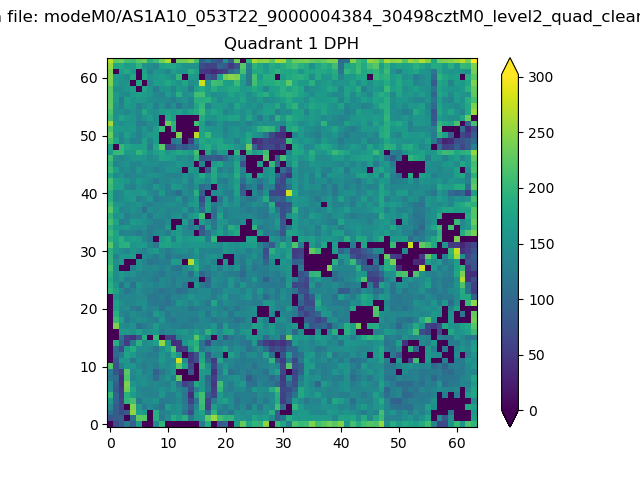 |
Quadrant B |
|---|---|---|---|
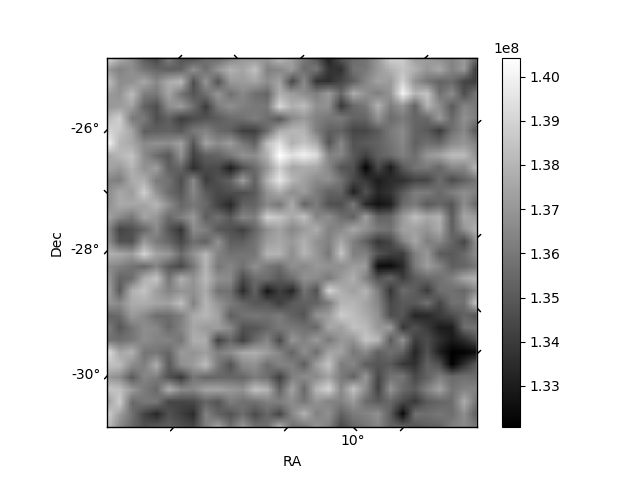
| Quadrant D | 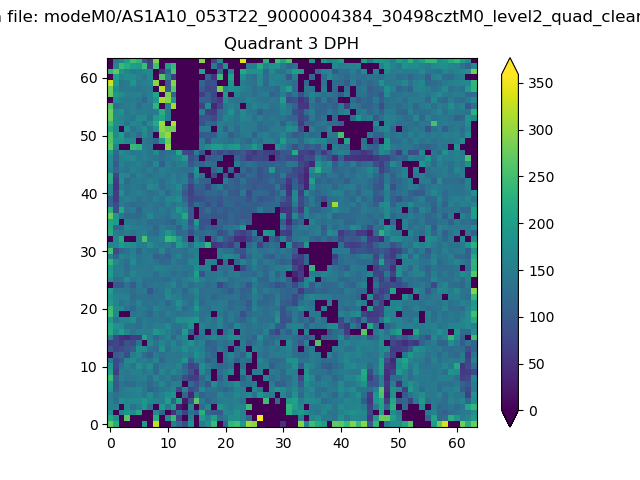 |
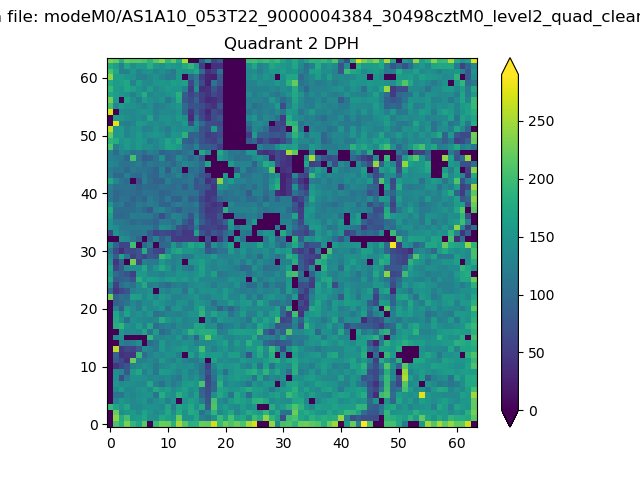 |
Quadrant C |
| Plot type | Count rate plots | Images |
|---|---|---|
| Comparison with Poisson distribution Blue bars denote a histogram of data divided into 1 sec bins. Red curve is a Poisson curve with rate = median count rate of data. |
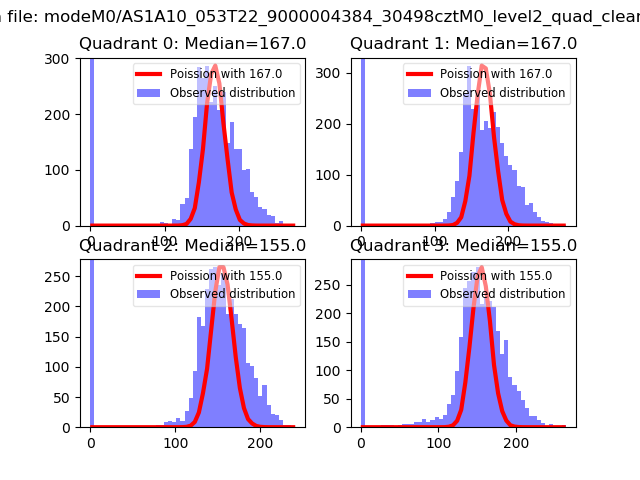 |
 |
| Quadrant-wise count rates Data is divided into 100 sec bins |
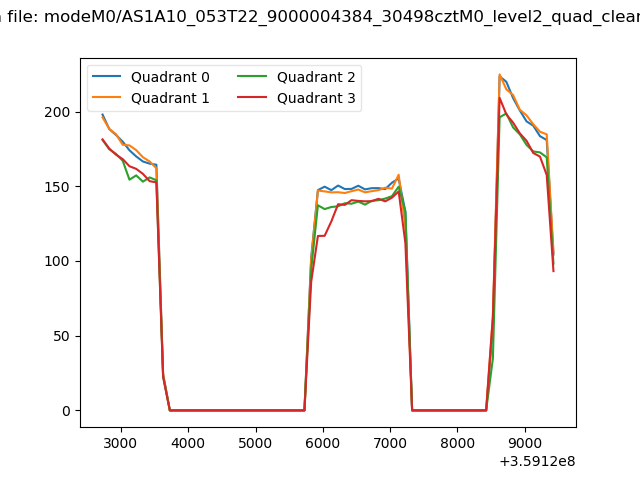 |
|
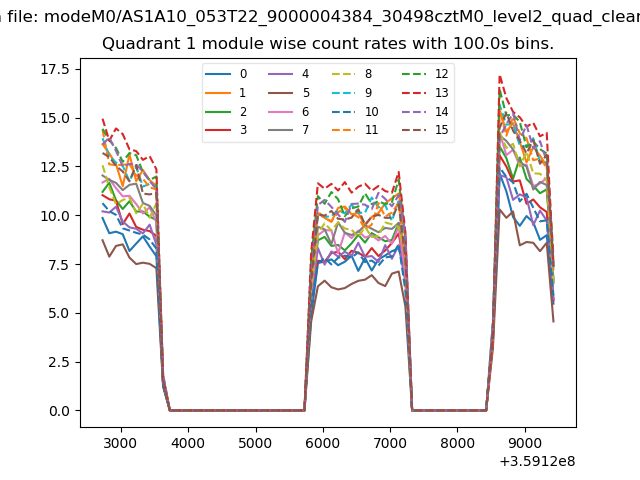
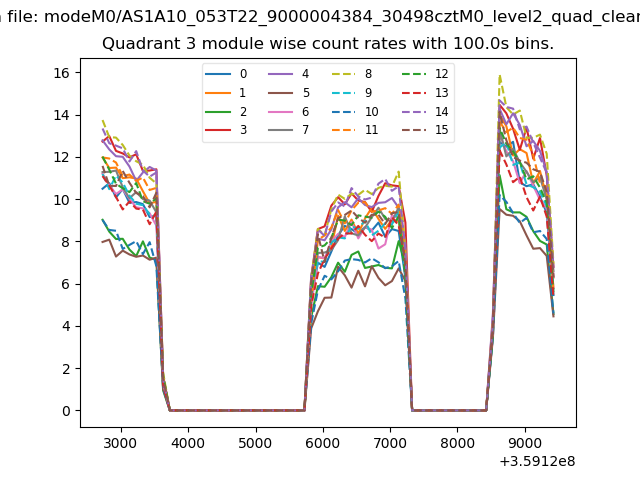
| Module-wise count rates for Quadrant A Data is divided into 100 sec bins |
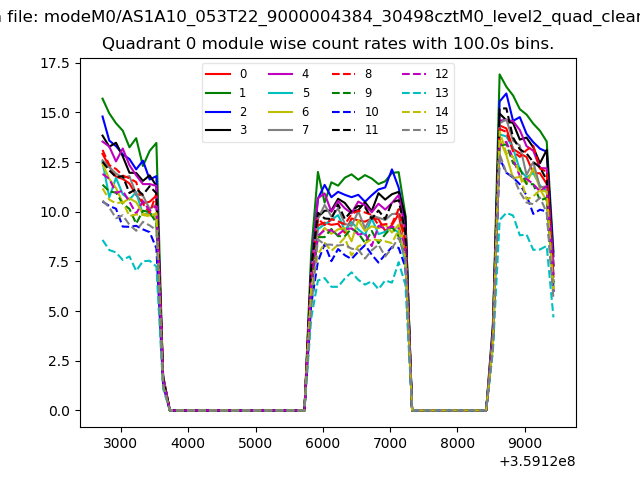 |
 |
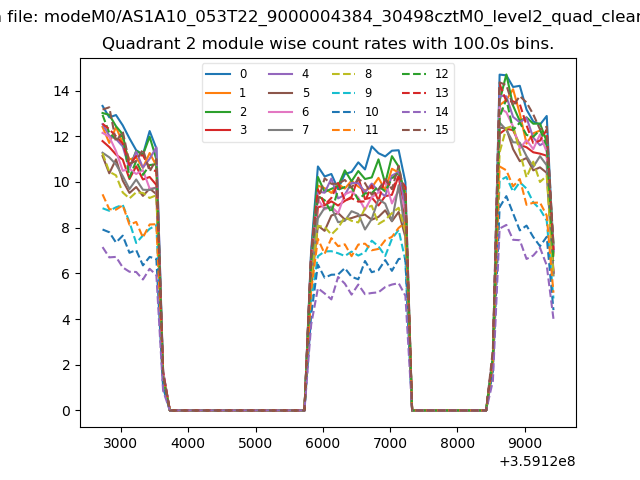
| Module-wise count rates for Quadrant B Data is divided into 100 sec bins |
 |
 |
| Module-wise count rates for Quadrant C Data is divided into 100 sec bins |
 |
 |
| Module-wise count rates for Quadrant D Data is divided into 100 sec bins |
 |
 |
| Parameter | Plot |
|---|---|
| CZT HV Monitor |  |
| D_VDD | 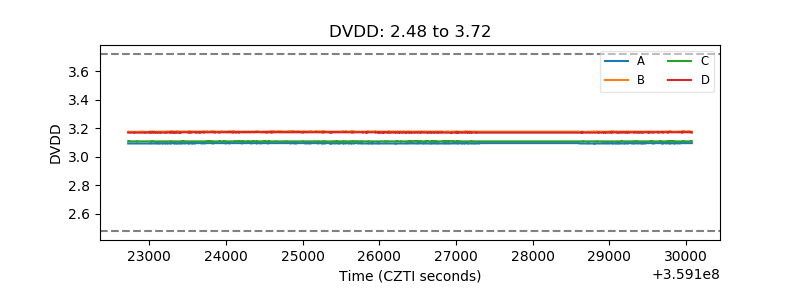 |
| Temperature 1 | 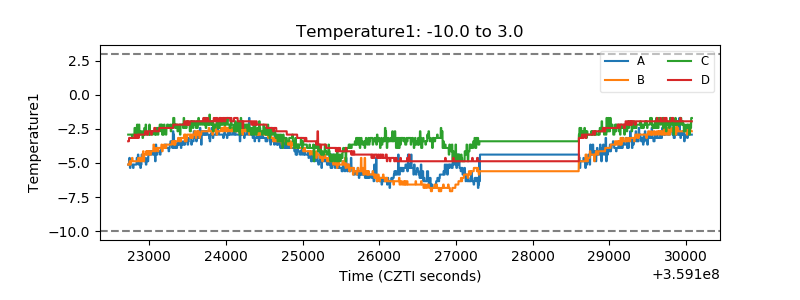 |
| Veto HV Monitor | 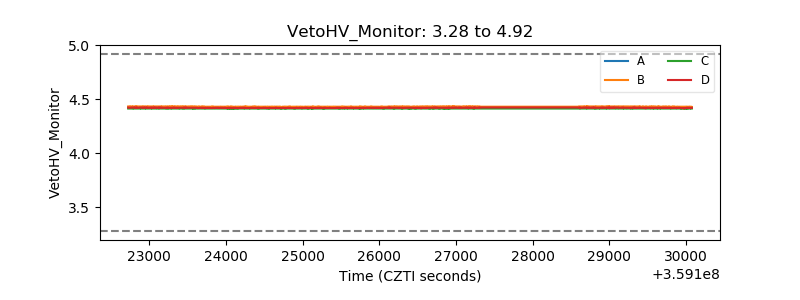 |
| Veto LLD | 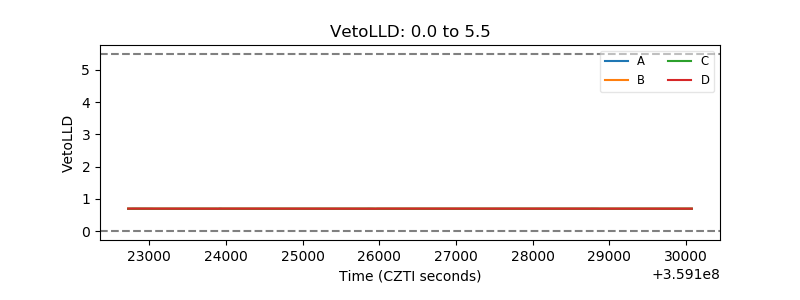 |
| Alpha Counter | 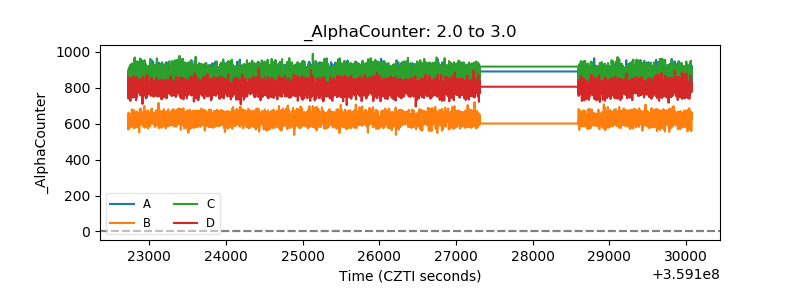 |
| _CPM_Rate | 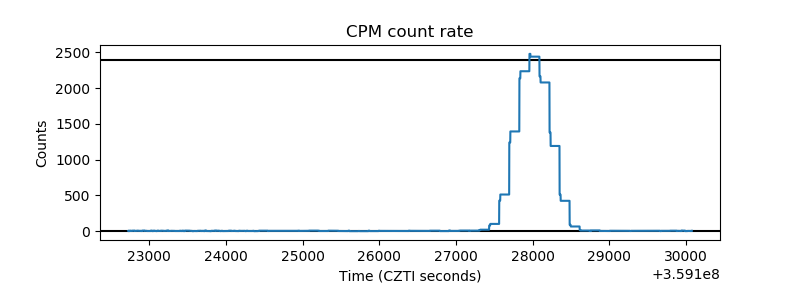 |
| CZT Counter | 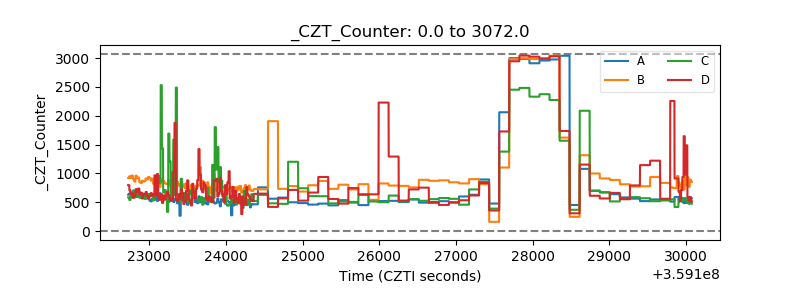 |
| +2.5 Volts monitor | 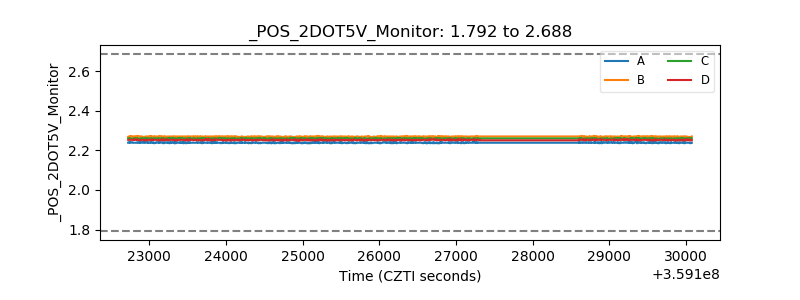 |
| +5 Volts monitor | 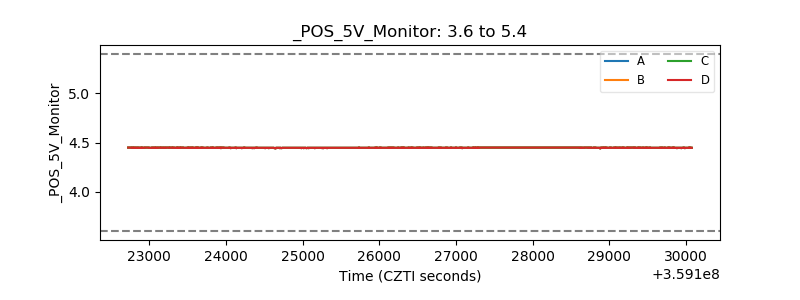 |
| _ROLL_ROT | 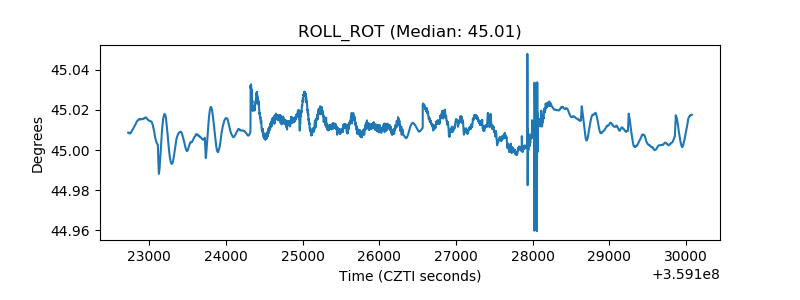 |
| _Roll_DEC | 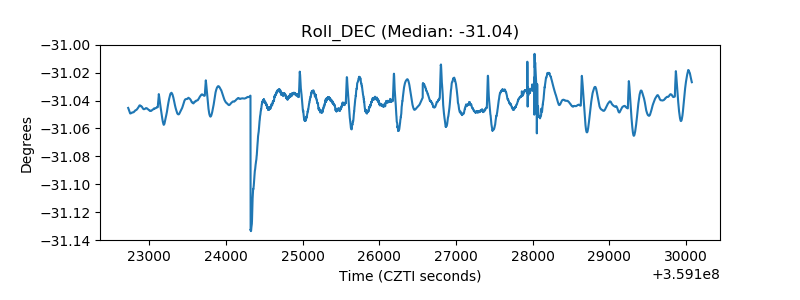 |
| _Roll_RA | 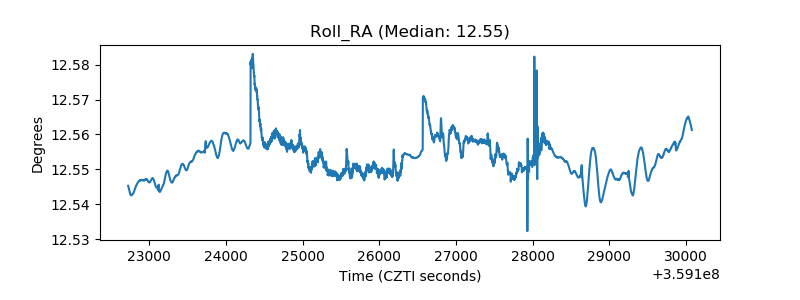 |
| Veto Counter | 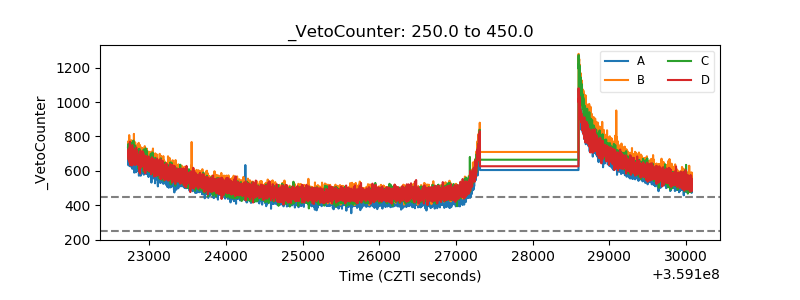 |