| Param | Original file | Final file |
|---|---|---|
| Filename | modeM0/AS1A10_053T22_9000004384_30499cztM0_level2.evt | modeM0/AS1A10_053T22_9000004384_30499cztM0_level2_quad_clean.evt |
| Size (bytes) | 600,333,120 | 84,551,040 |
| Size | 572.5 MB | 80.6 MB |
| Events in quadrant A | 3,606,151 | 547,996 |
| Events in quadrant B | 5,309,755 | 549,577 |
| Events in quadrant C | 3,744,428 | 503,745 |
| Events in quadrant D | 5,084,725 | 508,916 |
| Mode M9 | |||
|---|---|---|---|
| Quadrant | BADHDUFLAG | Total packets | Discarded packets |
| A | 0 | 13 | 0 |
| B | 0 | 14 | 0 |
| C | 0 | 14 | 0 |
| D | 0 | 14 | 0 |
| Mode SS | |||
|---|---|---|---|
| Quadrant | BADHDUFLAG | Total packets | Discarded packets |
| A | 0 | 132 | 0 |
| B | 0 | 132 | 0 |
| C | 0 | 132 | 0 |
| D | 0 | 132 | 0 |
| Mode M0 | |||
|---|---|---|---|
| Quadrant | BADHDUFLAG | Total packets | Discarded packets |
| A | 0 | 14571 | 2 |
| B | 0 | 19928 | 2 |
| C | 0 | 14992 | 2 |
| D | 0 | 19400 | 2 |
| Quadrant | Total seconds | Saturated seconds | Saturation percentage |
|---|---|---|---|
| A | 6446 | 77 | 1.194539% |
| B | 6446 | 140 | 2.171890% |
| C | 6446 | 187 | 2.901024% |
| D | 6446 | 307 | 4.762643% |
Noise dominated data is calculated using 1-second bins in cleaned event files. If a bin has >2000 counts, and if more than 50% of those come from <1% of pixels, then it is considered to be noise-dominated and hence unusable.
| Quadrant | # 1 sec bins | Bins with >0 counts | Bins with >2000 counts | High rate bins dominated by noise | Noise dominated (total time) | Noise dominated (detector-on time) | Marked lightcurve |
|---|---|---|---|---|---|---|---|
| A | 7766 | 6447 | 2 | 2 | 0.03% | 0.03% | 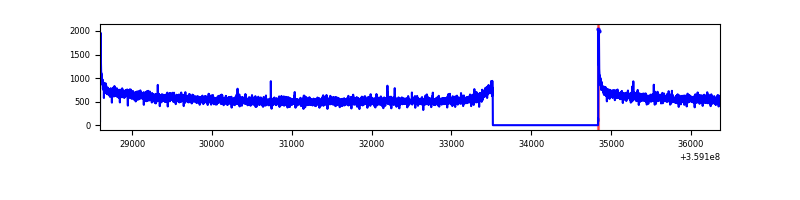 |
| B | 7766 | 6447 | 0 | 0 | 0.00% | 0.00% | 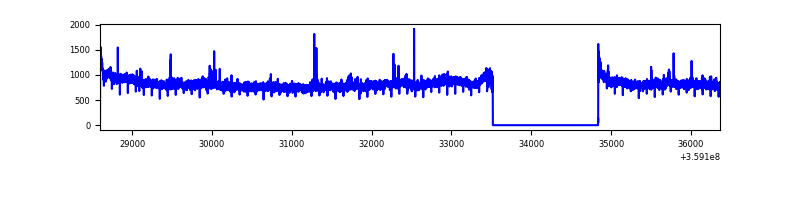 |
| C | 7766 | 6447 | 56 | 56 | 0.72% | 0.87% | 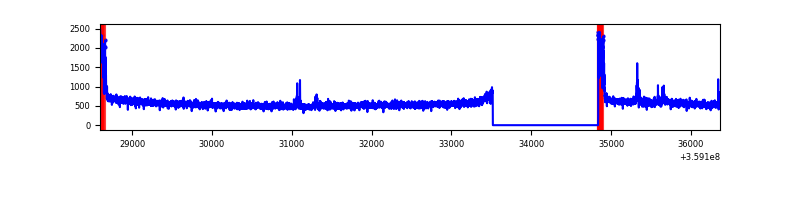 |
| D | 7766 | 6447 | 265 | 265 | 3.41% | 4.11% | 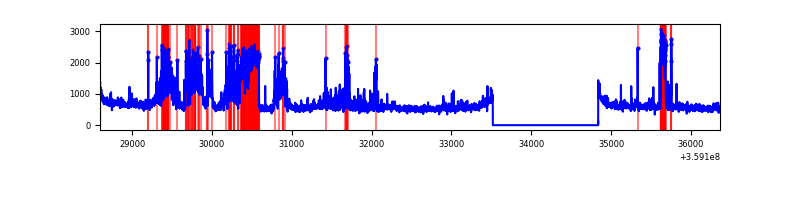 |
Top three noisy pixels from each quadrant. If the there are fewer than three noisy pixels in the level2.evt file, extra rows are filled as -1
| Pixel properties | Quadrant properties | ||||||
|---|---|---|---|---|---|---|---|
| Quadrant | DetID | PixID | Counts | Sigma | Mean | Median | Sigma |
| A | 8 | 192 | 23733 | 124.91 | 928 | 917 | 182.7 |
| A | 13 | 254 | 11352 | 57.13 | 928 | 917 | 182.7 |
| A | 3 | 137 | 8229 | 40.03 | 928 | 917 | 182.7 |
| B | 6 | 159 | 1682856 | 9919.11 | 907 | 888 | 169.6 |
| B | 0 | 229 | 57614 | 334.53 | 907 | 888 | 169.6 |
| B | 12 | 111 | 19983 | 112.61 | 907 | 888 | 169.6 |
| C | 0 | 10 | 175005 | 901.22 | 849 | 859 | 193.2 |
| C | 14 | 238 | 141544 | 728.06 | 849 | 859 | 193.2 |
| C | 3 | 233 | 54866 | 279.49 | 849 | 859 | 193.2 |
| D | 13 | 104 | 950329 | 4666.76 | 867 | 848 | 203.5 |
| D | 8 | 195 | 297514 | 1458.13 | 867 | 848 | 203.5 |
| D | 12 | 218 | 270900 | 1327.32 | 867 | 848 | 203.5 |
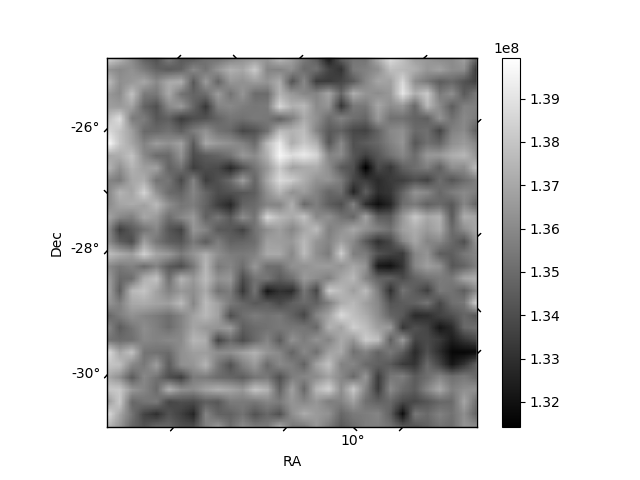
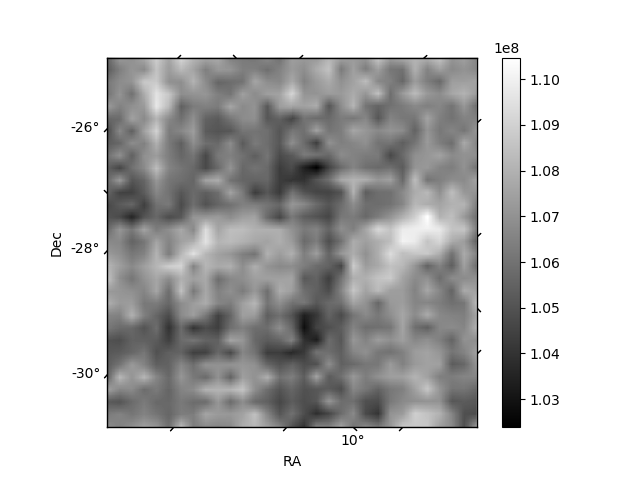
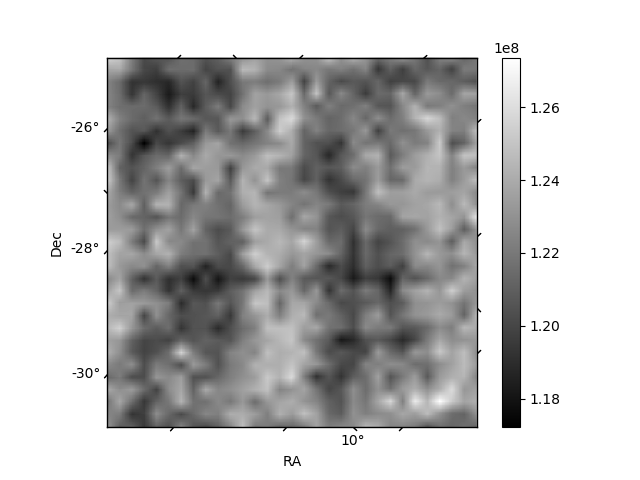
Histogram calculated using DETX and DETY for each event in the final _common_clean file
| Quadrant A | 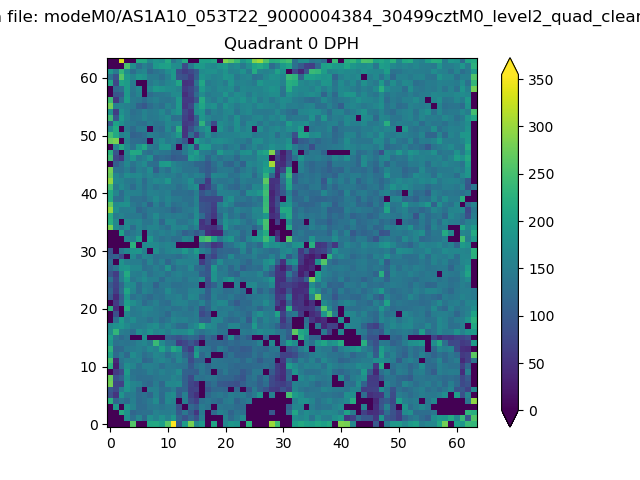 |
 |
Quadrant B |
|---|---|---|---|
| Quadrant D |  |
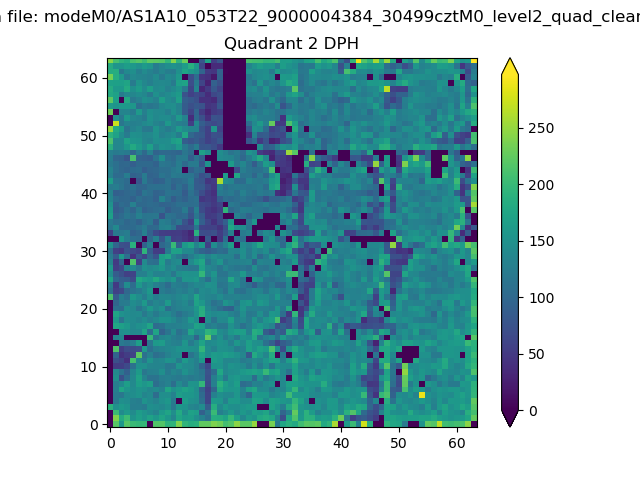 |
Quadrant C |
| Plot type | Count rate plots | Images |
|---|---|---|
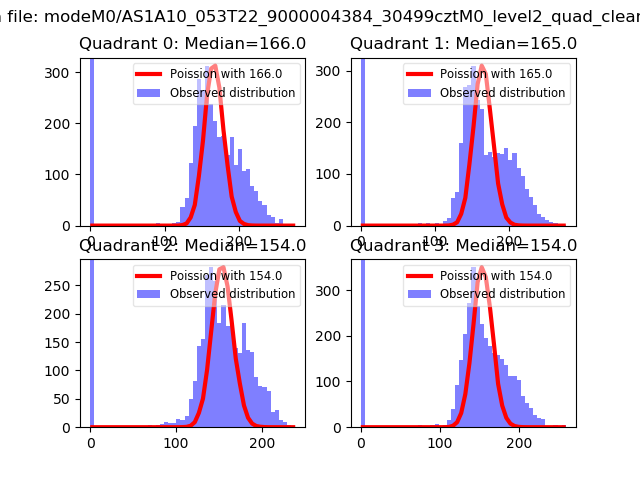
| Comparison with Poisson distribution Blue bars denote a histogram of data divided into 1 sec bins. Red curve is a Poisson curve with rate = median count rate of data. |
 |
 |
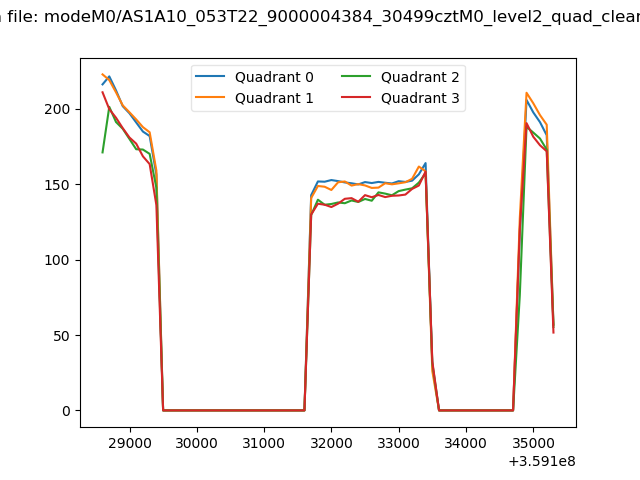
| Quadrant-wise count rates Data is divided into 100 sec bins |
 |
|
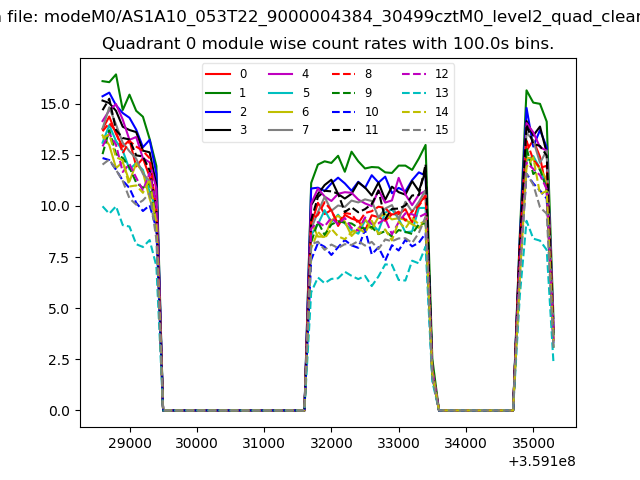
| Module-wise count rates for Quadrant A Data is divided into 100 sec bins |
 |
 |
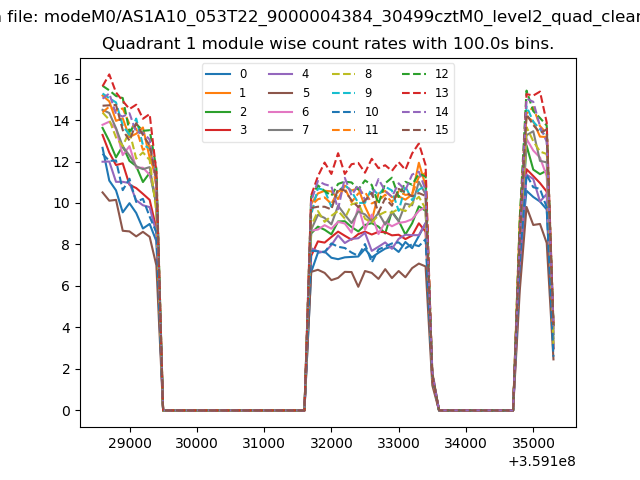
| Module-wise count rates for Quadrant B Data is divided into 100 sec bins |
 |
 |
| Module-wise count rates for Quadrant C Data is divided into 100 sec bins |
 |
 |
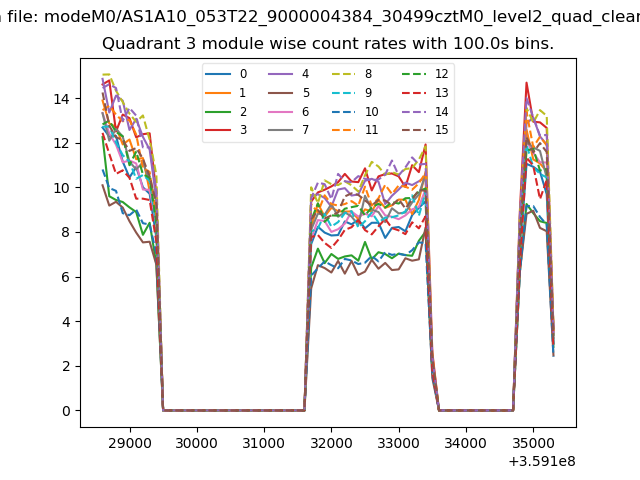
| Module-wise count rates for Quadrant D Data is divided into 100 sec bins |
 |
 |
| Parameter | Plot |
|---|---|
| CZT HV Monitor |  |
| D_VDD | 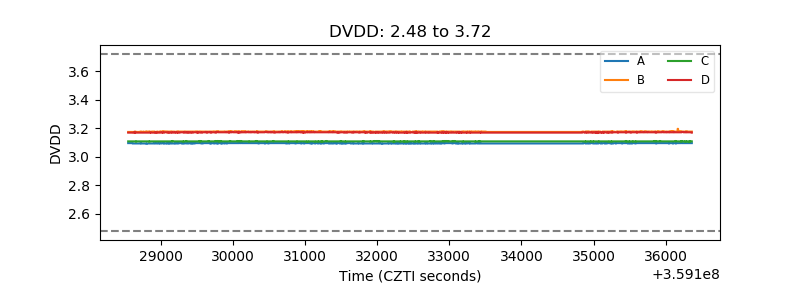 |
| Temperature 1 | 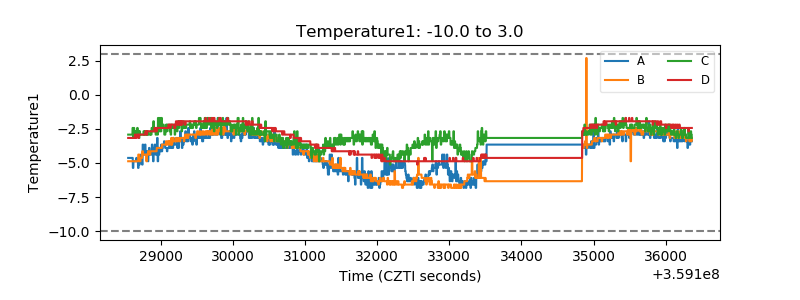 |
| Veto HV Monitor | 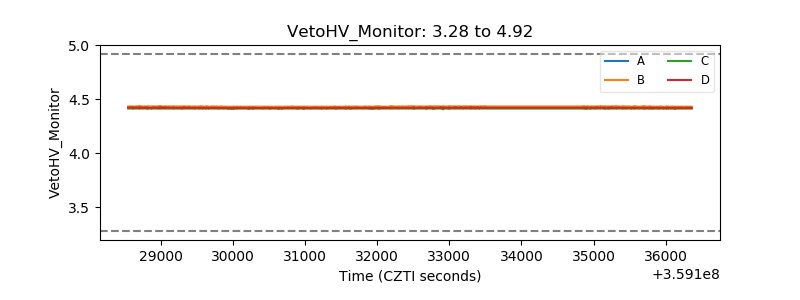 |
| Veto LLD | 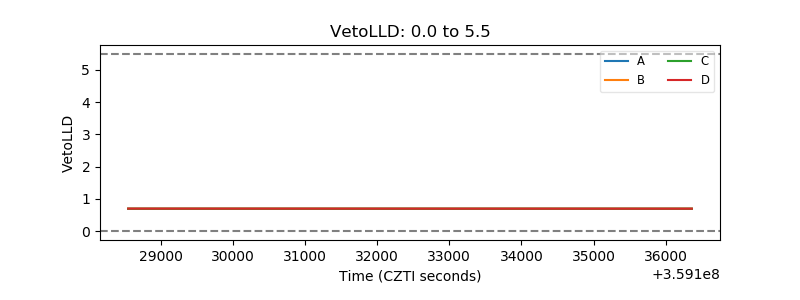 |
| Alpha Counter | 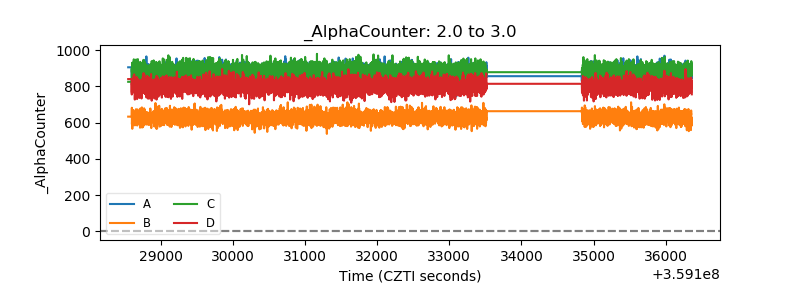 |
| _CPM_Rate | 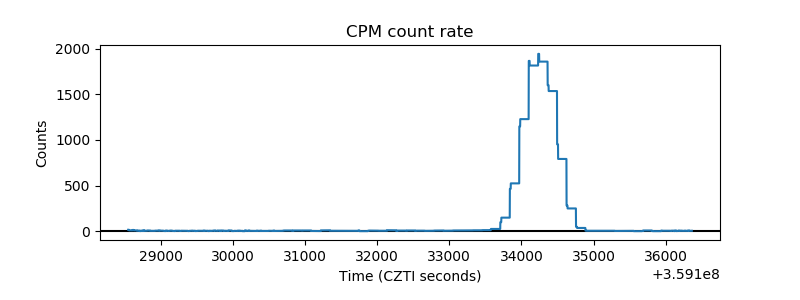 |
| CZT Counter | 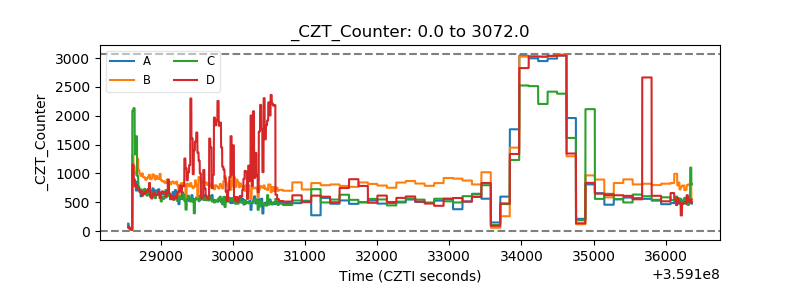 |
| +2.5 Volts monitor |  |
| +5 Volts monitor | 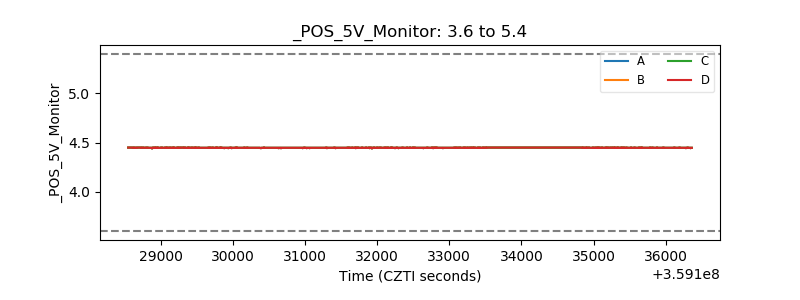 |
| _ROLL_ROT | 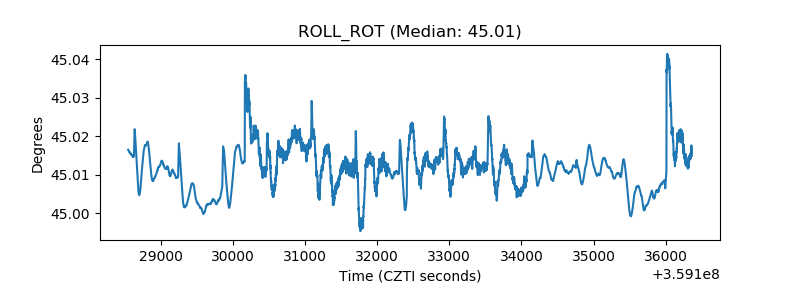 |
| _Roll_DEC | 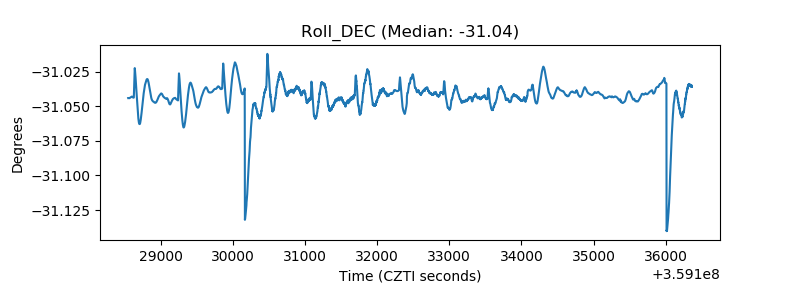 |
| _Roll_RA | 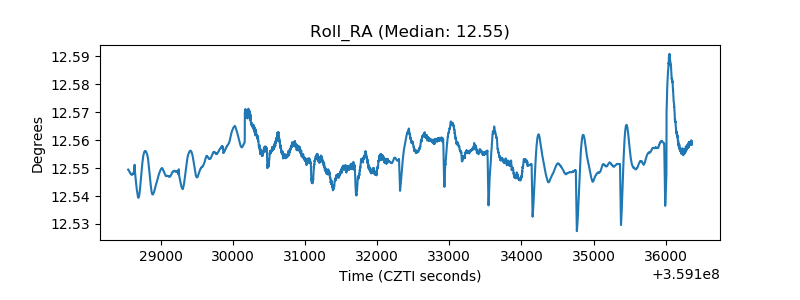 |
| Veto Counter | 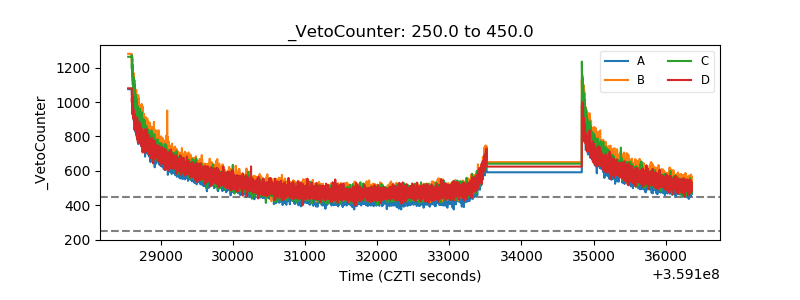 |