| Param | Original file | Final file |
|---|---|---|
| Filename | modeM0/AS1A10_053T22_9000004384_30500cztM0_level2.evt | modeM0/AS1A10_053T22_9000004384_30500cztM0_level2_quad_clean.evt |
| Size (bytes) | 243,907,200 | 20,315,520 |
| Size | 232.6 MB | 19.4 MB |
| Events in quadrant A | 1,509,976 | 106,675 |
| Events in quadrant B | 2,290,098 | 106,249 |
| Events in quadrant C | 1,605,203 | 97,767 |
| Events in quadrant D | 1,783,057 | 96,546 |
| Mode SS | |||
|---|---|---|---|
| Quadrant | BADHDUFLAG | Total packets | Discarded packets |
| A | 0 | 58 | 0 |
| B | 0 | 58 | 0 |
| C | 0 | 58 | 0 |
| D | 0 | 58 | 0 |
| Mode M0 | |||
|---|---|---|---|
| Quadrant | BADHDUFLAG | Total packets | Discarded packets |
| A | 0 | 6112 | 0 |
| B | 0 | 8783 | 0 |
| C | 0 | 6530 | 0 |
| D | 0 | 7033 | 0 |
| Quadrant | Total seconds | Saturated seconds | Saturation percentage |
|---|---|---|---|
| A | 2900 | 2 | 0.068966% |
| B | 2901 | 6 | 0.206825% |
| C | 2901 | 15 | 0.517063% |
| D | 2901 | 78 | 2.688728% |
Noise dominated data is calculated using 1-second bins in cleaned event files. If a bin has >2000 counts, and if more than 50% of those come from <1% of pixels, then it is considered to be noise-dominated and hence unusable.
| Quadrant | # 1 sec bins | Bins with >0 counts | Bins with >2000 counts | High rate bins dominated by noise | Noise dominated (total time) | Noise dominated (detector-on time) | Marked lightcurve |
|---|---|---|---|---|---|---|---|
| A | 2900 | 2900 | 0 | 0 | 0.00% | 0.00% | 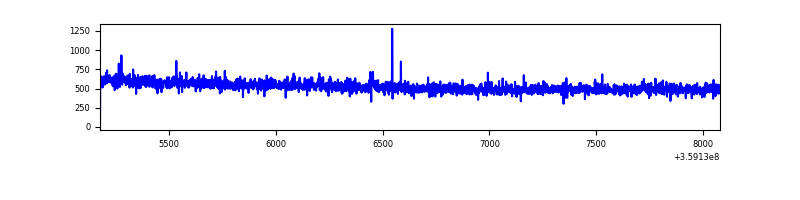 |
| B | 2901 | 2901 | 0 | 0 | 0.00% | 0.00% | 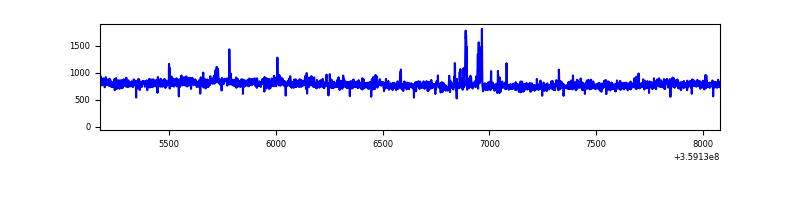 |
| C | 2901 | 2901 | 1 | 1 | 0.03% | 0.03% | 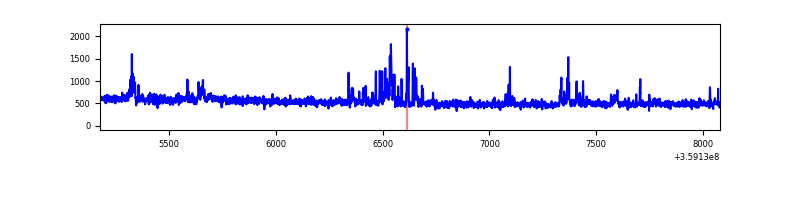 |
| D | 2901 | 2901 | 77 | 77 | 2.65% | 2.65% | 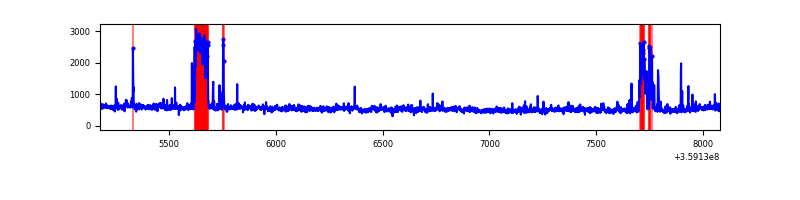 |
Top three noisy pixels from each quadrant. If the there are fewer than three noisy pixels in the level2.evt file, extra rows are filled as -1
| Pixel properties | Quadrant properties | ||||||
|---|---|---|---|---|---|---|---|
| Quadrant | DetID | PixID | Counts | Sigma | Mean | Median | Sigma |
| A | 12 | 96 | 5887 | 70.26 | 390 | 384 | 78.3 |
| A | 13 | 254 | 5101 | 60.22 | 390 | 384 | 78.3 |
| A | 3 | 137 | 3487 | 39.62 | 390 | 384 | 78.3 |
| B | 6 | 159 | 737849 | 10185.85 | 382 | 376 | 72.4 |
| B | 0 | 229 | 44781 | 613.31 | 382 | 376 | 72.4 |
| B | 12 | 111 | 8144 | 107.29 | 382 | 376 | 72.4 |
| C | 10 | 22 | 102729 | 1232.31 | 356 | 360 | 83.1 |
| C | 14 | 238 | 60461 | 723.49 | 356 | 360 | 83.1 |
| C | 3 | 233 | 24148 | 286.36 | 356 | 360 | 83.1 |
| D | 12 | 218 | 147742 | 1696.58 | 362 | 353 | 86.9 |
| D | 8 | 195 | 109300 | 1254.08 | 362 | 353 | 86.9 |
| D | 13 | 104 | 84312 | 966.44 | 362 | 353 | 86.9 |
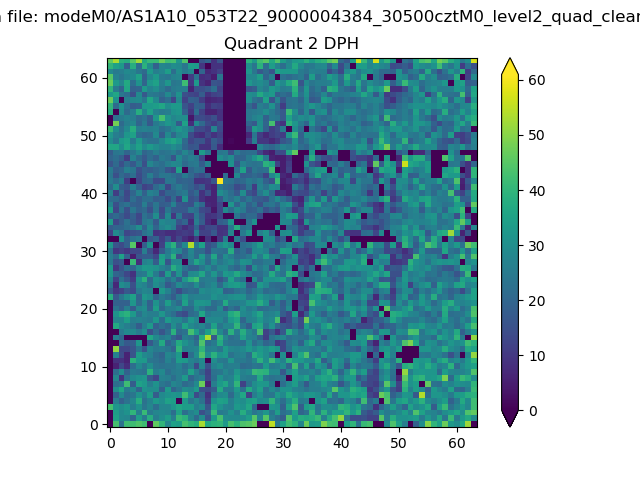
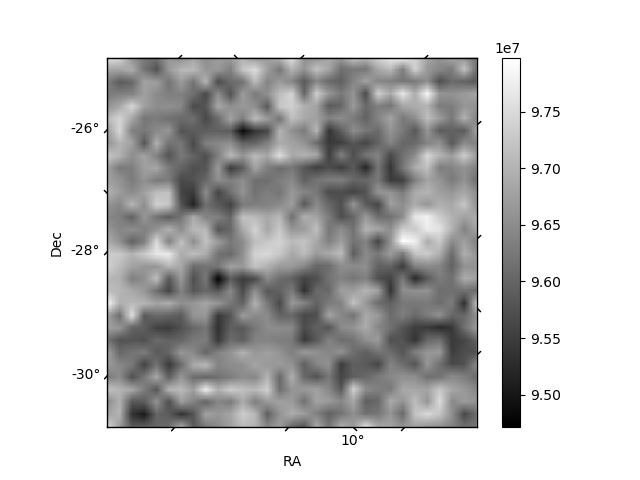
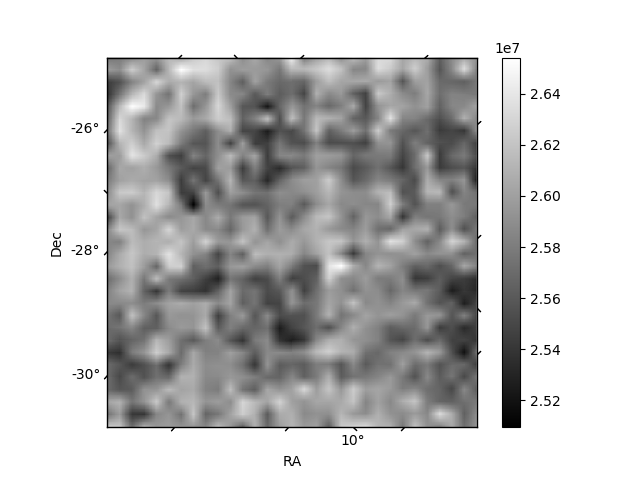
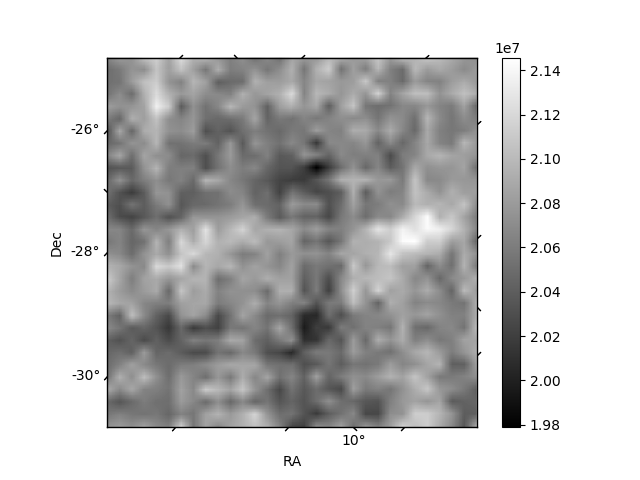
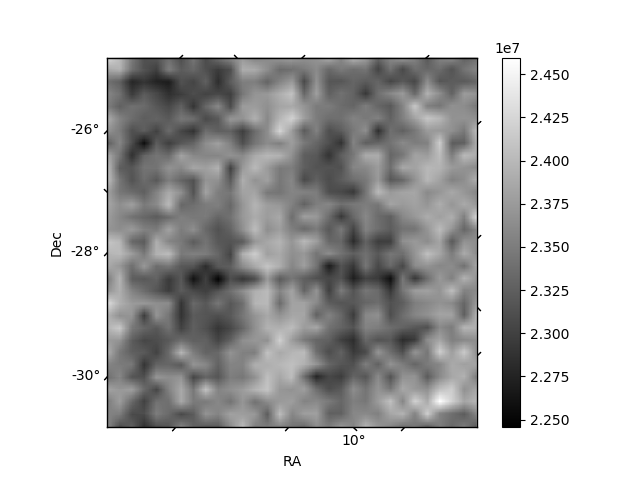
Histogram calculated using DETX and DETY for each event in the final _common_clean file
| Quadrant A | 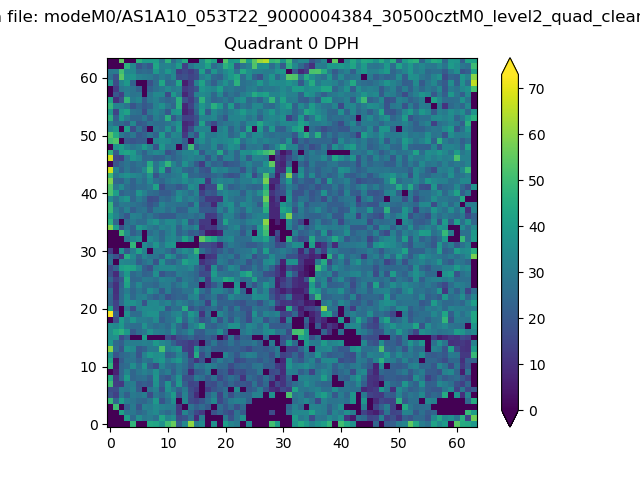 |
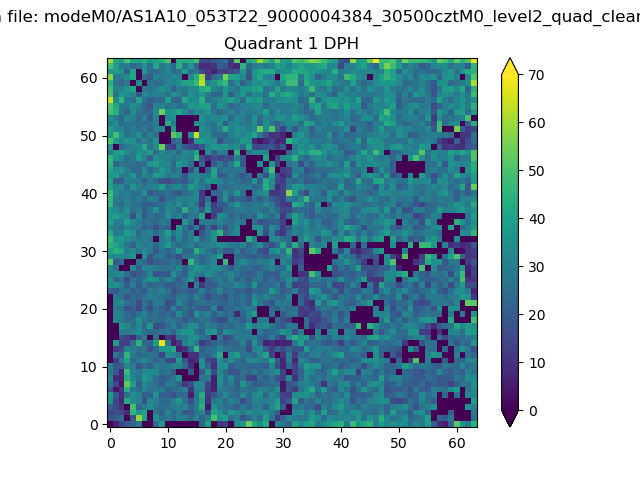 |
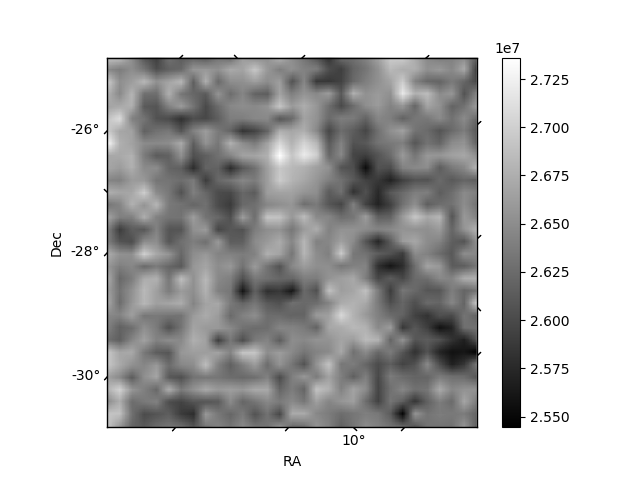
Quadrant B |
|---|---|---|---|
| Quadrant D | 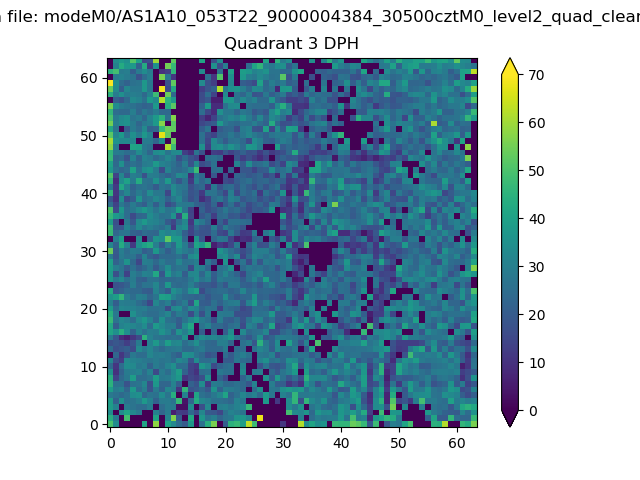 |
 |
Quadrant C |
| Plot type | Count rate plots | Images |
|---|---|---|
| Comparison with Poisson distribution Blue bars denote a histogram of data divided into 1 sec bins. Red curve is a Poisson curve with rate = median count rate of data. |
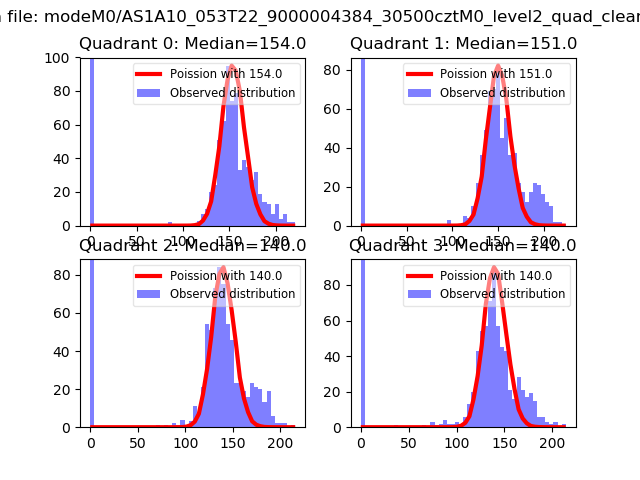 |
 |
| Quadrant-wise count rates Data is divided into 100 sec bins |
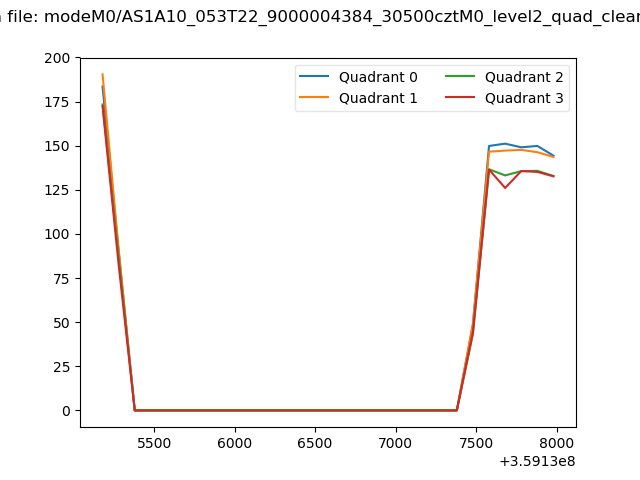 |
|
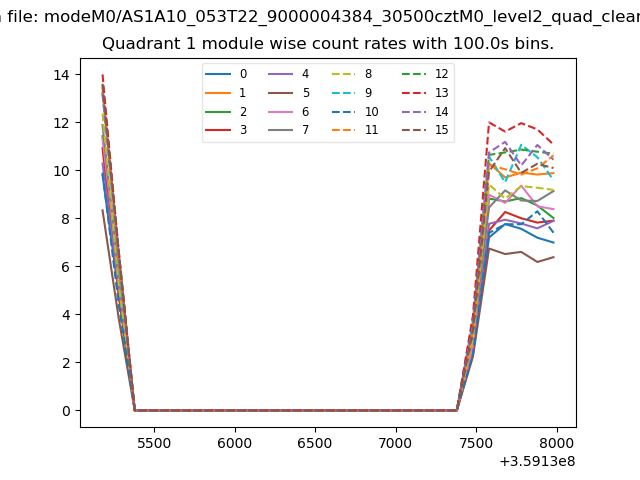
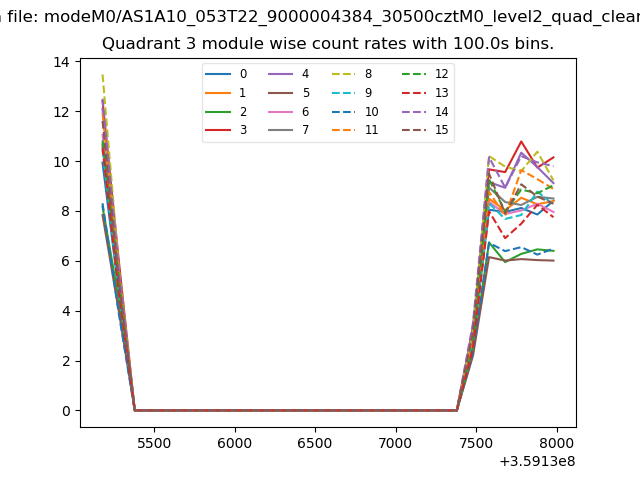
| Module-wise count rates for Quadrant A Data is divided into 100 sec bins |
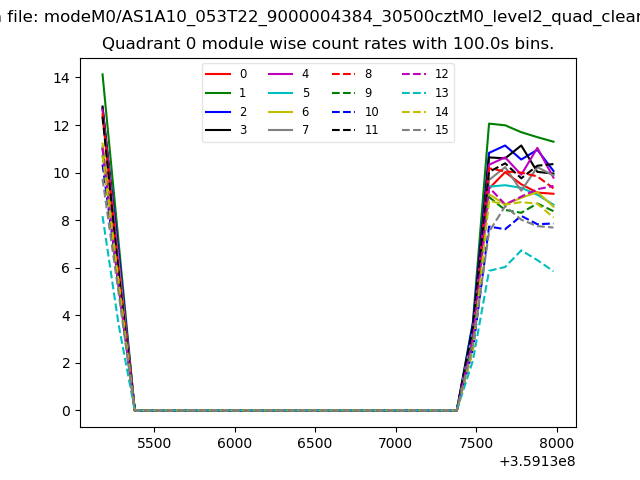 |
 |
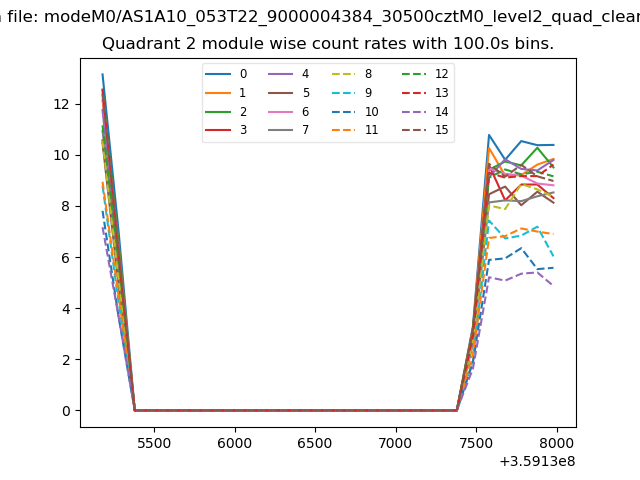
| Module-wise count rates for Quadrant B Data is divided into 100 sec bins |
 |
 |
| Module-wise count rates for Quadrant C Data is divided into 100 sec bins |
 |
 |
| Module-wise count rates for Quadrant D Data is divided into 100 sec bins |
 |
 |
| Parameter | Plot |
|---|---|
| CZT HV Monitor | 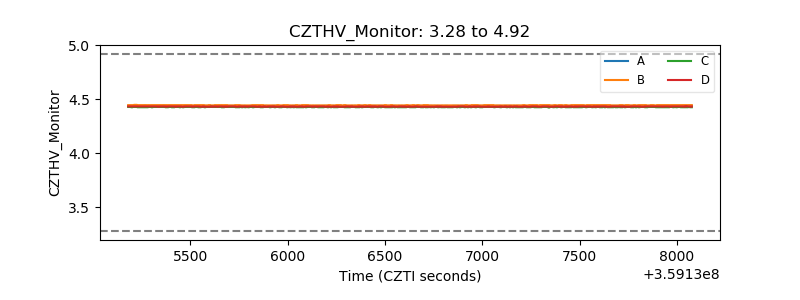 |
| D_VDD | 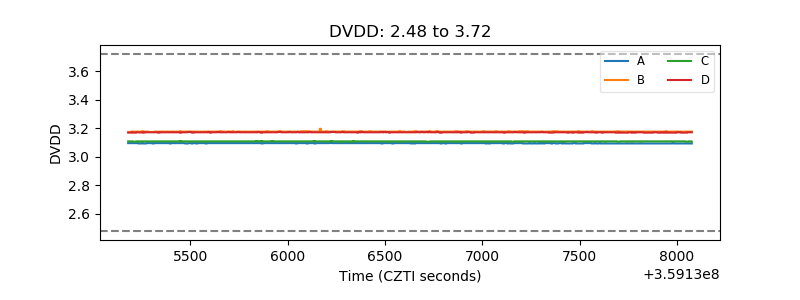 |
| Temperature 1 | 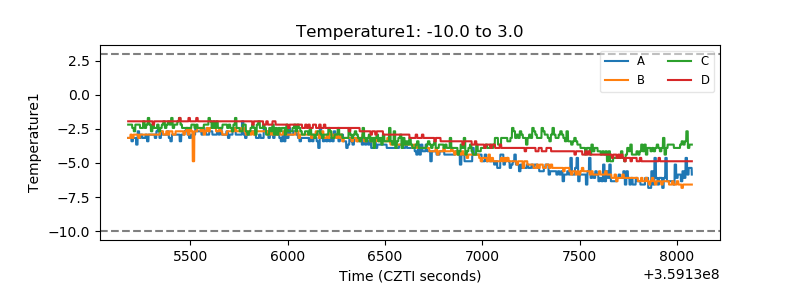 |
| Veto HV Monitor | 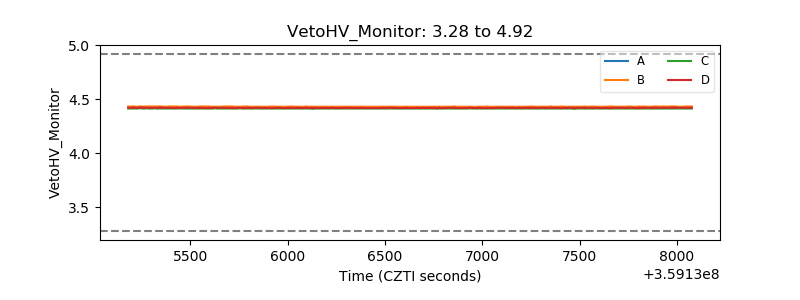 |
| Veto LLD | 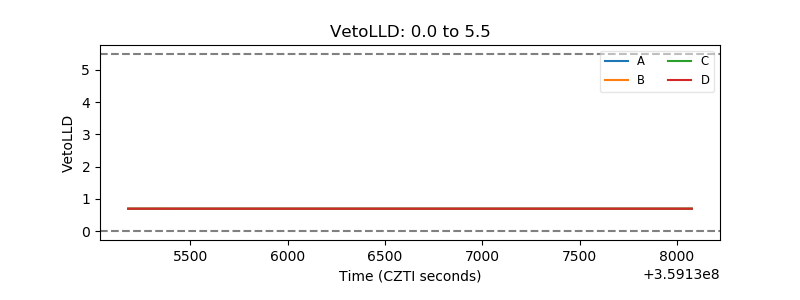 |
| Alpha Counter | 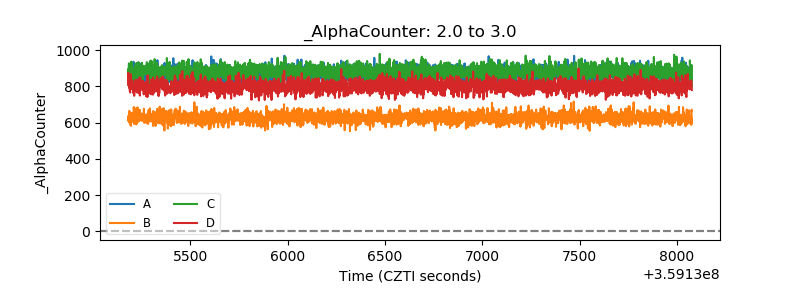 |
| _CPM_Rate | 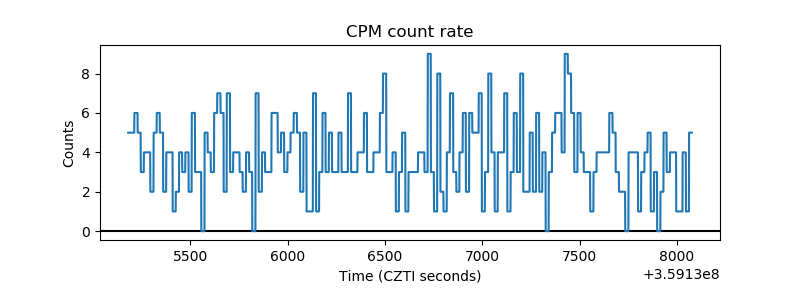 |
| CZT Counter | 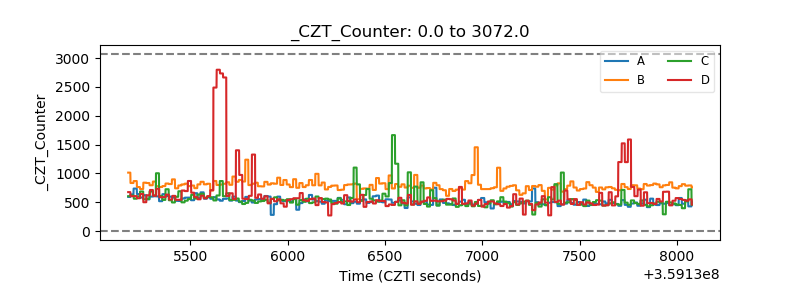 |
| +2.5 Volts monitor |  |
| +5 Volts monitor |  |
| _ROLL_ROT | 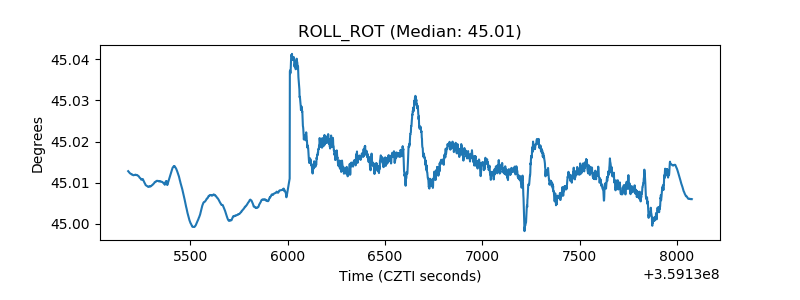 |
| _Roll_DEC | 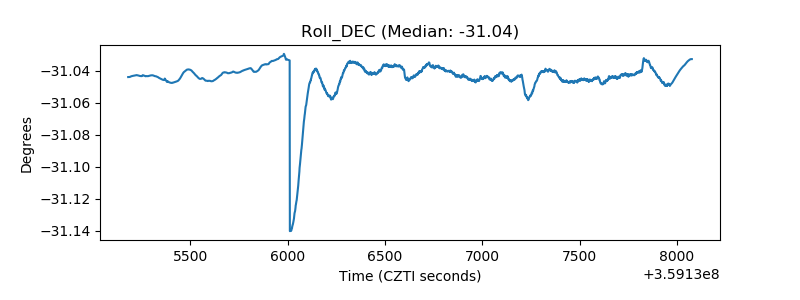 |
| _Roll_RA | 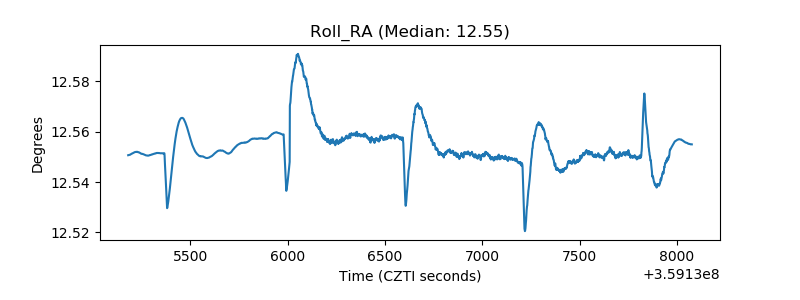 |
| Veto Counter | 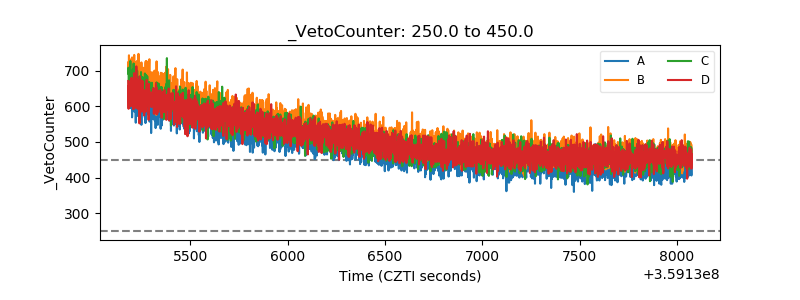 |