| Param | Original file | Final file |
|---|---|---|
| Filename | modeM0/AS1A10_053T47_9000004386cztM0_level2.fits | modeM0/AS1A10_053T47_9000004386cztM0_level2_quad_clean.evt |
| Size (bytes) | 144,789,120 | 127,604,160 |
| Size | 138.1 MB | 121.7 MB |
| Events in quadrant A | 915,990 | 769,406 |
| Events in quadrant B | 853,476 | 751,717 |
| Events in quadrant C | 865,950 | 705,839 |
| Events in quadrant D | 776,042 | 663,028 |
| Mode SS | |||
|---|---|---|---|
| Quadrant | BADHDUFLAG | Total packets | Discarded packets |
| A | 0 | 288 | 0 |
| B | 0 | 288 | 0 |
| C | 0 | 288 | 0 |
| D | 0 | 288 | 0 |
| Mode M9 | |||
|---|---|---|---|
| Quadrant | BADHDUFLAG | Total packets | Discarded packets |
| A | 0 | 29 | 0 |
| B | 0 | 29 | 0 |
| C | 0 | 29 | 0 |
| D | 0 | 29 | 0 |
| Mode M0 | |||
|---|---|---|---|
| Quadrant | BADHDUFLAG | Total packets | Discarded packets |
| A | 0 | 29720 | 0 |
| B | 0 | 43678 | 0 |
| C | 0 | 30529 | 0 |
| D | 0 | 34753 | 0 |
| Quadrant | Total seconds | Saturated seconds | Saturation percentage |
|---|---|---|---|
| A | 14098 | 261 | 1.851326% |
| B | 14098 | 463 | 3.284154% |
| C | 14098 | 398 | 2.823095% |
| D | 14098 | 274 | 1.943538% |
Noise dominated data is calculated using 1-second bins in cleaned event files. If a bin has >2000 counts, and if more than 50% of those come from <1% of pixels, then it is considered to be noise-dominated and hence unusable.
| Quadrant | # 1 sec bins | Bins with >0 counts | Bins with >2000 counts | High rate bins dominated by noise | Noise dominated (total time) | Noise dominated (detector-on time) | Marked lightcurve |
|---|---|---|---|---|---|---|---|
| A | 16988 | 14098 | 0 | 0 | 0.00% | 0.00% |  |
| B | 16988 | 14098 | 0 | 0 | 0.00% | 0.00% |  |
| C | 16987 | 14097 | 0 | 0 | 0.00% | 0.00% |  |
| D | 16987 | 14095 | 0 | 0 | 0.00% | 0.00% |  |
Top three noisy pixels from each quadrant. If the there are fewer than three noisy pixels in the level2.evt file, extra rows are filled as -1
| Pixel properties | Quadrant properties | ||||||
|---|---|---|---|---|---|---|---|
| Quadrant | DetID | PixID | Counts | Sigma | Mean | Median | Sigma |
| A | 0 | 29 | 853 | 10.55 | 239 | 226 | 59.4 |
| A | 7 | 110 | 748 | 8.78 | 239 | 226 | 59.4 |
| A | 0 | 30 | 705 | 8.06 | 239 | 226 | 59.4 |
| B | 2 | 9 | 634 | 9.0 | 225 | 215 | 46.5 |
| B | 5 | 225 | 573 | 7.69 | 225 | 215 | 46.5 |
| B | 5 | 128 | 572 | 7.67 | 225 | 215 | 46.5 |
| C | 1 | 80 | 673 | 7.71 | 228 | 215 | 59.4 |
| C | 1 | 81 | 634 | 7.05 | 228 | 215 | 59.4 |
| C | 3 | 126 | 602 | 6.51 | 228 | 215 | 59.4 |
| D | 15 | 46 | 620 | 6.91 | 221 | 201 | 60.6 |
| D | 1 | 31 | 553 | 5.81 | 221 | 201 | 60.6 |
| D | 7 | 3 | 547 | 5.71 | 221 | 201 | 60.6 |
Histogram calculated using DETX and DETY for each event in the final _common_clean file
| Quadrant A |  |
 |
Quadrant B |
|---|---|---|---|
| Quadrant D |  |
 |
Quadrant C |
| Plot type | Count rate plots | Images |
|---|---|---|
| Comparison with Poisson distribution Blue bars denote a histogram of data divided into 1 sec bins. Red curve is a Poisson curve with rate = median count rate of data. |
 |
 |
| Quadrant-wise count rates Data is divided into 100 sec bins |
 |
|
| Module-wise count rates for Quadrant A Data is divided into 100 sec bins |
 |
 |
| Module-wise count rates for Quadrant B Data is divided into 100 sec bins |
 |
 |
| Module-wise count rates for Quadrant C Data is divided into 100 sec bins |
 |
 |
| Module-wise count rates for Quadrant D Data is divided into 100 sec bins |
 |
 |
| Parameter | Plot |
|---|---|
| CZT HV Monitor |  |
| D_VDD | 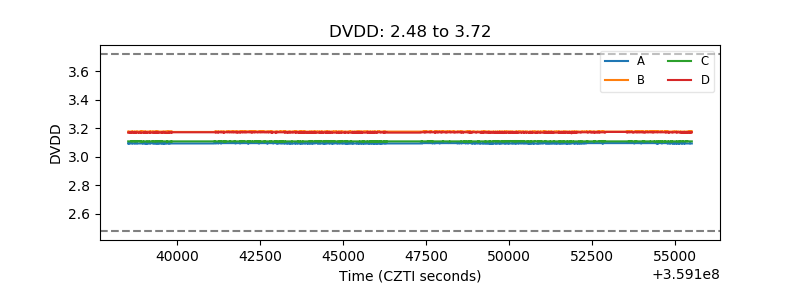 |
| Temperature 1 |  |
| Veto HV Monitor |  |
| Veto LLD |  |
| Alpha Counter |  |
| _CPM_Rate |  |
| CZT Counter |  |
| +2.5 Volts monitor |  |
| +5 Volts monitor |  |
| _ROLL_ROT | 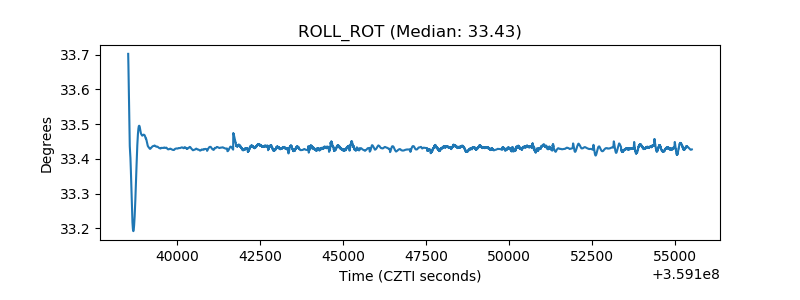 |
| _Roll_DEC |  |
| _Roll_RA |  |
| Veto Counter |  |