| Param | Original file | Final file |
|---|---|---|
| Filename | modeM0/AS1A10_053T47_9000004386_30501cztM0_level2.evt | modeM0/AS1A10_053T47_9000004386_30501cztM0_level2_quad_clean.evt |
| Size (bytes) | 571,677,120 | 73,428,480 |
| Size | 545.2 MB | 70.0 MB |
| Events in quadrant A | 3,386,556 | 456,322 |
| Events in quadrant B | 5,428,154 | 451,924 |
| Events in quadrant C | 3,577,628 | 430,660 |
| Events in quadrant D | 4,477,271 | 427,380 |
| Mode SS | |||
|---|---|---|---|
| Quadrant | BADHDUFLAG | Total packets | Discarded packets |
| A | 0 | 134 | 0 |
| B | 0 | 134 | 0 |
| C | 0 | 134 | 0 |
| D | 0 | 134 | 0 |
| Mode M9 | |||
|---|---|---|---|
| Quadrant | BADHDUFLAG | Total packets | Discarded packets |
| A | 0 | 16 | 0 |
| B | 0 | 17 | 0 |
| C | 0 | 17 | 0 |
| D | 0 | 17 | 0 |
| Mode M0 | |||
|---|---|---|---|
| Quadrant | BADHDUFLAG | Total packets | Discarded packets |
| A | 0 | 13905 | 2 |
| B | 0 | 20343 | 3 |
| C | 0 | 14376 | 2 |
| D | 0 | 17499 | 2 |
| Quadrant | Total seconds | Saturated seconds | Saturation percentage |
|---|---|---|---|
| A | 6551 | 117 | 1.785987% |
| B | 6550 | 201 | 3.068702% |
| C | 6550 | 200 | 3.053435% |
| D | 6550 | 146 | 2.229008% |
Noise dominated data is calculated using 1-second bins in cleaned event files. If a bin has >2000 counts, and if more than 50% of those come from <1% of pixels, then it is considered to be noise-dominated and hence unusable.
| Quadrant | # 1 sec bins | Bins with >0 counts | Bins with >2000 counts | High rate bins dominated by noise | Noise dominated (total time) | Noise dominated (detector-on time) | Marked lightcurve |
|---|---|---|---|---|---|---|---|
| A | 7551 | 6552 | 5 | 5 | 0.07% | 0.08% | 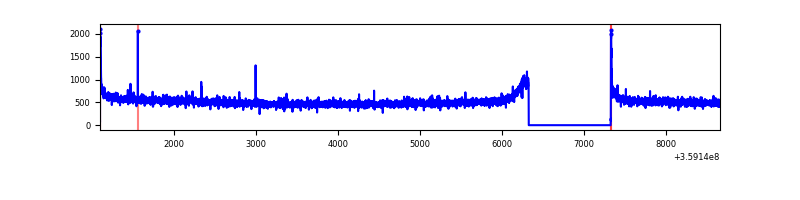 |
| B | 7550 | 6551 | 19 | 19 | 0.25% | 0.29% | 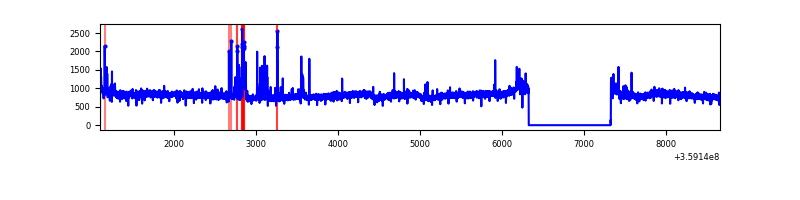 |
| C | 7550 | 6551 | 41 | 41 | 0.54% | 0.63% | 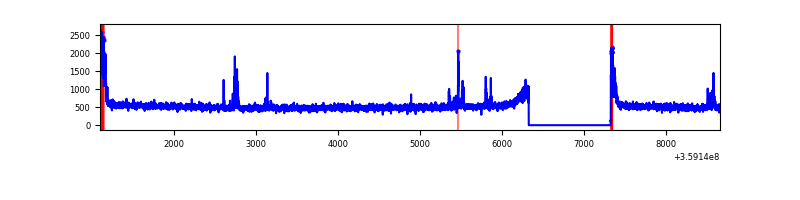 |
| D | 7550 | 6551 | 67 | 67 | 0.89% | 1.02% | 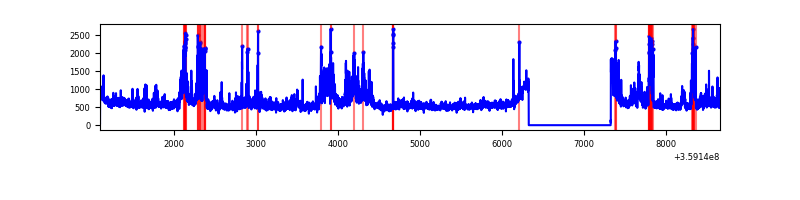 |
Top three noisy pixels from each quadrant. If the there are fewer than three noisy pixels in the level2.evt file, extra rows are filled as -1
| Pixel properties | Quadrant properties | ||||||
|---|---|---|---|---|---|---|---|
| Quadrant | DetID | PixID | Counts | Sigma | Mean | Median | Sigma |
| A | 8 | 192 | 27456 | 154.19 | 868 | 852 | 172.5 |
| A | 13 | 254 | 12493 | 67.47 | 868 | 852 | 172.5 |
| A | 3 | 137 | 8555 | 44.64 | 868 | 852 | 172.5 |
| B | 6 | 159 | 1863920 | 11528.75 | 853 | 833 | 161.6 |
| B | 0 | 229 | 186937 | 1151.61 | 853 | 833 | 161.6 |
| B | 12 | 111 | 19920 | 118.11 | 853 | 833 | 161.6 |
| C | 0 | 10 | 162605 | 854.4 | 812 | 819 | 189.4 |
| C | 14 | 238 | 133154 | 698.87 | 812 | 819 | 189.4 |
| C | 10 | 22 | 79201 | 413.94 | 812 | 819 | 189.4 |
| D | 12 | 227 | 771579 | 3928.97 | 832 | 814 | 196.2 |
| D | 8 | 195 | 380012 | 1932.96 | 832 | 814 | 196.2 |
| D | 2 | 250 | 60280 | 303.13 | 832 | 814 | 196.2 |
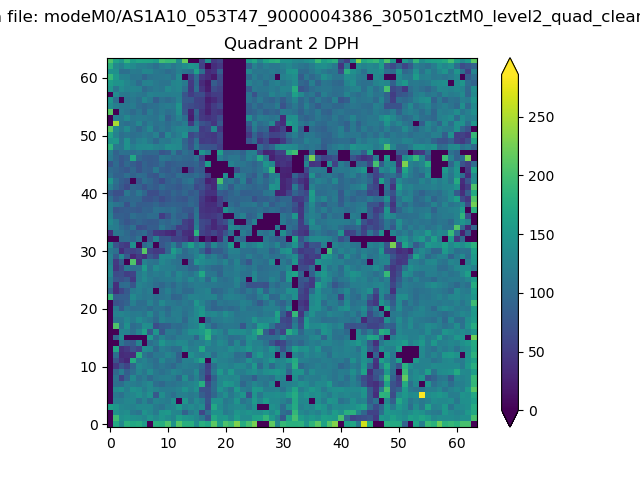
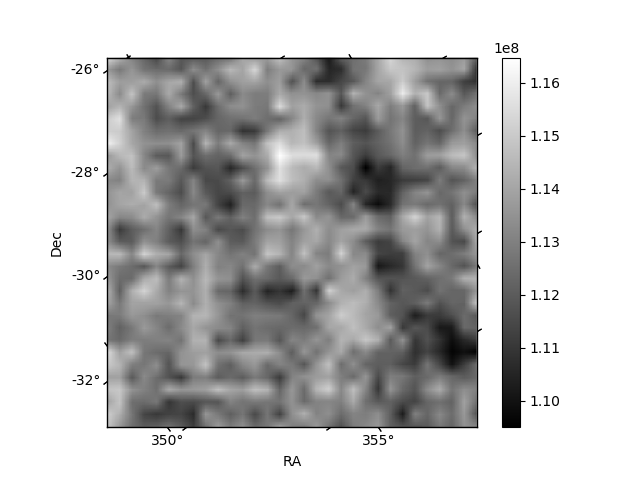
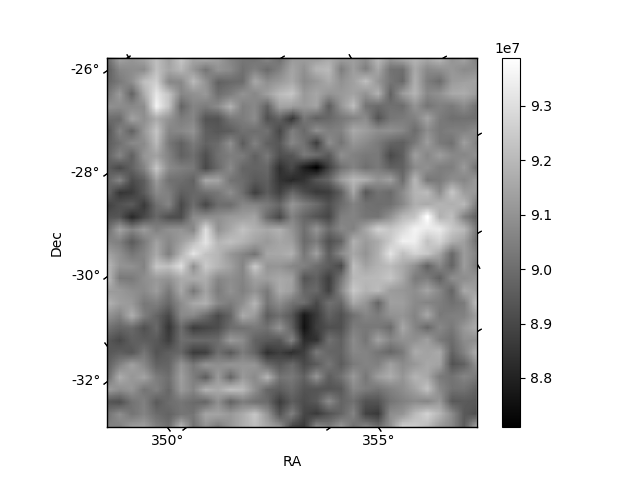
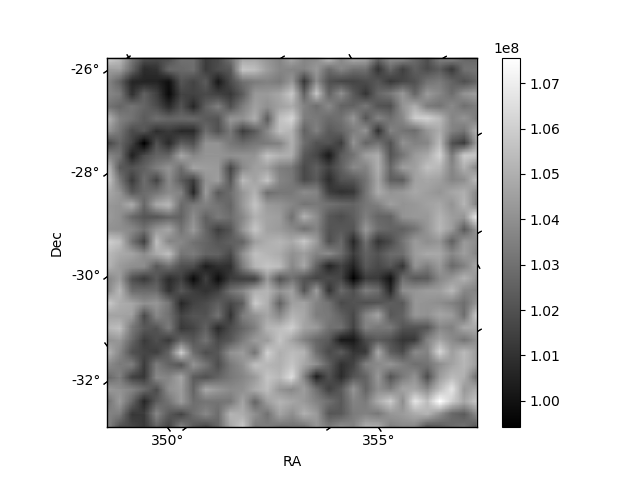
Histogram calculated using DETX and DETY for each event in the final _common_clean file
| Quadrant A | 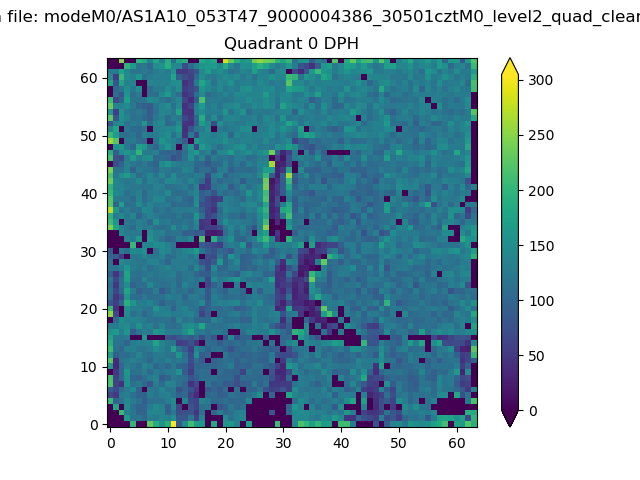 |
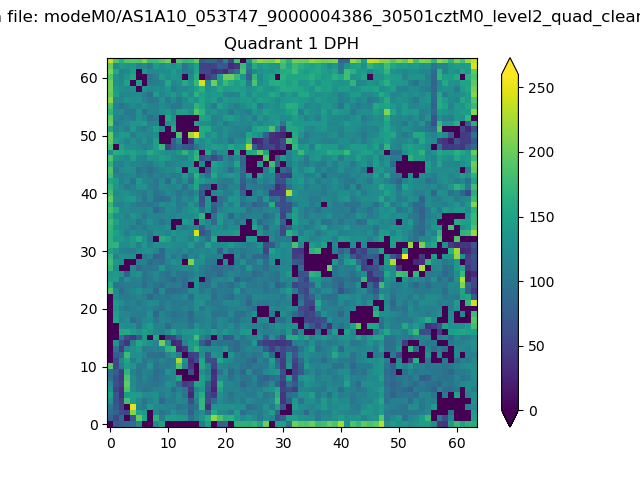 |
Quadrant B |
|---|---|---|---|
| Quadrant D | 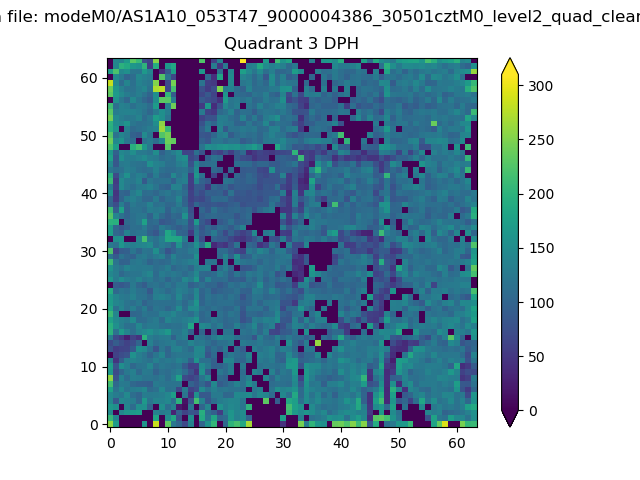 |
 |
Quadrant C |
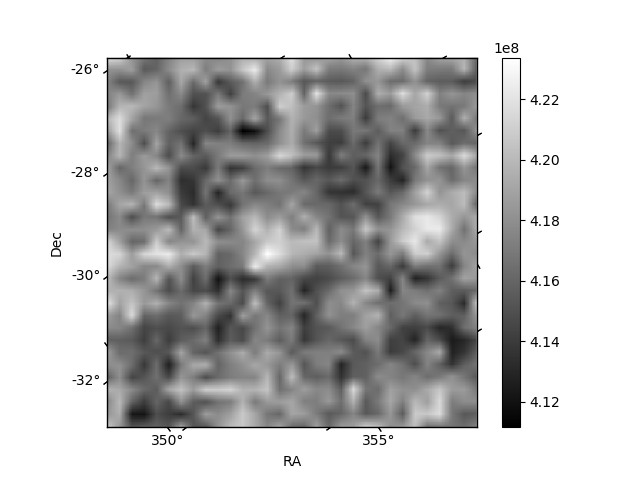
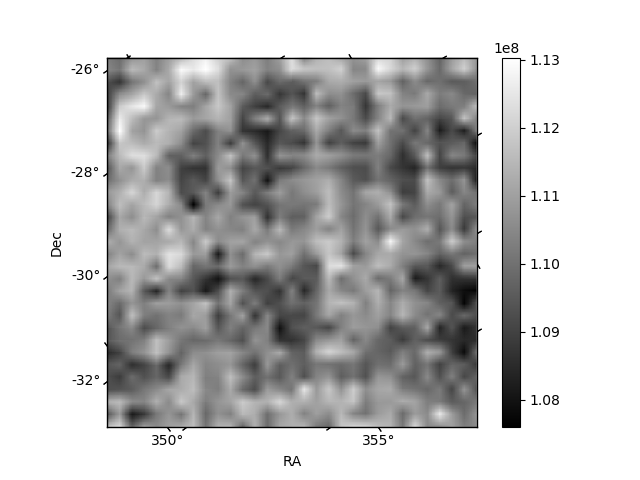
| Plot type | Count rate plots | Images |
|---|---|---|
| Comparison with Poisson distribution Blue bars denote a histogram of data divided into 1 sec bins. Red curve is a Poisson curve with rate = median count rate of data. |
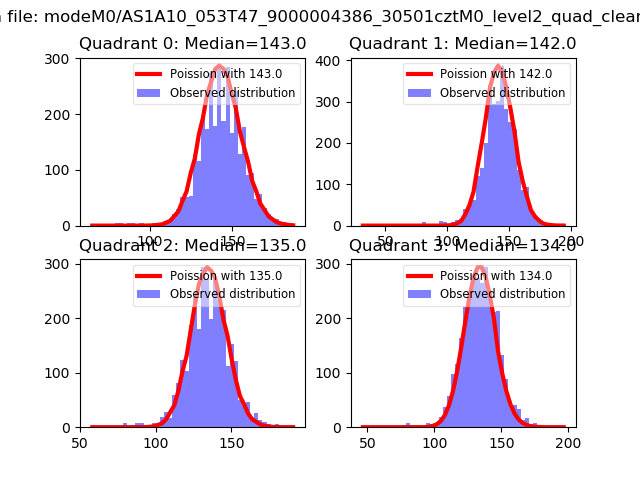 |
 |
| Quadrant-wise count rates Data is divided into 100 sec bins |
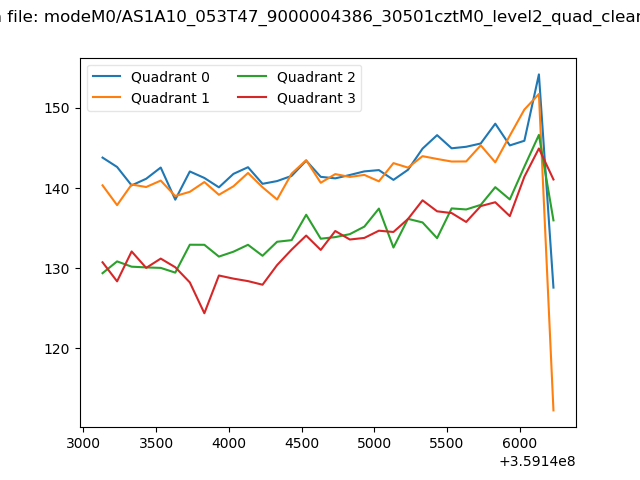 |
|
| Module-wise count rates for Quadrant A Data is divided into 100 sec bins |
 |
 |
| Module-wise count rates for Quadrant B Data is divided into 100 sec bins |
 |
 |
| Module-wise count rates for Quadrant C Data is divided into 100 sec bins |
 |
 |
| Module-wise count rates for Quadrant D Data is divided into 100 sec bins |
 |
 |
| Parameter | Plot |
|---|---|
| CZT HV Monitor | 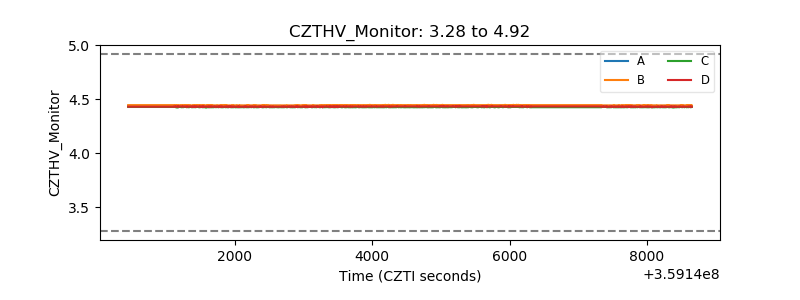 |
| D_VDD | 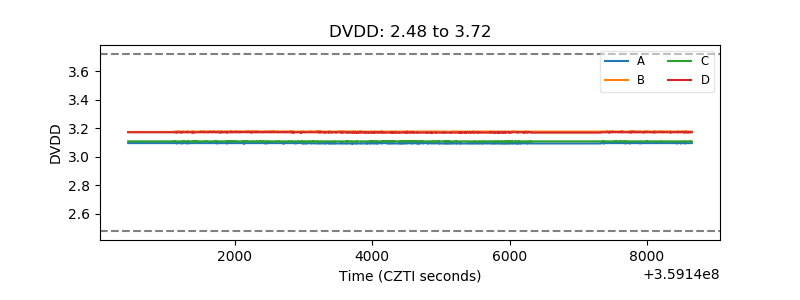 |
| Temperature 1 | 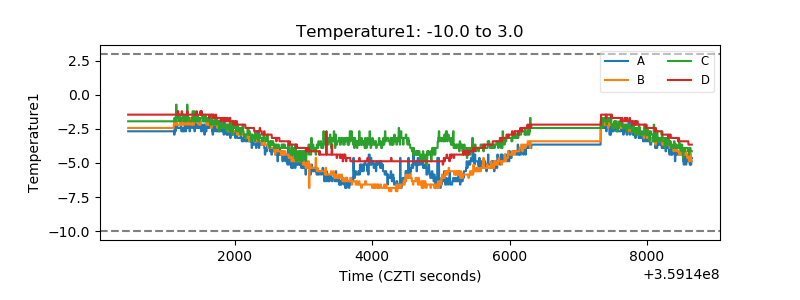 |
| Veto HV Monitor | 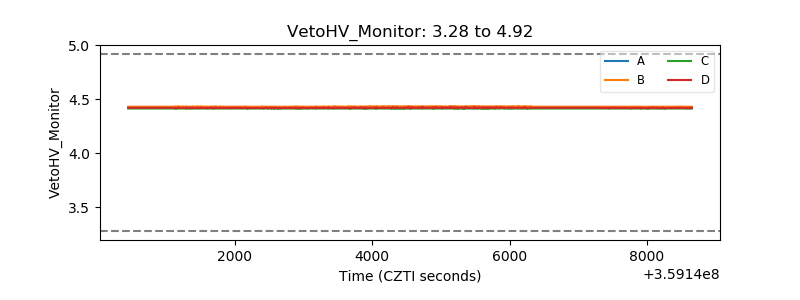 |
| Veto LLD | 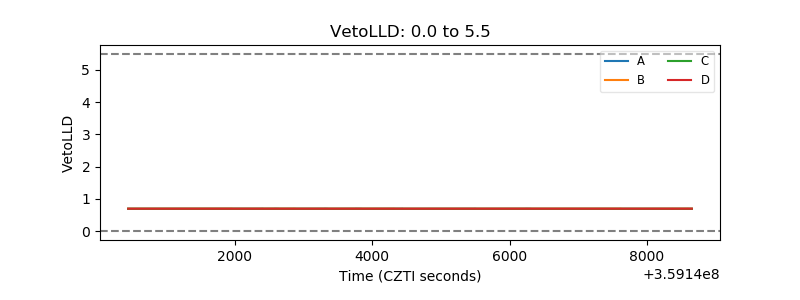 |
| Alpha Counter | 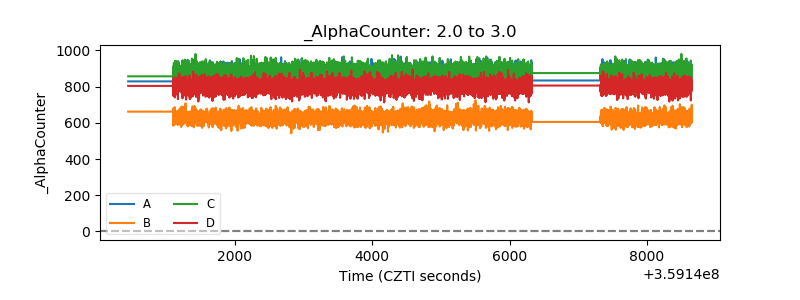 |
| _CPM_Rate | 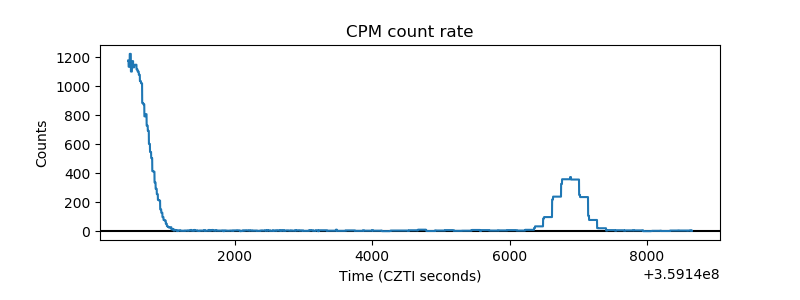 |
| CZT Counter | 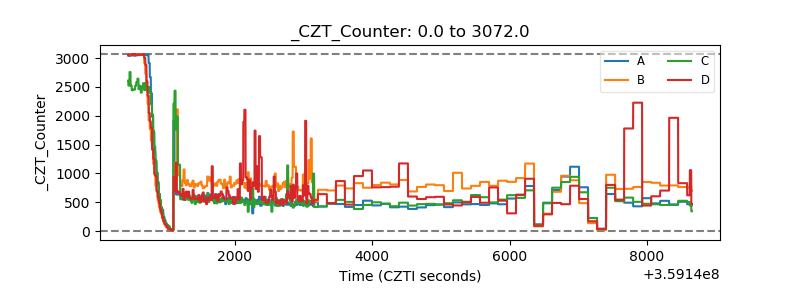 |
| +2.5 Volts monitor | 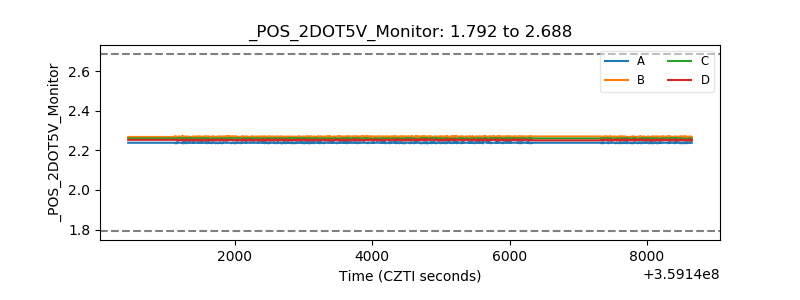 |
| +5 Volts monitor |  |
| _ROLL_ROT |  |
| _Roll_DEC | 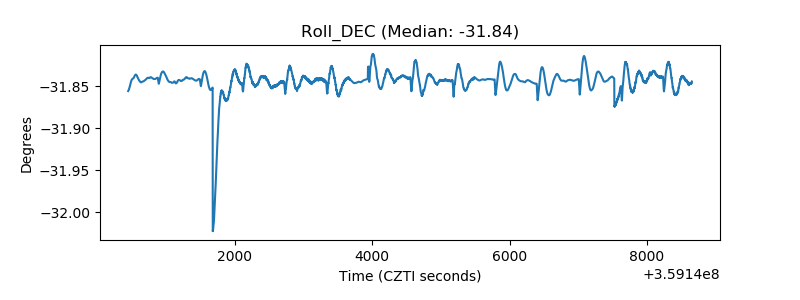 |
| _Roll_RA | 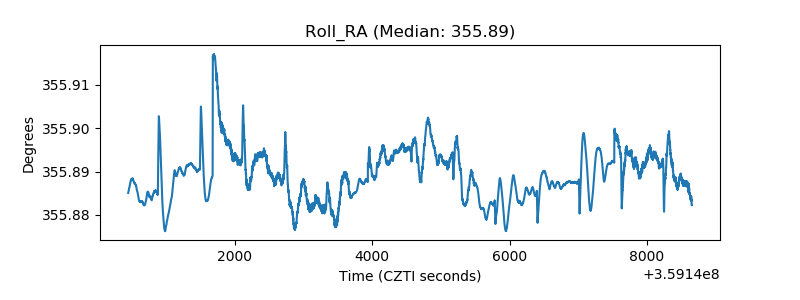 |
| Veto Counter |  |