| Param | Original file | Final file |
|---|---|---|
| Filename | modeM0/AS1A10_053T47_9000004386_30502cztM0_level2.evt | modeM0/AS1A10_053T47_9000004386_30502cztM0_level2_quad_clean.evt |
| Size (bytes) | 582,272,640 | 82,388,160 |
| Size | 555.3 MB | 78.6 MB |
| Events in quadrant A | 3,502,789 | 516,988 |
| Events in quadrant B | 5,695,868 | 510,152 |
| Events in quadrant C | 3,680,158 | 488,504 |
| Events in quadrant D | 4,275,957 | 486,250 |
| Mode SS | |||
|---|---|---|---|
| Quadrant | BADHDUFLAG | Total packets | Discarded packets |
| A | 0 | 144 | 0 |
| B | 0 | 144 | 0 |
| C | 0 | 144 | 0 |
| D | 0 | 144 | 0 |
| Mode M9 | |||
|---|---|---|---|
| Quadrant | BADHDUFLAG | Total packets | Discarded packets |
| A | 0 | 11 | 0 |
| B | 0 | 12 | 0 |
| C | 0 | 12 | 0 |
| D | 0 | 12 | 0 |
| Mode M0 | |||
|---|---|---|---|
| Quadrant | BADHDUFLAG | Total packets | Discarded packets |
| A | 0 | 14767 | 2 |
| B | 0 | 21804 | 2 |
| C | 0 | 15171 | 2 |
| D | 0 | 17076 | 2 |
| Quadrant | Total seconds | Saturated seconds | Saturation percentage |
|---|---|---|---|
| A | 7077 | 96 | 1.356507% |
| B | 7077 | 198 | 2.797796% |
| C | 7077 | 160 | 2.260845% |
| D | 7077 | 127 | 1.794546% |
Noise dominated data is calculated using 1-second bins in cleaned event files. If a bin has >2000 counts, and if more than 50% of those come from <1% of pixels, then it is considered to be noise-dominated and hence unusable.
| Quadrant | # 1 sec bins | Bins with >0 counts | Bins with >2000 counts | High rate bins dominated by noise | Noise dominated (total time) | Noise dominated (detector-on time) | Marked lightcurve |
|---|---|---|---|---|---|---|---|
| A | 7697 | 7078 | 4 | 4 | 0.05% | 0.06% | 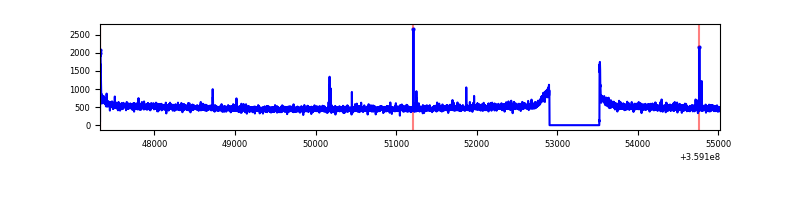 |
| B | 7697 | 7078 | 28 | 28 | 0.36% | 0.40% | 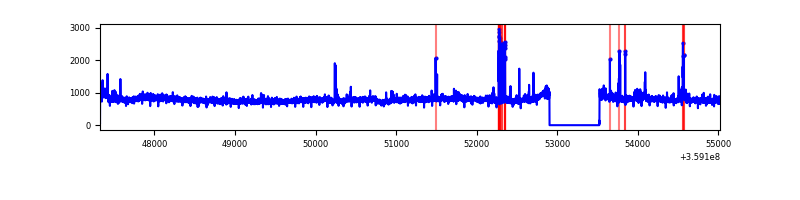 |
| C | 7697 | 7078 | 23 | 23 | 0.30% | 0.32% | 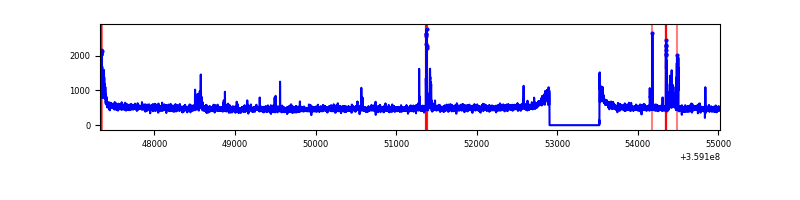 |
| D | 7697 | 7078 | 65 | 65 | 0.84% | 0.92% | 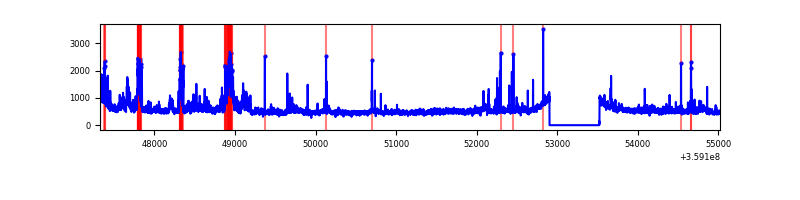 |
Top three noisy pixels from each quadrant. If the there are fewer than three noisy pixels in the level2.evt file, extra rows are filled as -1
| Pixel properties | Quadrant properties | ||||||
|---|---|---|---|---|---|---|---|
| Quadrant | DetID | PixID | Counts | Sigma | Mean | Median | Sigma |
| A | 8 | 192 | 26510 | 142.66 | 895 | 878 | 179.7 |
| A | 12 | 96 | 20352 | 108.39 | 895 | 878 | 179.7 |
| A | 13 | 254 | 13392 | 69.65 | 895 | 878 | 179.7 |
| B | 6 | 159 | 2005678 | 11938.85 | 877 | 856 | 167.9 |
| B | 0 | 229 | 202513 | 1200.88 | 877 | 856 | 167.9 |
| B | 12 | 111 | 20763 | 118.55 | 877 | 856 | 167.9 |
| C | 14 | 238 | 137454 | 694.78 | 844 | 852 | 196.6 |
| C | 10 | 22 | 127057 | 641.89 | 844 | 852 | 196.6 |
| C | 0 | 10 | 62978 | 315.98 | 844 | 852 | 196.6 |
| D | 12 | 227 | 441632 | 2148.48 | 862 | 839 | 205.2 |
| D | 8 | 195 | 418371 | 2035.1 | 862 | 839 | 205.2 |
| D | 2 | 250 | 49254 | 235.98 | 862 | 839 | 205.2 |
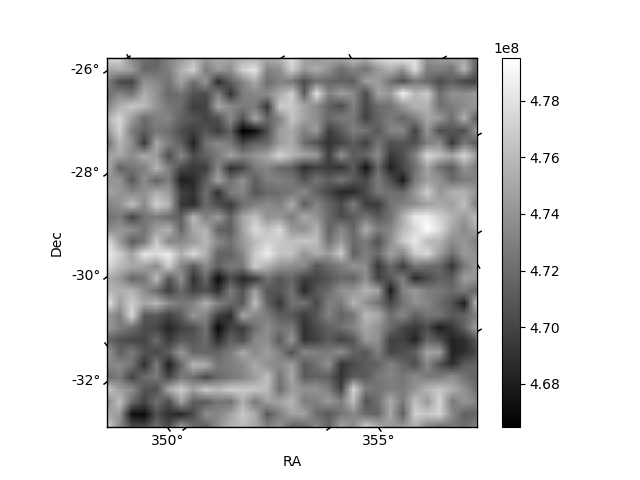
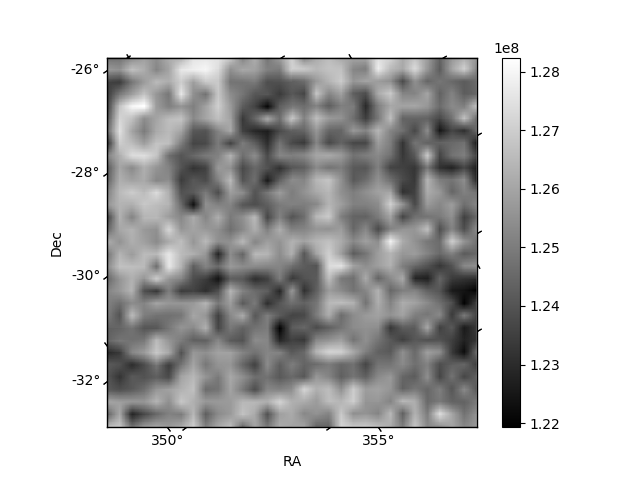
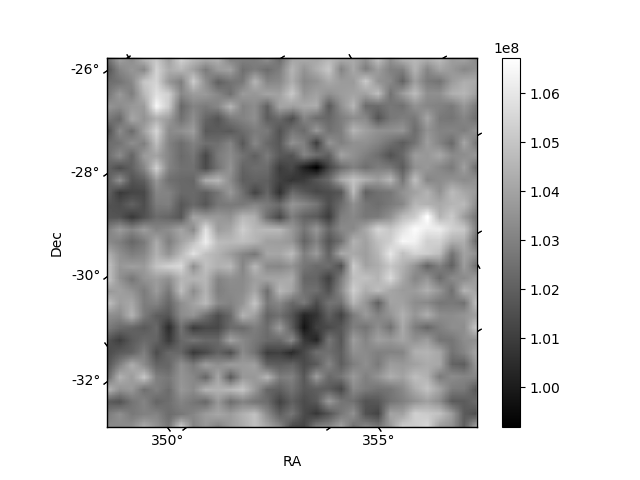
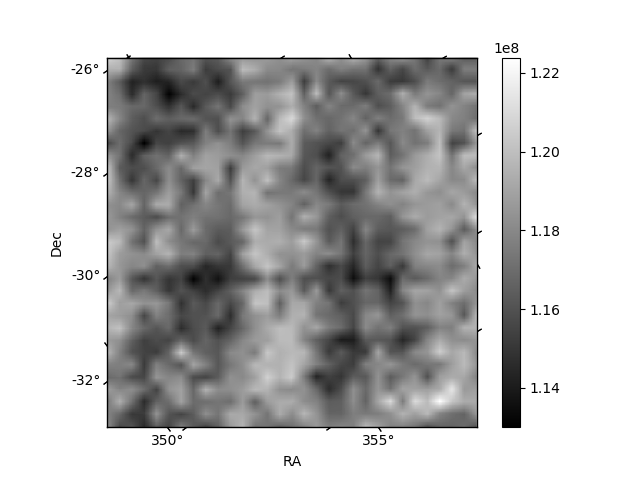
Histogram calculated using DETX and DETY for each event in the final _common_clean file
| Quadrant A | 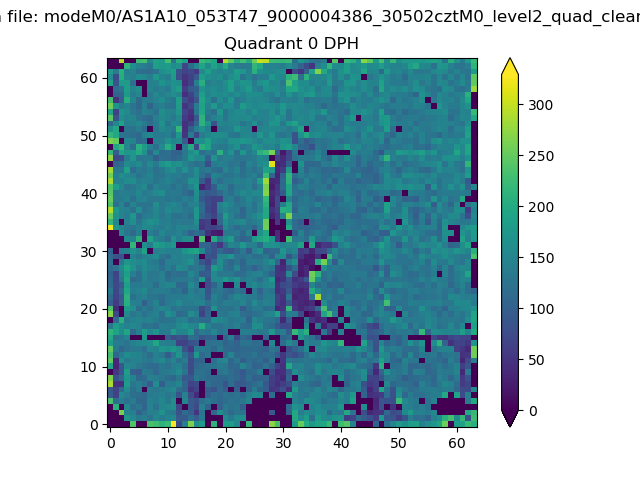 |
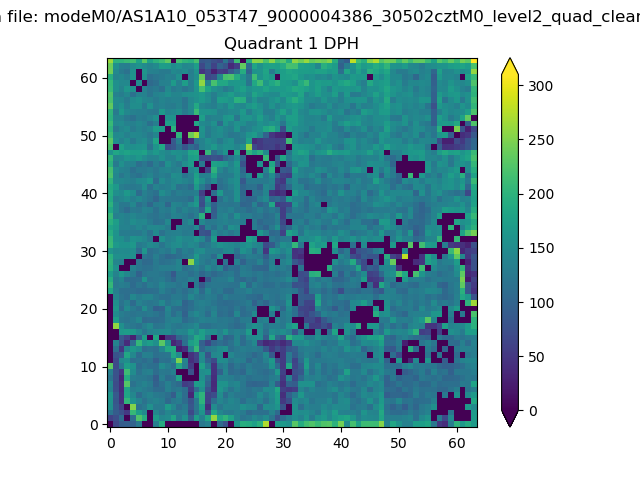 |
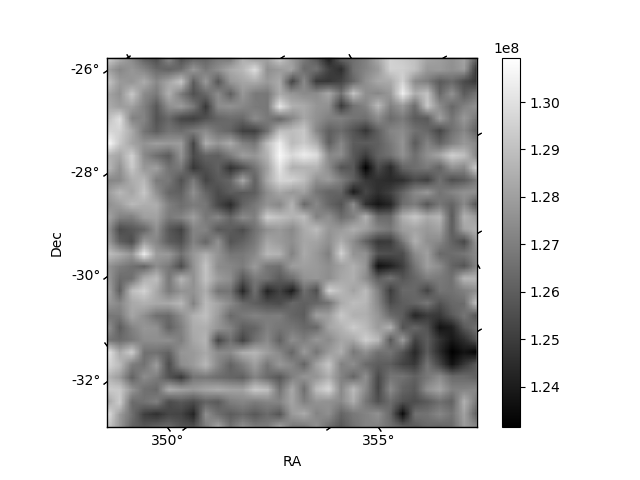
Quadrant B |
|---|---|---|---|
| Quadrant D | 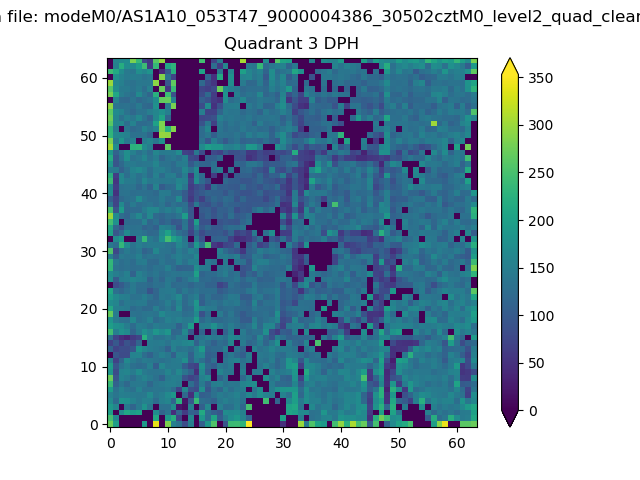 |
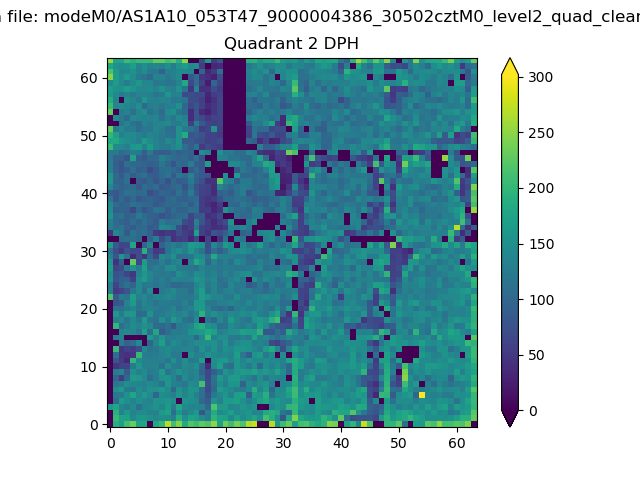 |
Quadrant C |
| Plot type | Count rate plots | Images |
|---|---|---|
| Comparison with Poisson distribution Blue bars denote a histogram of data divided into 1 sec bins. Red curve is a Poisson curve with rate = median count rate of data. |
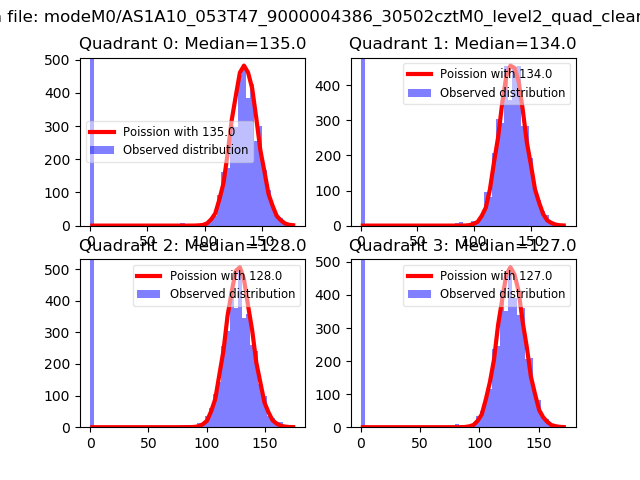 |
 |
| Quadrant-wise count rates Data is divided into 100 sec bins |
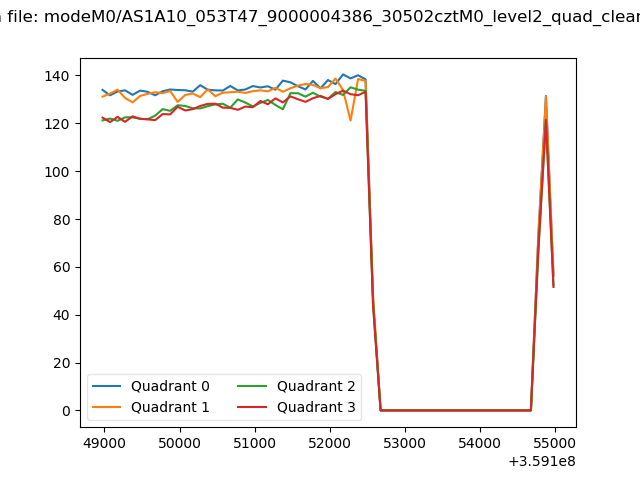 |
|
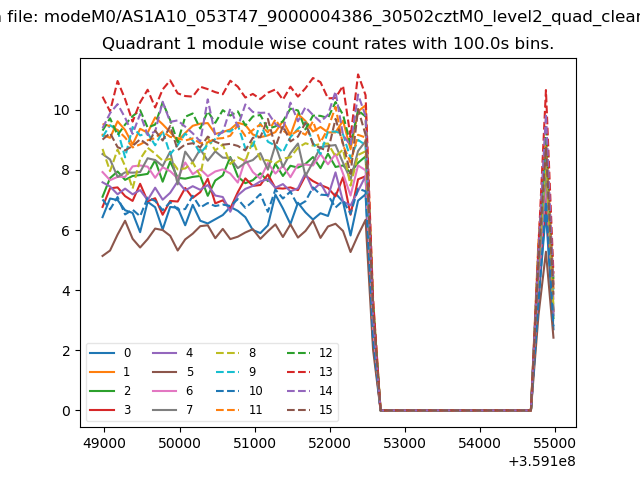
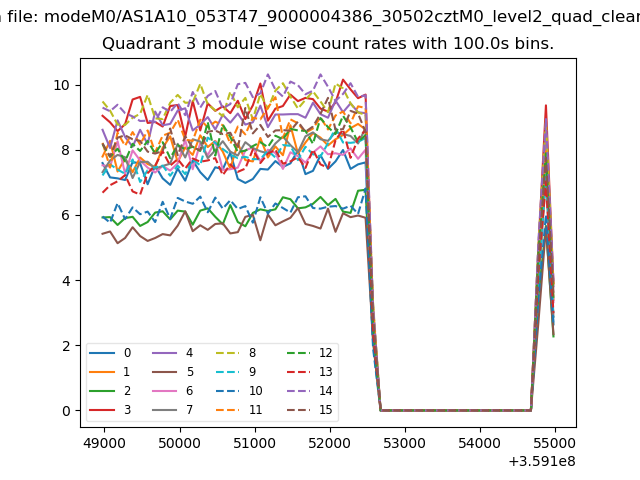
| Module-wise count rates for Quadrant A Data is divided into 100 sec bins |
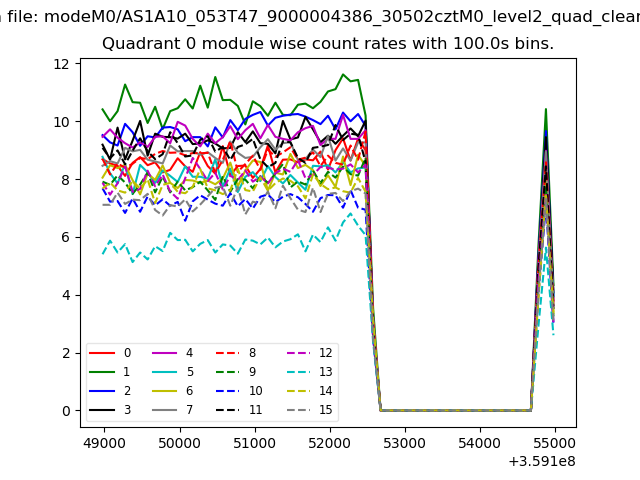 |
 |
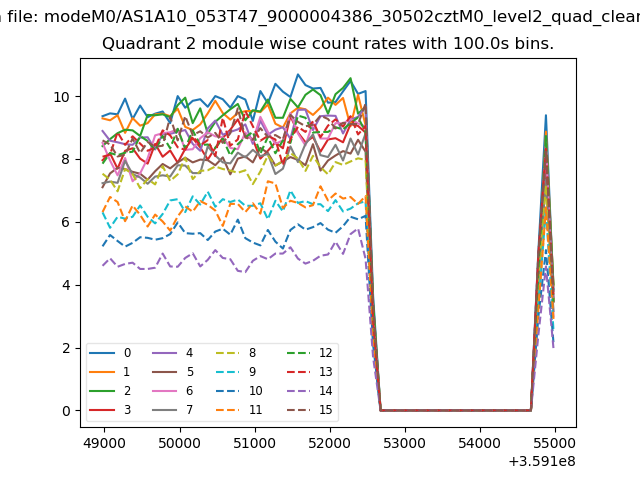
| Module-wise count rates for Quadrant B Data is divided into 100 sec bins |
 |
 |
| Module-wise count rates for Quadrant C Data is divided into 100 sec bins |
 |
 |
| Module-wise count rates for Quadrant D Data is divided into 100 sec bins |
 |
 |
| Parameter | Plot |
|---|---|
| CZT HV Monitor |  |
| D_VDD | 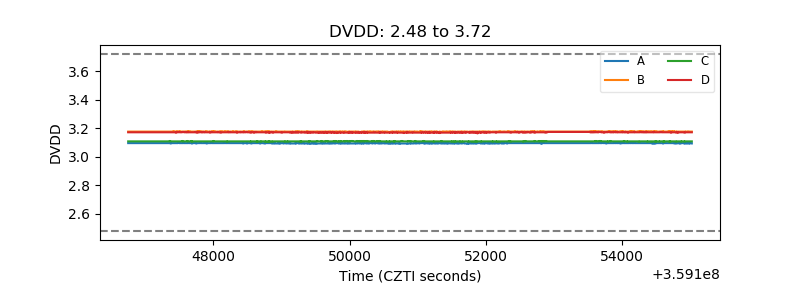 |
| Temperature 1 | 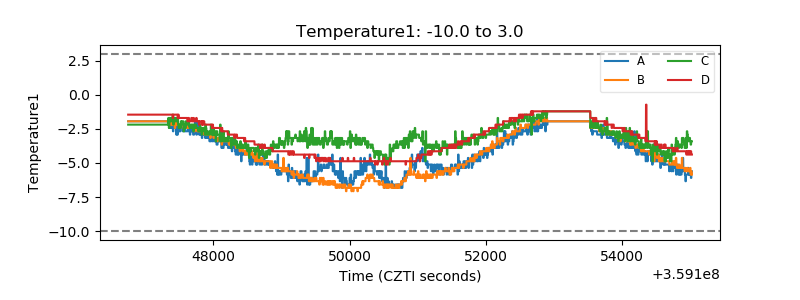 |
| Veto HV Monitor | 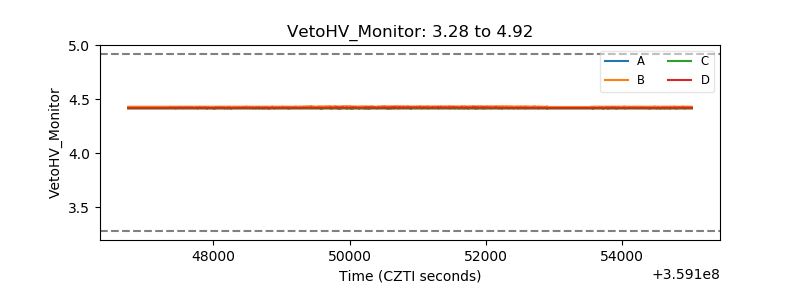 |
| Veto LLD | 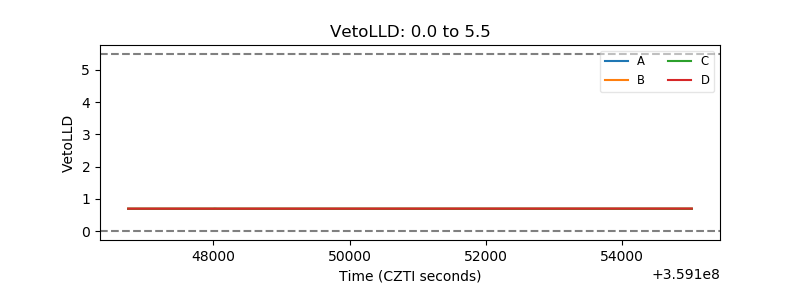 |
| Alpha Counter |  |
| _CPM_Rate |  |
| CZT Counter | 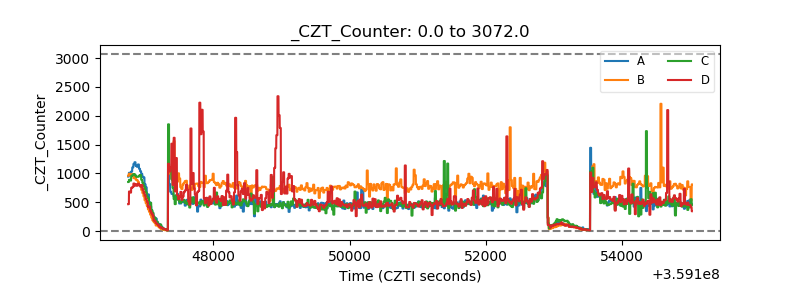 |
| +2.5 Volts monitor |  |
| +5 Volts monitor |  |
| _ROLL_ROT | 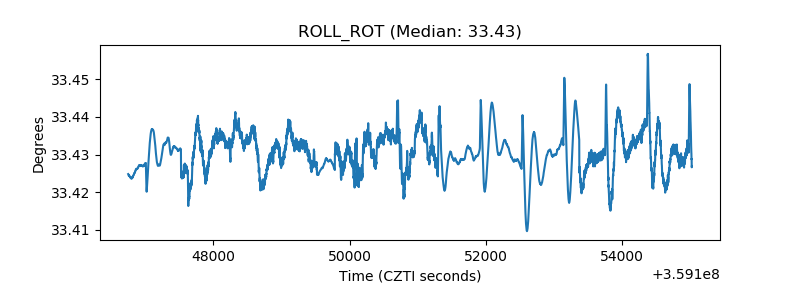 |
| _Roll_DEC | 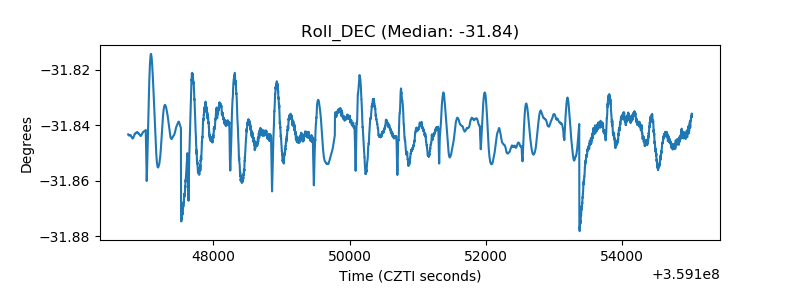 |
| _Roll_RA | 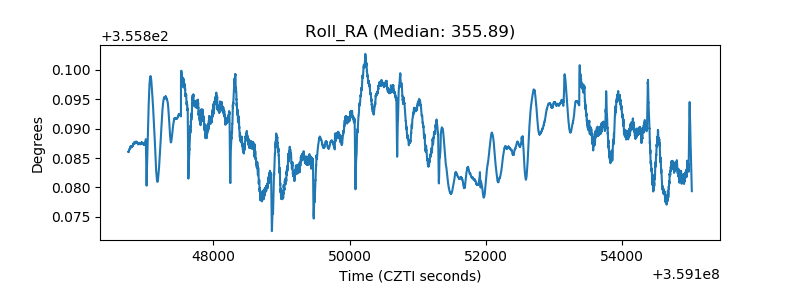 |
| Veto Counter | 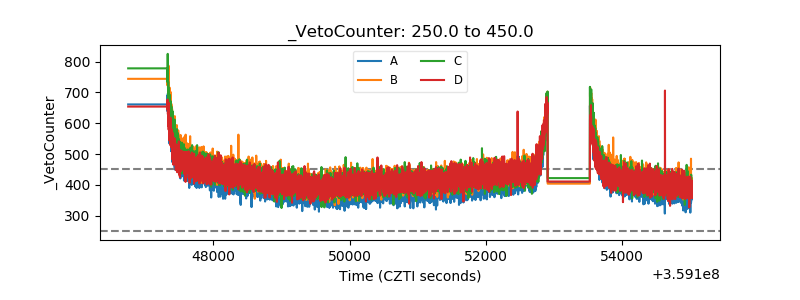 |