| Param | Original file | Final file |
|---|---|---|
| Filename | modeM0/AS1A10_053T47_9000004386_30503cztM0_level2.evt | modeM0/AS1A10_053T47_9000004386_30503cztM0_level2_quad_clean.evt |
| Size (bytes) | 161,570,880 | 15,914,880 |
| Size | 154.1 MB | 15.2 MB |
| Events in quadrant A | 984,706 | 88,012 |
| Events in quadrant B | 1,602,415 | 87,240 |
| Events in quadrant C | 1,038,221 | 81,399 |
| Events in quadrant D | 1,131,122 | 80,679 |
| Mode SS | |||
|---|---|---|---|
| Quadrant | BADHDUFLAG | Total packets | Discarded packets |
| A | 0 | 40 | 0 |
| B | 0 | 40 | 0 |
| C | 0 | 40 | 0 |
| D | 0 | 40 | 0 |
| Mode M9 | |||
|---|---|---|---|
| Quadrant | BADHDUFLAG | Total packets | Discarded packets |
| A | 0 | 1 | 0 |
| B | 0 | 2 | 0 |
| C | 0 | 2 | 0 |
| D | 0 | 2 | 0 |
| Mode M0 | |||
|---|---|---|---|
| Quadrant | BADHDUFLAG | Total packets | Discarded packets |
| A | 0 | 4157 | 1 |
| B | 0 | 6137 | 1 |
| C | 0 | 4301 | 1 |
| D | 0 | 4558 | 1 |
| Quadrant | Total seconds | Saturated seconds | Saturation percentage |
|---|---|---|---|
| A | 1976 | 34 | 1.720648% |
| B | 1976 | 66 | 3.340081% |
| C | 1976 | 64 | 3.238866% |
| D | 1976 | 30 | 1.518219% |
Noise dominated data is calculated using 1-second bins in cleaned event files. If a bin has >2000 counts, and if more than 50% of those come from <1% of pixels, then it is considered to be noise-dominated and hence unusable.
| Quadrant | # 1 sec bins | Bins with >0 counts | Bins with >2000 counts | High rate bins dominated by noise | Noise dominated (total time) | Noise dominated (detector-on time) | Marked lightcurve |
|---|---|---|---|---|---|---|---|
| A | 1976 | 1976 | 1 | 1 | 0.05% | 0.05% | 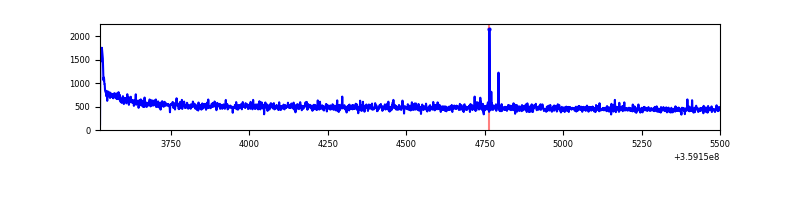 |
| B | 1976 | 1976 | 8 | 8 | 0.40% | 0.40% | 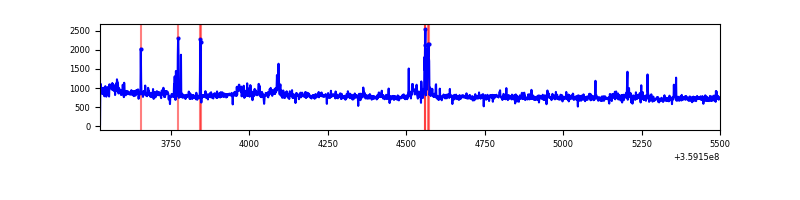 |
| C | 1976 | 1976 | 8 | 8 | 0.40% | 0.40% | 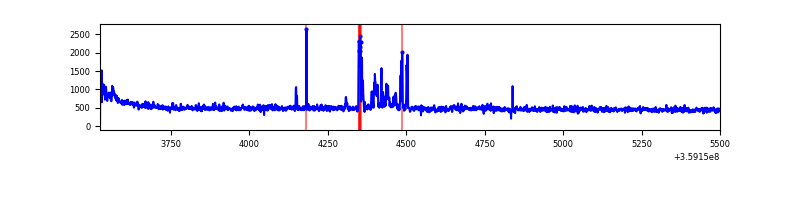 |
| D | 1976 | 1976 | 19 | 19 | 0.96% | 0.96% | 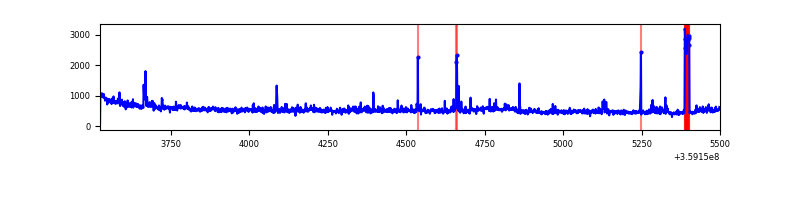 |
Top three noisy pixels from each quadrant. If the there are fewer than three noisy pixels in the level2.evt file, extra rows are filled as -1
| Pixel properties | Quadrant properties | ||||||
|---|---|---|---|---|---|---|---|
| Quadrant | DetID | PixID | Counts | Sigma | Mean | Median | Sigma |
| A | 8 | 192 | 12702 | 241.77 | 249 | 244 | 51.5 |
| A | 12 | 96 | 7659 | 143.9 | 249 | 244 | 51.5 |
| A | 13 | 254 | 3737 | 67.79 | 249 | 244 | 51.5 |
| B | 6 | 159 | 542610 | 11025.52 | 246 | 240 | 49.2 |
| B | 0 | 229 | 62267 | 1260.91 | 246 | 240 | 49.2 |
| B | 6 | 36 | 14688 | 293.7 | 246 | 240 | 49.2 |
| C | 10 | 22 | 49766 | 888.4 | 232 | 234 | 55.8 |
| C | 14 | 238 | 38839 | 692.41 | 232 | 234 | 55.8 |
| C | 3 | 233 | 27454 | 488.21 | 232 | 234 | 55.8 |
| D | 8 | 195 | 145482 | 2470.61 | 237 | 229 | 58.8 |
| D | 2 | 120 | 41826 | 707.52 | 237 | 229 | 58.8 |
| D | 2 | 250 | 20046 | 337.07 | 237 | 229 | 58.8 |
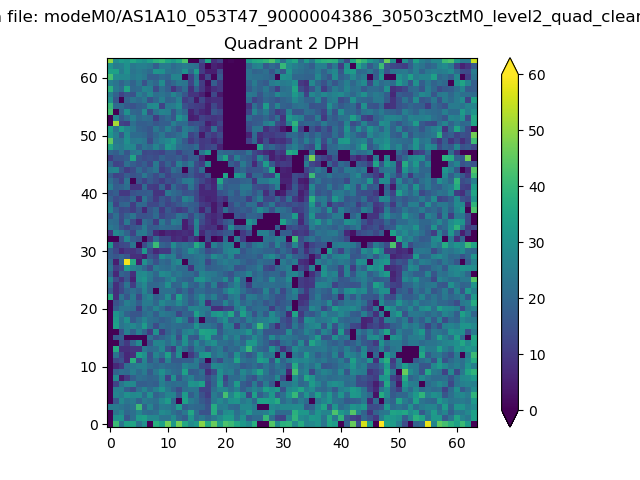
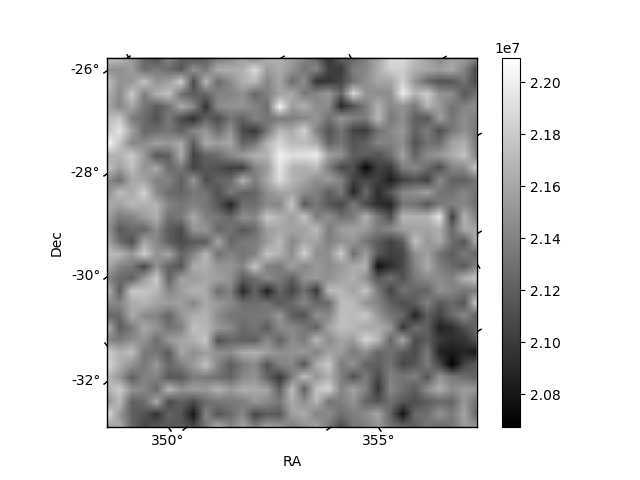
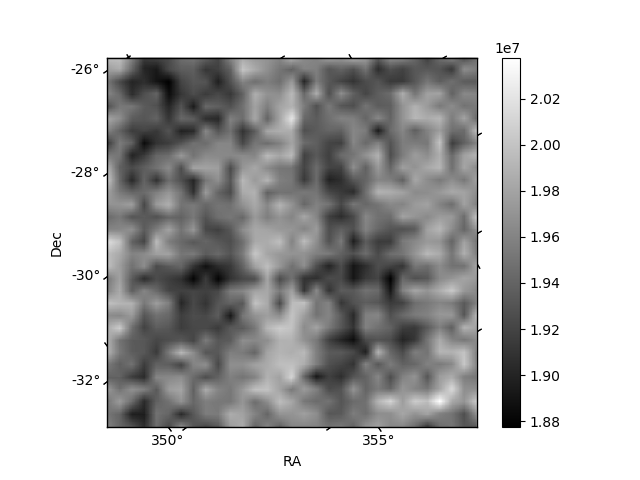
Histogram calculated using DETX and DETY for each event in the final _common_clean file
| Quadrant A | 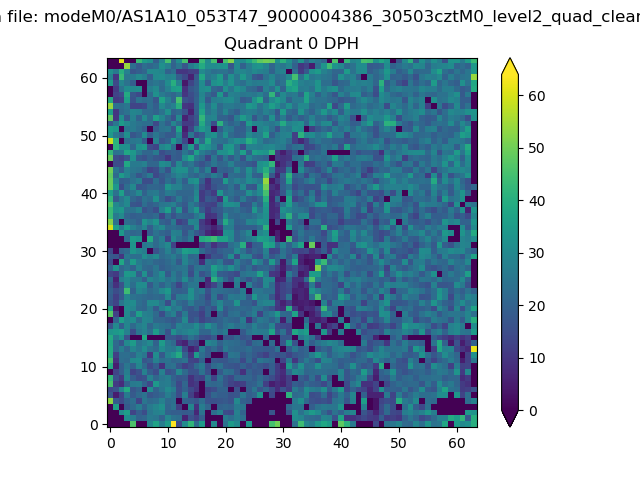 |
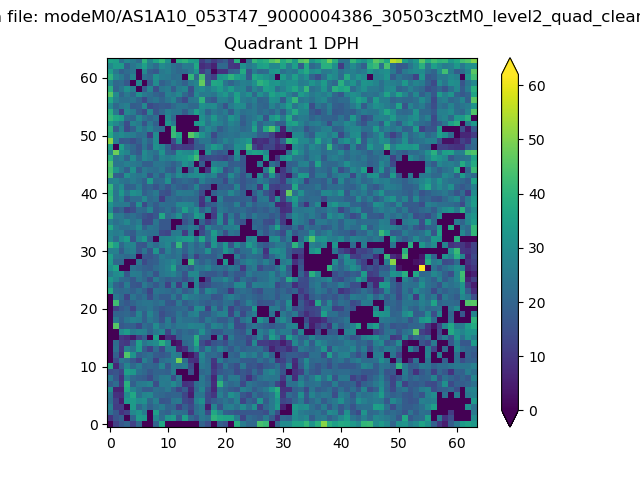 |
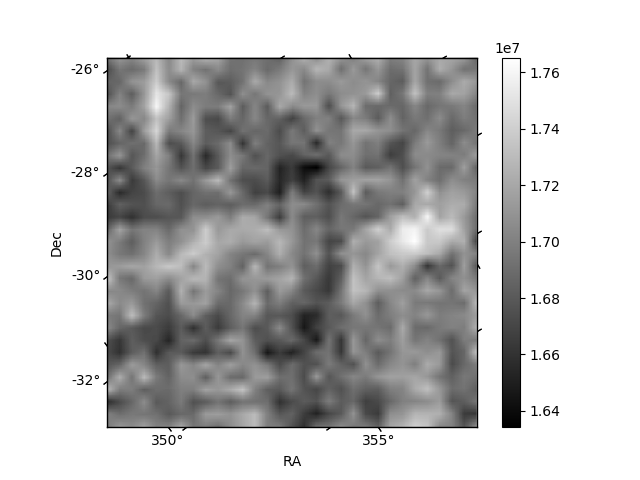
Quadrant B |
|---|---|---|---|
| Quadrant D | 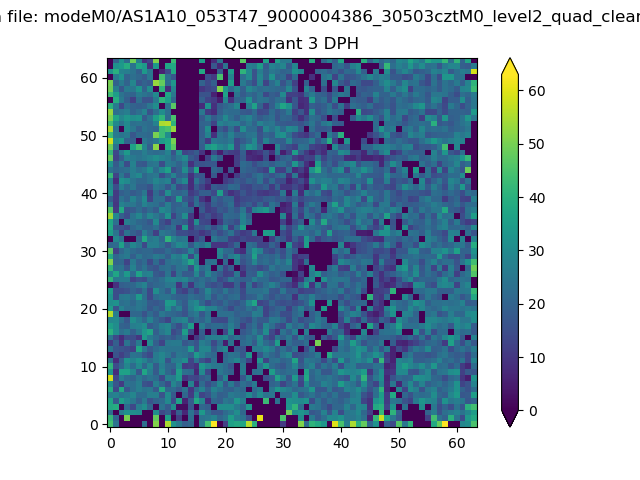 |
 |
Quadrant C |
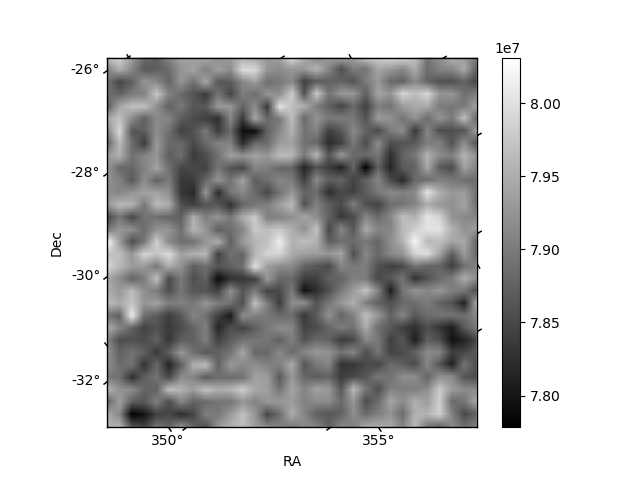
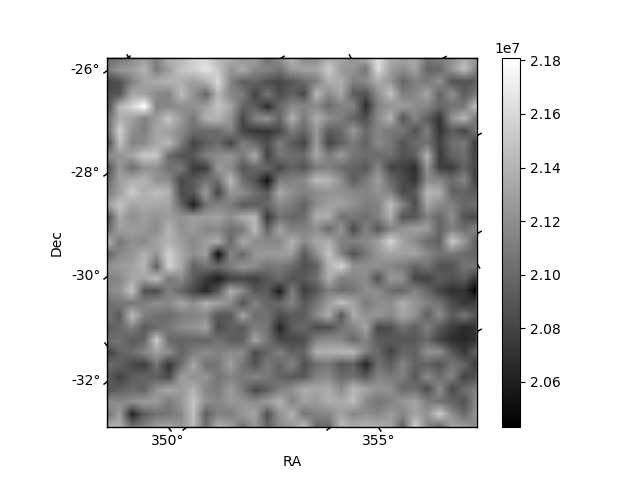
| Plot type | Count rate plots | Images |
|---|---|---|
| Comparison with Poisson distribution Blue bars denote a histogram of data divided into 1 sec bins. Red curve is a Poisson curve with rate = median count rate of data. |
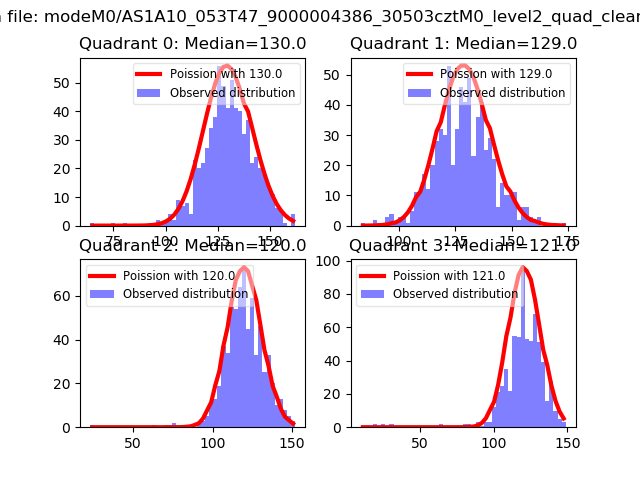 |
 |
| Quadrant-wise count rates Data is divided into 100 sec bins |
 |
|
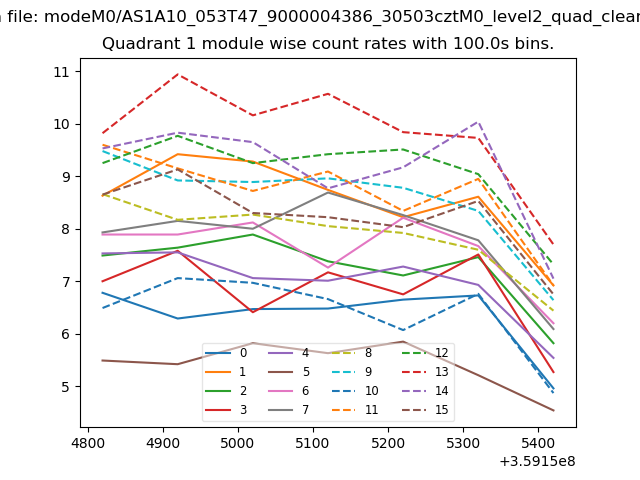
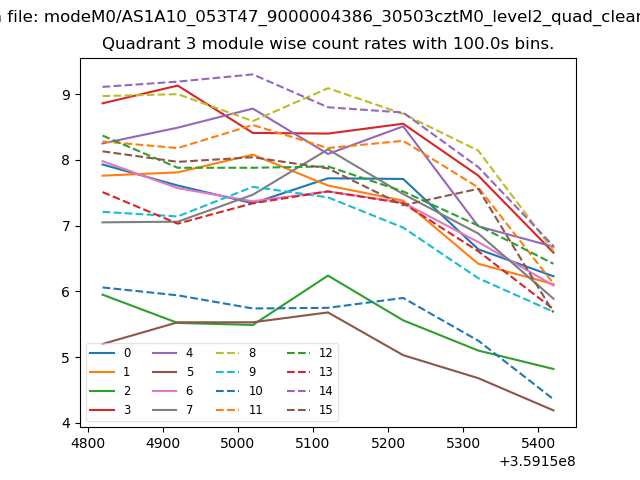
| Module-wise count rates for Quadrant A Data is divided into 100 sec bins |
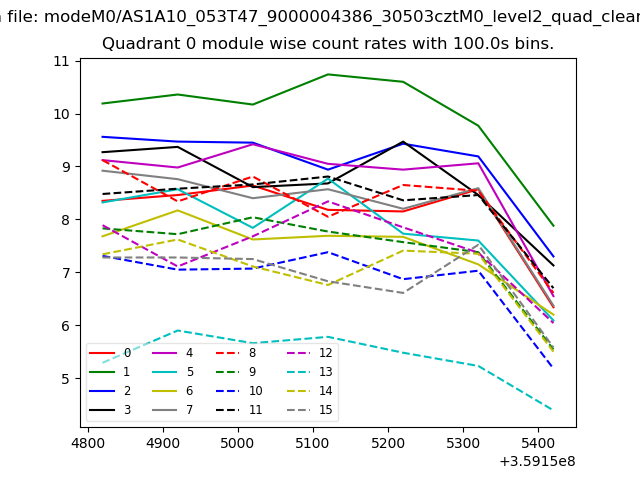 |
 |
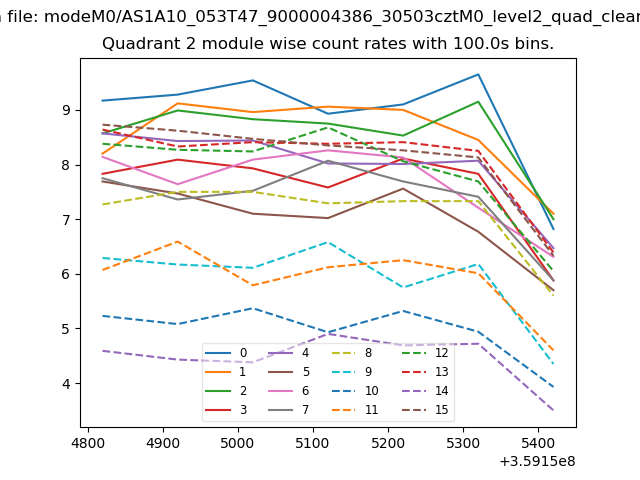
| Module-wise count rates for Quadrant B Data is divided into 100 sec bins |
 |
 |
| Module-wise count rates for Quadrant C Data is divided into 100 sec bins |
 |
 |
| Module-wise count rates for Quadrant D Data is divided into 100 sec bins |
 |
 |
| Parameter | Plot |
|---|---|
| CZT HV Monitor | 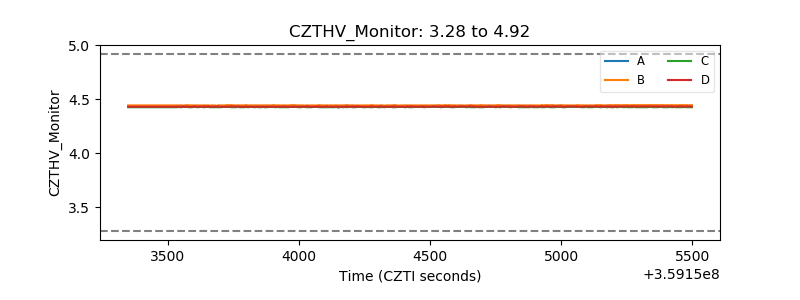 |
| D_VDD | 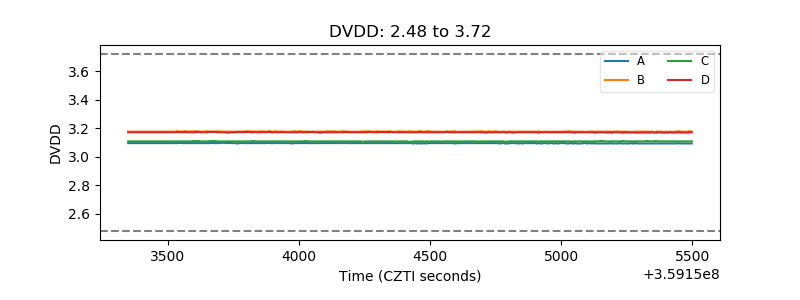 |
| Temperature 1 | 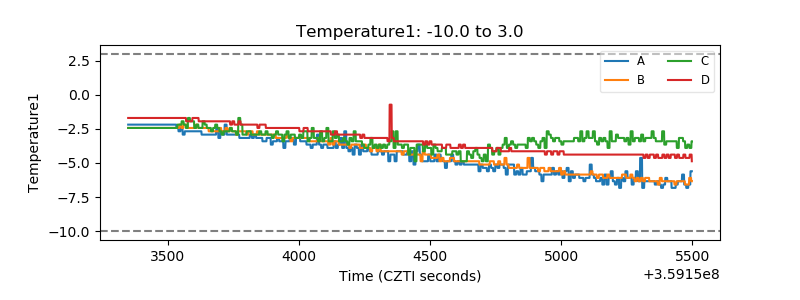 |
| Veto HV Monitor | 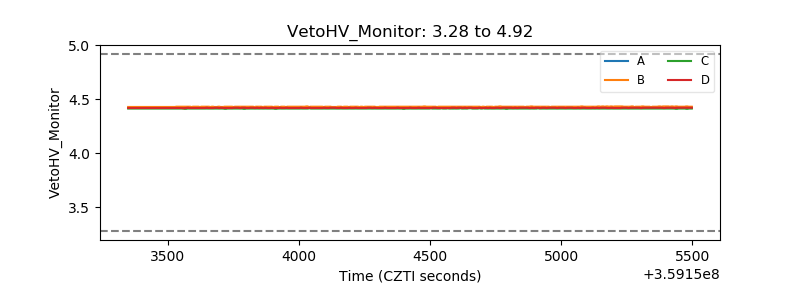 |
| Veto LLD | 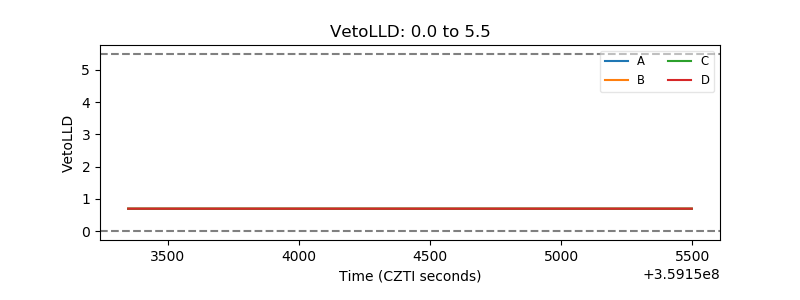 |
| Alpha Counter |  |
| _CPM_Rate |  |
| CZT Counter | 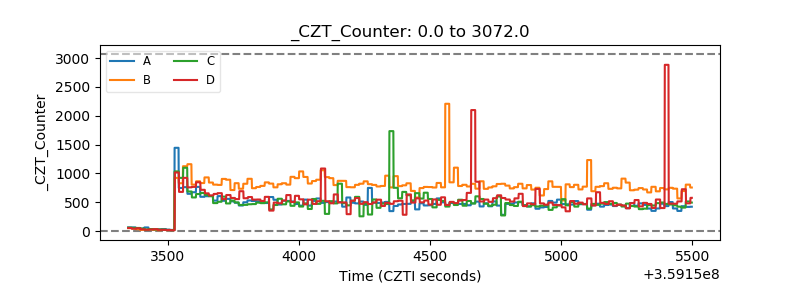 |
| +2.5 Volts monitor |  |
| +5 Volts monitor |  |
| _ROLL_ROT | 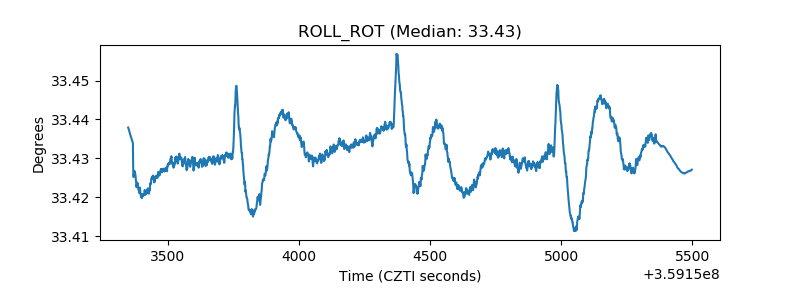 |
| _Roll_DEC | 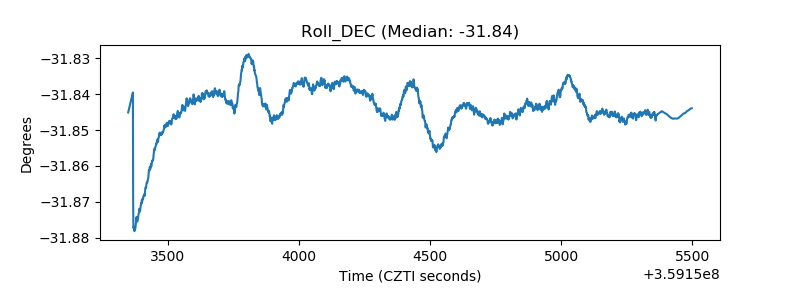 |
| _Roll_RA | 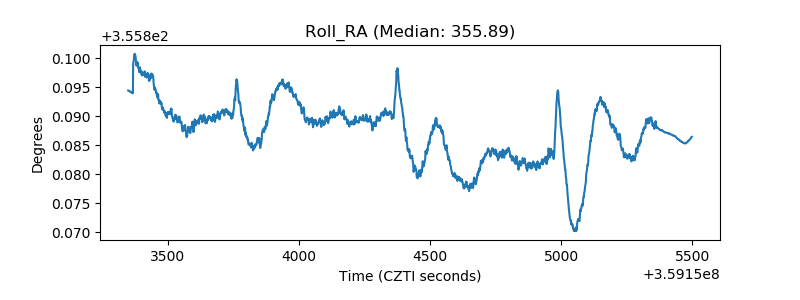 |
| Veto Counter | 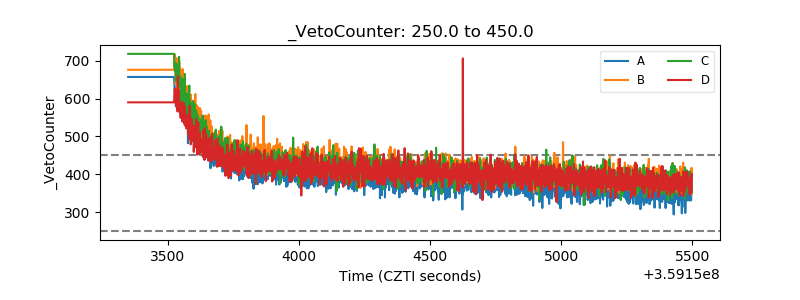 |