| Param | Original file | Final file |
|---|---|---|
| Filename | modeM0/AS1C05_019T04_9000004388cztM0_level2.fits | modeM0/AS1C05_019T04_9000004388cztM0_level2_quad_clean.evt |
| Size (bytes) | 996,419,520 | 1,103,690,880 |
| Size | 950.3 MB | 1.0 GB |
| Events in quadrant A | 6,201,458 | 7,007,766 |
| Events in quadrant B | 5,750,318 | 6,789,799 |
| Events in quadrant C | 5,973,580 | 6,620,292 |
| Events in quadrant D | 5,230,870 | 5,991,251 |
| Mode M0 | |||
|---|---|---|---|
| Quadrant | BADHDUFLAG | Total packets | Discarded packets |
| A | 0 | 214322 | 0 |
| B | 0 | 320573 | 0 |
| C | 0 | 221286 | 0 |
| D | 0 | 265044 | 0 |
| Mode M9 | |||
|---|---|---|---|
| Quadrant | BADHDUFLAG | Total packets | Discarded packets |
| A | 0 | 141 | 0 |
| B | 0 | 141 | 0 |
| C | 0 | 141 | 0 |
| D | 0 | 141 | 0 |
| Mode SS | |||
|---|---|---|---|
| Quadrant | BADHDUFLAG | Total packets | Discarded packets |
| A | 0 | 2082 | 0 |
| B | 0 | 2082 | 0 |
| C | 0 | 2082 | 0 |
| D | 0 | 2082 | 0 |
| Quadrant | Total seconds | Saturated seconds | Saturation percentage |
|---|---|---|---|
| A | 102403 | 1027 | 1.002900% |
| B | 102403 | 3099 | 3.026279% |
| C | 102403 | 2661 | 2.598557% |
| D | 102403 | 4082 | 3.986211% |
Noise dominated data is calculated using 1-second bins in cleaned event files. If a bin has >2000 counts, and if more than 50% of those come from <1% of pixels, then it is considered to be noise-dominated and hence unusable.
| Quadrant | # 1 sec bins | Bins with >0 counts | Bins with >2000 counts | High rate bins dominated by noise | Noise dominated (total time) | Noise dominated (detector-on time) | Marked lightcurve |
|---|---|---|---|---|---|---|---|
| A | 116417 | 102399 | 0 | 0 | 0.00% | 0.00% | 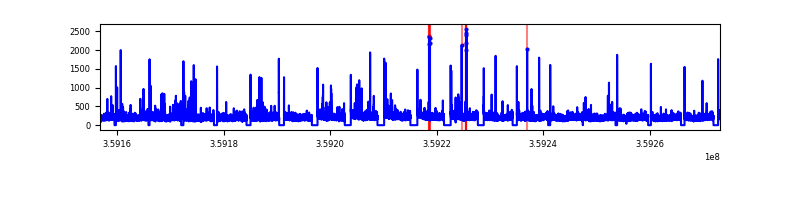 |
| B | 116418 | 102375 | 0 | 0 | 0.00% | 0.00% |  |
| C | 116418 | 102400 | 0 | 0 | 0.00% | 0.00% | 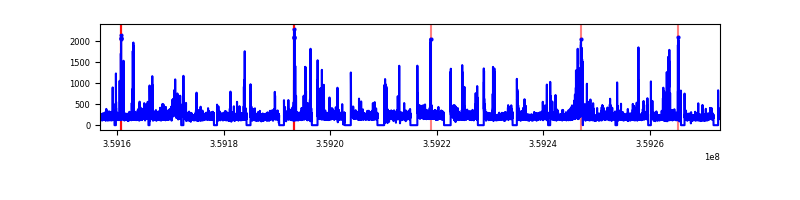 |
| D | 116418 | 102337 | 0 | 0 | 0.00% | 0.00% |  |
Top three noisy pixels from each quadrant. If the there are fewer than three noisy pixels in the level2.evt file, extra rows are filled as -1
| Pixel properties | Quadrant properties | ||||||
|---|---|---|---|---|---|---|---|
| Quadrant | DetID | PixID | Counts | Sigma | Mean | Median | Sigma |
| A | 0 | 29 | 6002 | 11.5 | 1615 | 1525 | 389.1 |
| A | 7 | 110 | 4875 | 8.61 | 1615 | 1525 | 389.1 |
| A | 0 | 30 | 4755 | 8.3 | 1615 | 1525 | 389.1 |
| B | 2 | 9 | 4670 | 10.75 | 1523 | 1454 | 299.1 |
| B | 3 | 80 | 3863 | 8.05 | 1523 | 1454 | 299.1 |
| B | 2 | 8 | 3846 | 8.0 | 1523 | 1454 | 299.1 |
| C | 12 | 241 | 4265 | 7.07 | 1579 | 1486 | 393.2 |
| C | 9 | 209 | 3956 | 6.28 | 1579 | 1486 | 393.2 |
| C | 3 | 126 | 3950 | 6.27 | 1579 | 1486 | 393.2 |
| D | 15 | 46 | 4094 | 6.89 | 1497 | 1366 | 396.0 |
| D | 10 | 189 | 3650 | 5.77 | 1497 | 1366 | 396.0 |
| D | 6 | 67 | 3616 | 5.68 | 1497 | 1366 | 396.0 |
Histogram calculated using DETX and DETY for each event in the final _common_clean file
| Quadrant A | 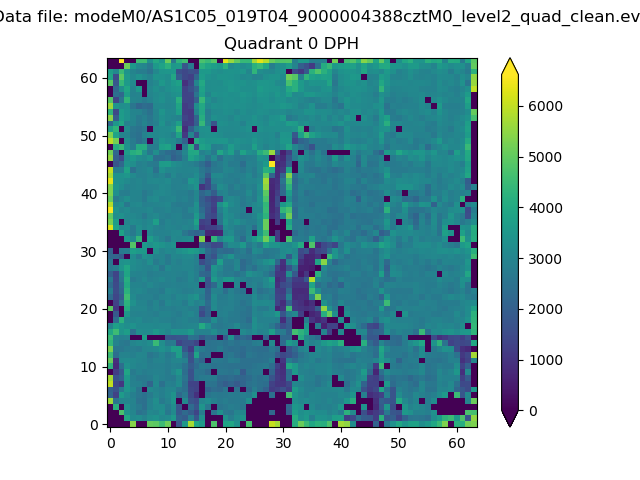 |
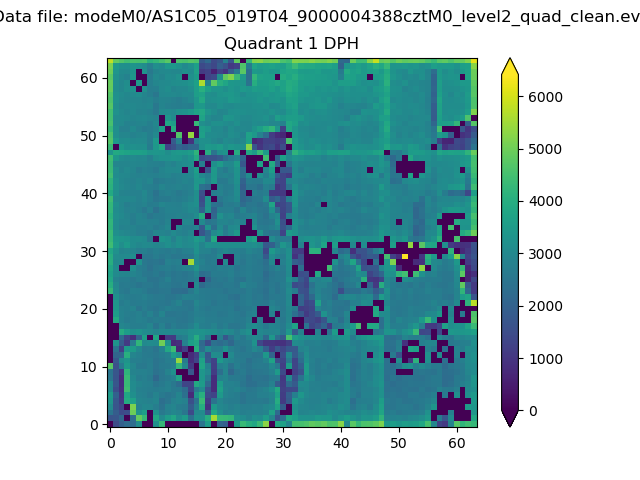 |
Quadrant B |
|---|---|---|---|
| Quadrant D | 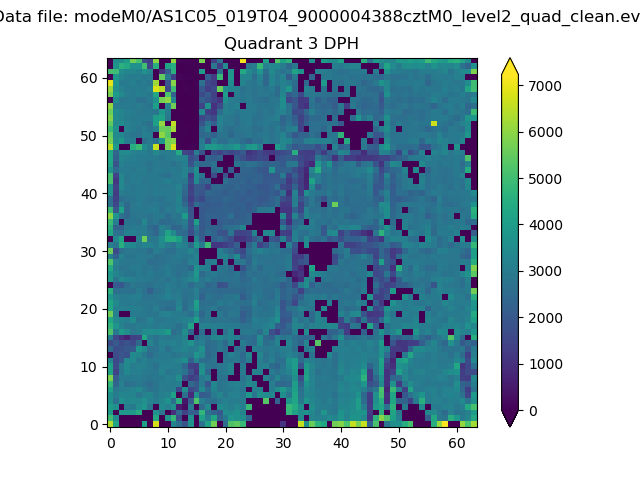 |
 |
Quadrant C |
| Plot type | Count rate plots | Images |
|---|---|---|
| Comparison with Poisson distribution Blue bars denote a histogram of data divided into 1 sec bins. Red curve is a Poisson curve with rate = median count rate of data. |
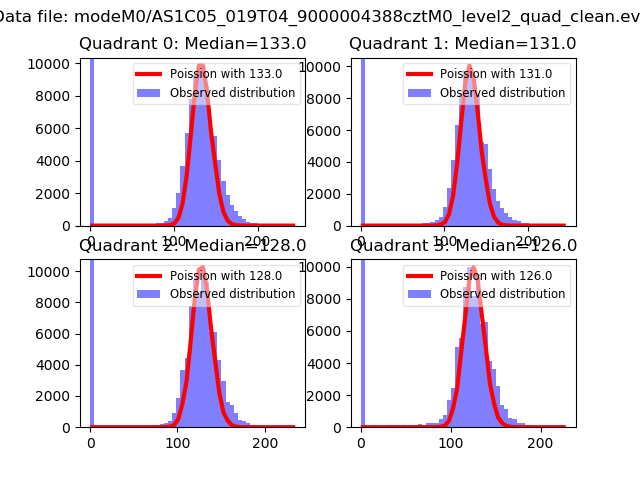 |
 |
| Quadrant-wise count rates Data is divided into 100 sec bins |
 |
|
| Module-wise count rates for Quadrant A Data is divided into 100 sec bins |
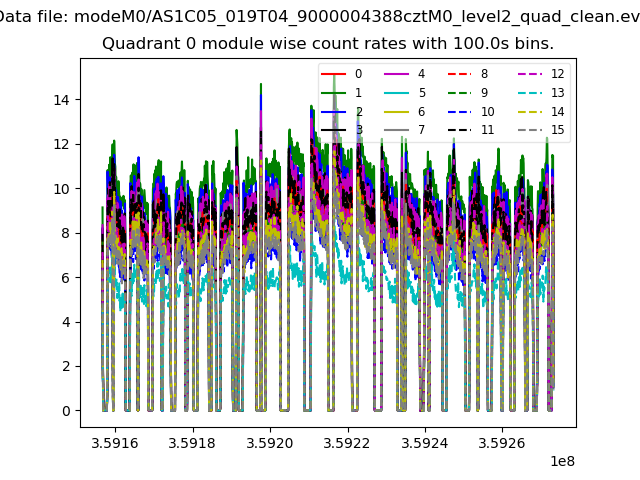 |
 |
| Module-wise count rates for Quadrant B Data is divided into 100 sec bins |
 |
 |
| Module-wise count rates for Quadrant C Data is divided into 100 sec bins |
 |
 |
| Module-wise count rates for Quadrant D Data is divided into 100 sec bins |
 |
 |
| Parameter | Plot |
|---|---|
| CZT HV Monitor |  |
| D_VDD |  |
| Temperature 1 |  |
| Veto HV Monitor |  |
| Veto LLD |  |
| Alpha Counter | 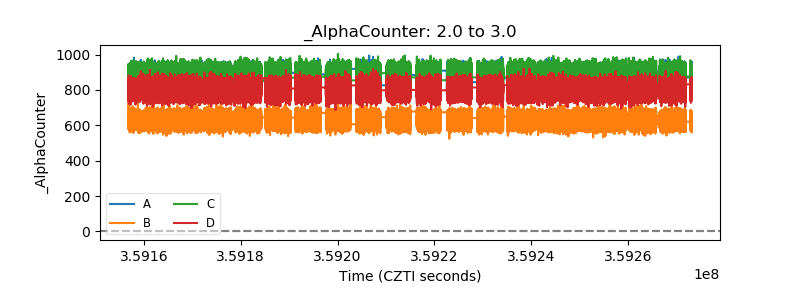 |
| _CPM_Rate |  |
| CZT Counter |  |
| +2.5 Volts monitor | 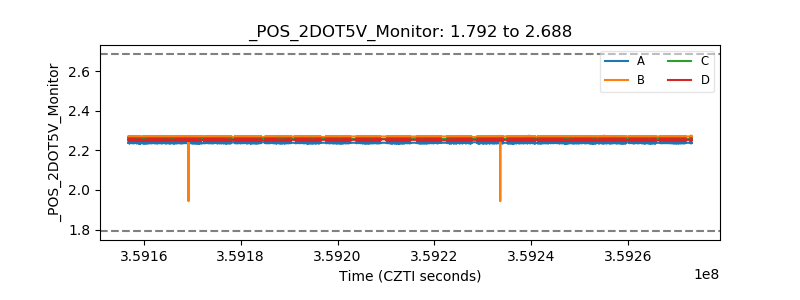 |
| +5 Volts monitor | 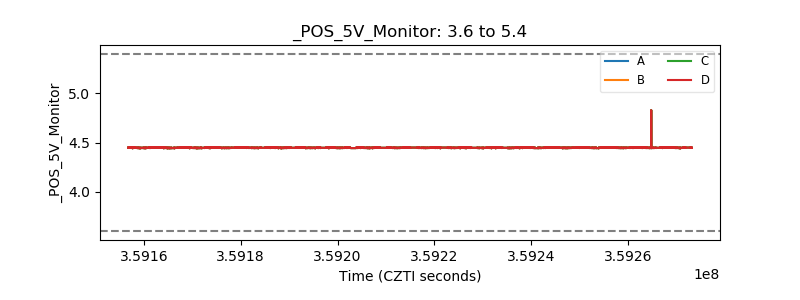 |
| _ROLL_ROT |  |
| _Roll_DEC |  |
| _Roll_RA |  |
| Veto Counter |  |