| Param | Original file | Final file |
|---|---|---|
| Filename | modeM0/AS1C05_019T04_9000004388_30504cztM0_level2.evt | modeM0/AS1C05_019T04_9000004388_30504cztM0_level2_quad_clean.evt |
| Size (bytes) | 649,480,320 | 128,206,080 |
| Size | 619.4 MB | 122.3 MB |
| Events in quadrant A | 3,696,210 | 859,143 |
| Events in quadrant B | 6,232,228 | 851,772 |
| Events in quadrant C | 4,245,572 | 826,061 |
| Events in quadrant D | 4,968,324 | 804,058 |
| Mode M0 | |||
|---|---|---|---|
| Quadrant | BADHDUFLAG | Total packets | Discarded packets |
| A | 0 | 16404 | 2 |
| B | 0 | 24367 | 2 |
| C | 0 | 17740 | 2 |
| D | 0 | 20145 | 2 |
| Mode M9 | |||
|---|---|---|---|
| Quadrant | BADHDUFLAG | Total packets | Discarded packets |
| A | 0 | 6 | 0 |
| B | 0 | 6 | 0 |
| C | 0 | 6 | 0 |
| D | 0 | 6 | 0 |
| Mode SS | |||
|---|---|---|---|
| Quadrant | BADHDUFLAG | Total packets | Discarded packets |
| A | 0 | 158 | 0 |
| B | 0 | 158 | 0 |
| C | 0 | 158 | 0 |
| D | 0 | 158 | 0 |
| Quadrant | Total seconds | Saturated seconds | Saturation percentage |
|---|---|---|---|
| A | 7798 | 80 | 1.025904% |
| B | 7799 | 260 | 3.333761% |
| C | 7799 | 261 | 3.346583% |
| D | 7799 | 251 | 3.218361% |
Noise dominated data is calculated using 1-second bins in cleaned event files. If a bin has >2000 counts, and if more than 50% of those come from <1% of pixels, then it is considered to be noise-dominated and hence unusable.
| Quadrant | # 1 sec bins | Bins with >0 counts | Bins with >2000 counts | High rate bins dominated by noise | Noise dominated (total time) | Noise dominated (detector-on time) | Marked lightcurve |
|---|---|---|---|---|---|---|---|
| A | 8303 | 7800 | 5 | 5 | 0.06% | 0.06% | 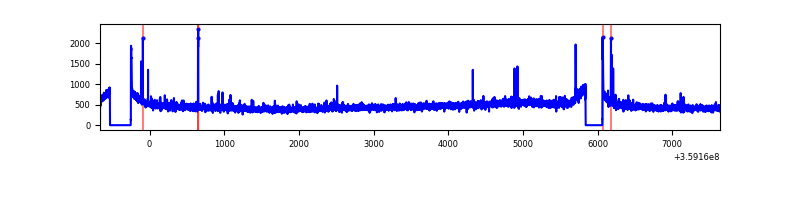 |
| B | 8304 | 7801 | 23 | 23 | 0.28% | 0.29% | 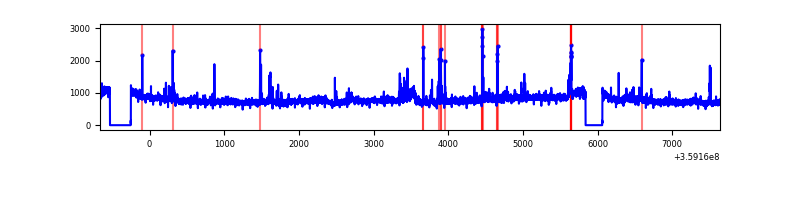 |
| C | 8304 | 7801 | 59 | 59 | 0.71% | 0.76% | 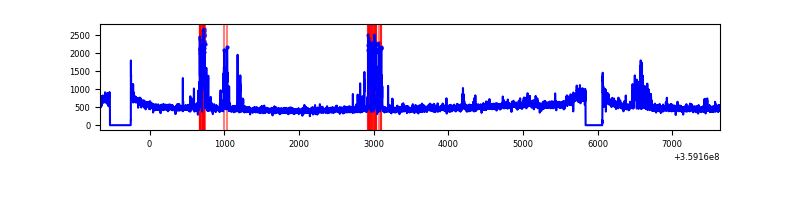 |
| D | 8304 | 7801 | 158 | 158 | 1.90% | 2.03% | 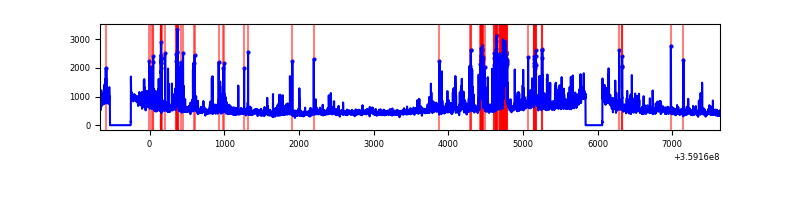 |
Top three noisy pixels from each quadrant. If the there are fewer than three noisy pixels in the level2.evt file, extra rows are filled as -1
| Pixel properties | Quadrant properties | ||||||
|---|---|---|---|---|---|---|---|
| Quadrant | DetID | PixID | Counts | Sigma | Mean | Median | Sigma |
| A | 12 | 96 | 41269 | 213.66 | 935 | 917 | 188.9 |
| A | 8 | 192 | 27561 | 141.08 | 935 | 917 | 188.9 |
| A | 13 | 254 | 14689 | 72.92 | 935 | 917 | 188.9 |
| B | 6 | 159 | 2292938 | 12828.29 | 927 | 901 | 178.7 |
| B | 0 | 229 | 179310 | 998.54 | 927 | 901 | 178.7 |
| B | 5 | 172 | 51967 | 285.81 | 927 | 901 | 178.7 |
| C | 10 | 22 | 373192 | 1767.43 | 899 | 901 | 210.6 |
| C | 3 | 233 | 176996 | 836.0 | 899 | 901 | 210.6 |
| C | 14 | 238 | 151002 | 712.59 | 899 | 901 | 210.6 |
| D | 8 | 195 | 638676 | 3004.66 | 898 | 873 | 212.3 |
| D | 2 | 250 | 560691 | 2637.28 | 898 | 873 | 212.3 |
| D | 10 | 253 | 69865 | 325.02 | 898 | 873 | 212.3 |
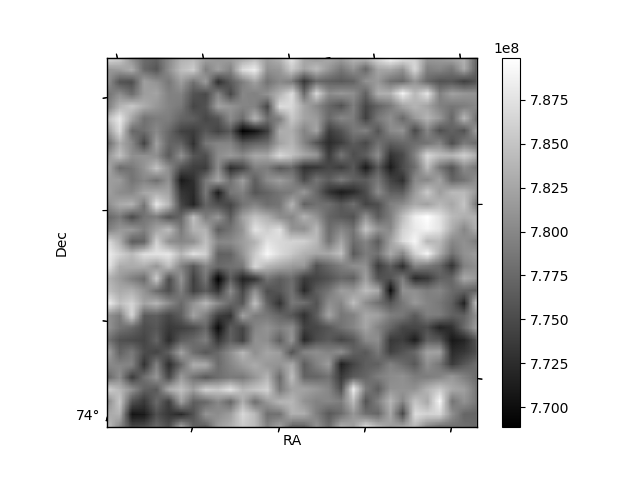
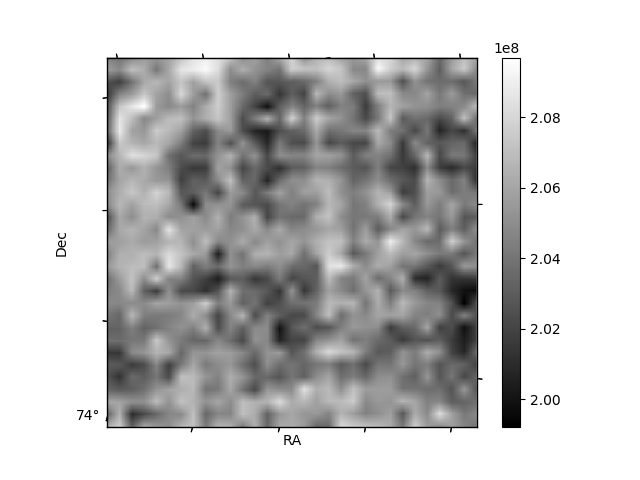
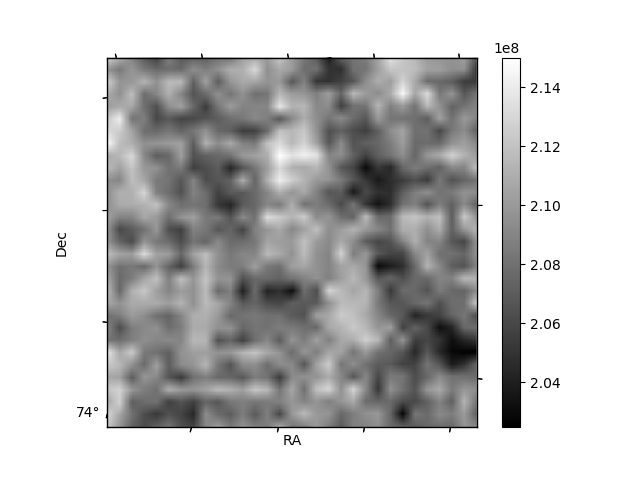
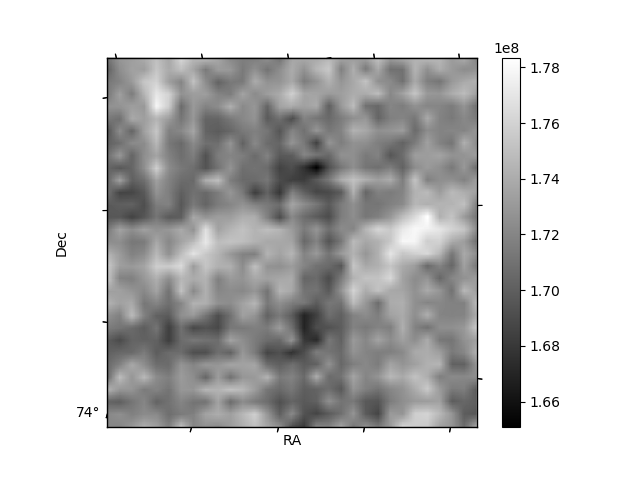
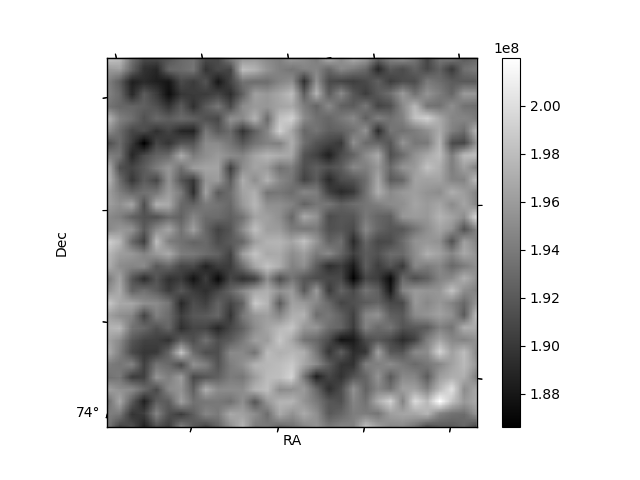
Histogram calculated using DETX and DETY for each event in the final _common_clean file
| Quadrant A | 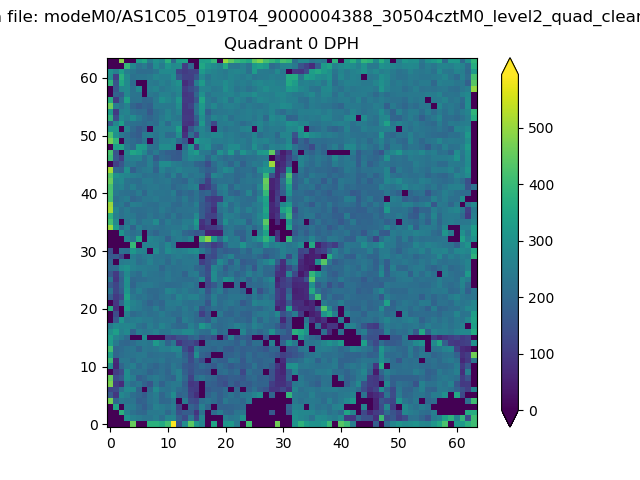 |
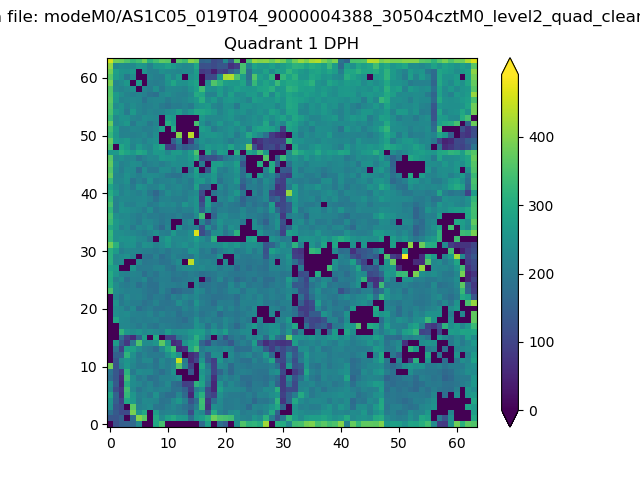 |
Quadrant B |
|---|---|---|---|
| Quadrant D | 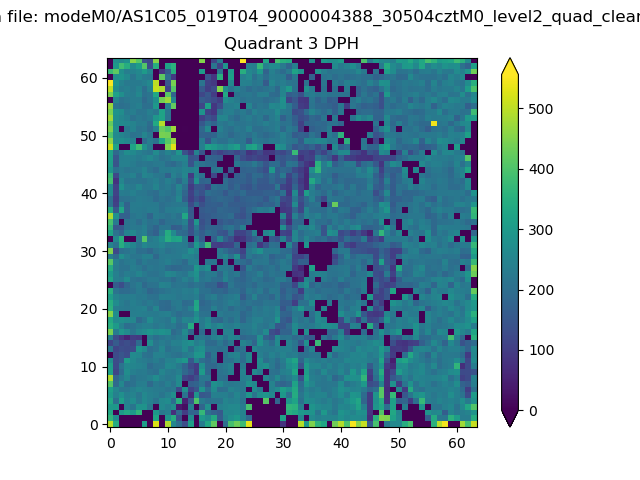 |
 |
Quadrant C |
| Plot type | Count rate plots | Images |
|---|---|---|
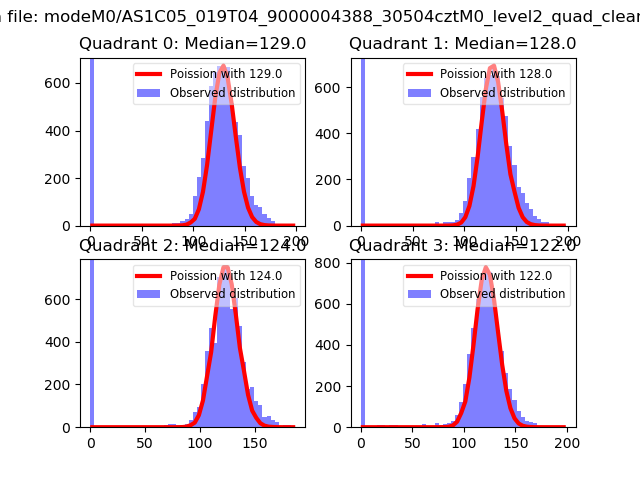
| Comparison with Poisson distribution Blue bars denote a histogram of data divided into 1 sec bins. Red curve is a Poisson curve with rate = median count rate of data. |
 |
 |
| Quadrant-wise count rates Data is divided into 100 sec bins |
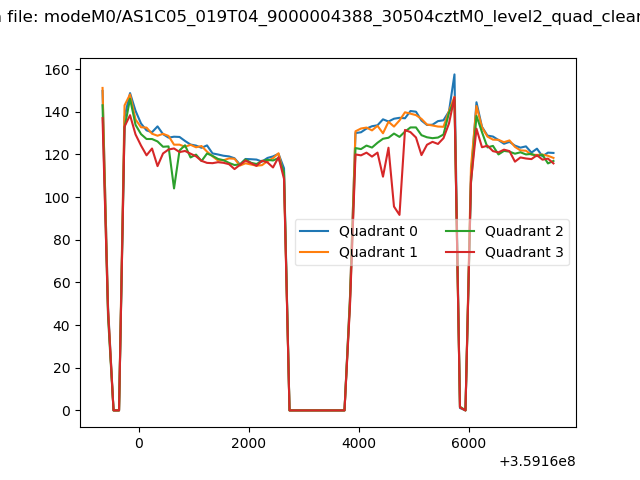 |
|
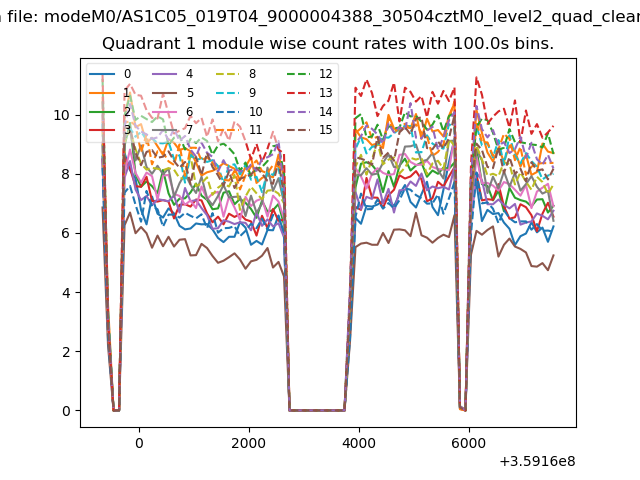
| Module-wise count rates for Quadrant A Data is divided into 100 sec bins |
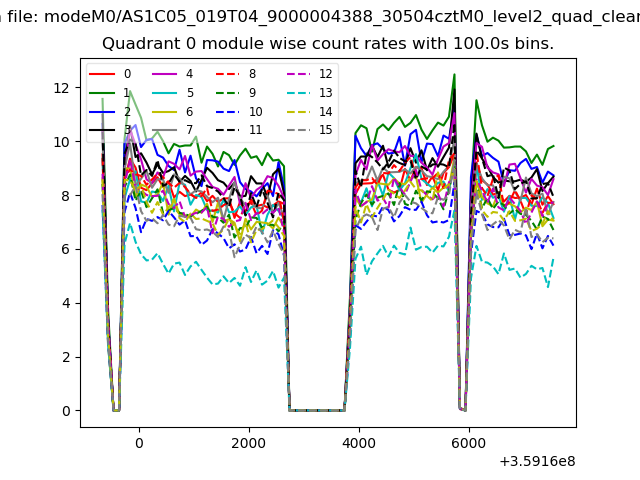 |
 |
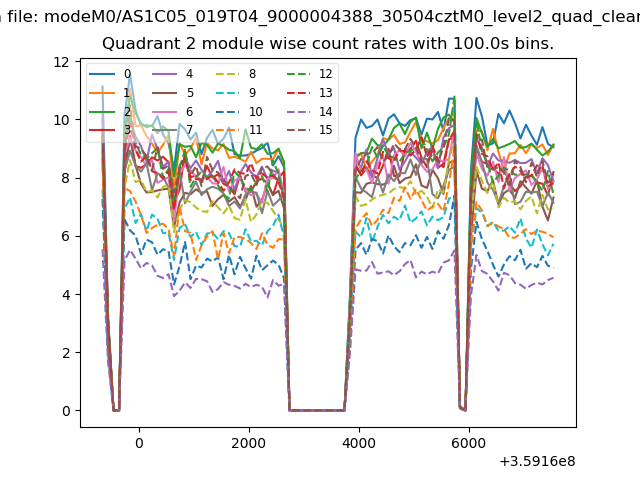
| Module-wise count rates for Quadrant B Data is divided into 100 sec bins |
 |
 |
| Module-wise count rates for Quadrant C Data is divided into 100 sec bins |
 |
 |
| Module-wise count rates for Quadrant D Data is divided into 100 sec bins |
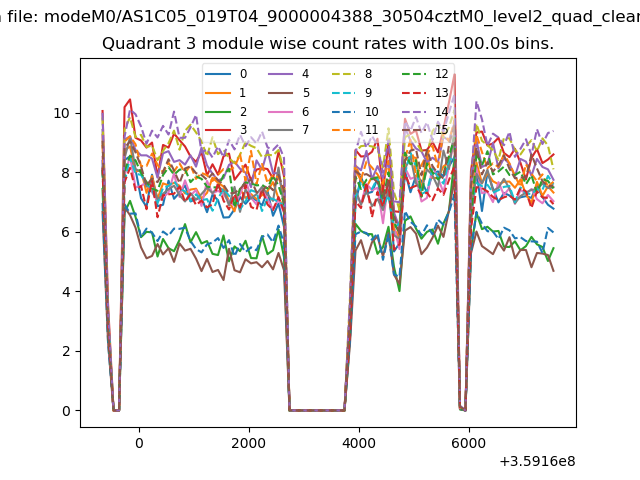 |
 |
| Parameter | Plot |
|---|---|
| CZT HV Monitor | 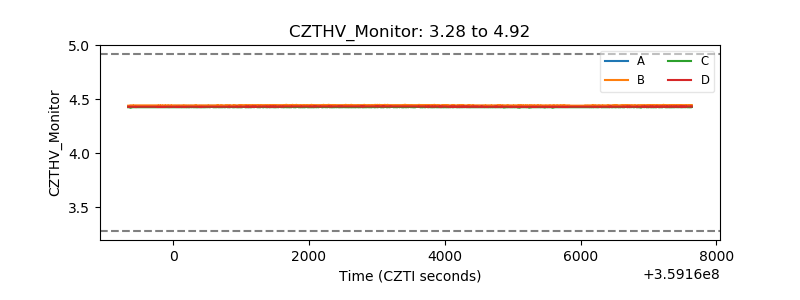 |
| D_VDD | 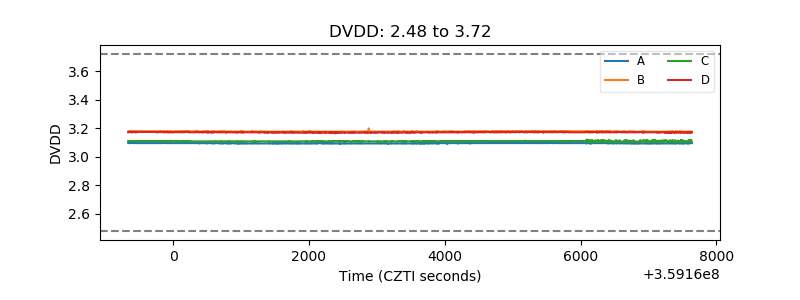 |
| Temperature 1 | 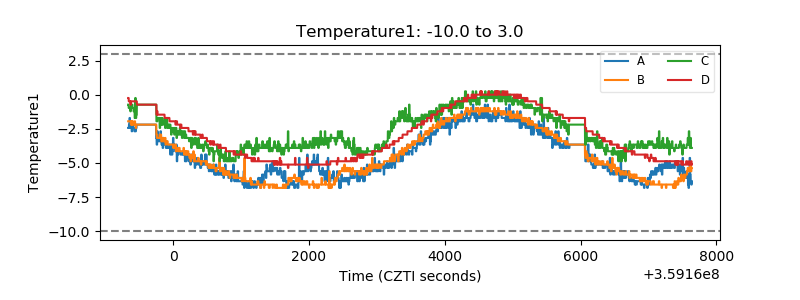 |
| Veto HV Monitor | 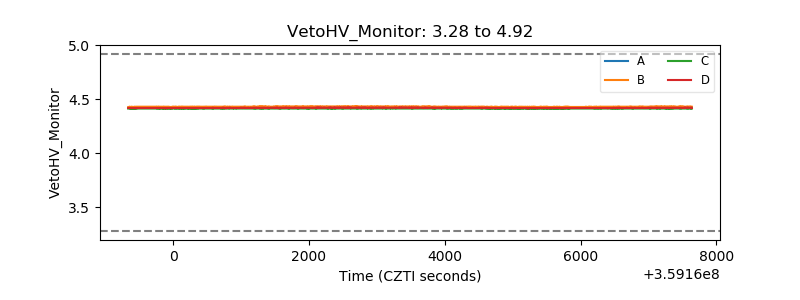 |
| Veto LLD | 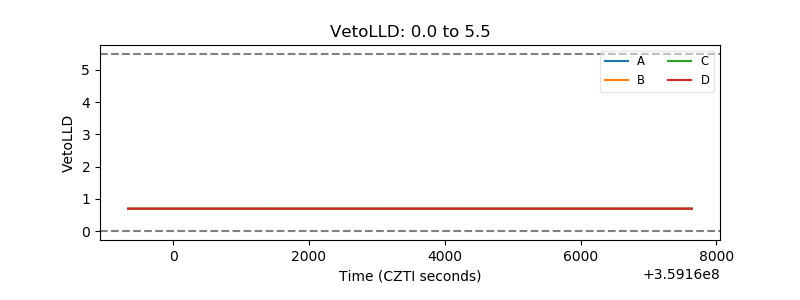 |
| Alpha Counter | 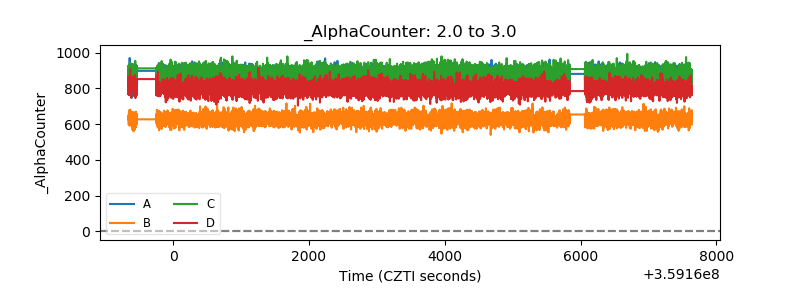 |
| _CPM_Rate | 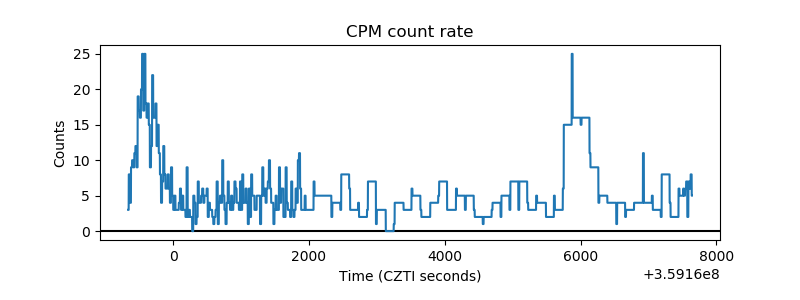 |
| CZT Counter | 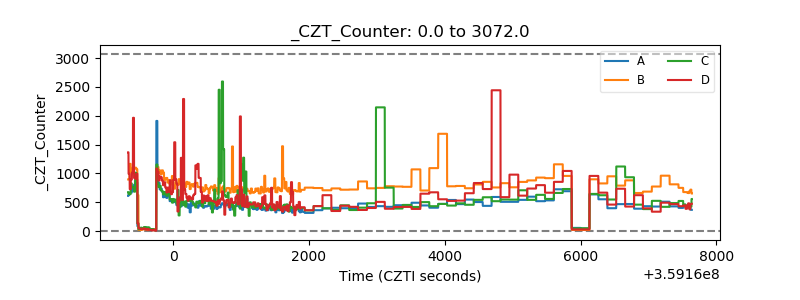 |
| +2.5 Volts monitor |  |
| +5 Volts monitor | 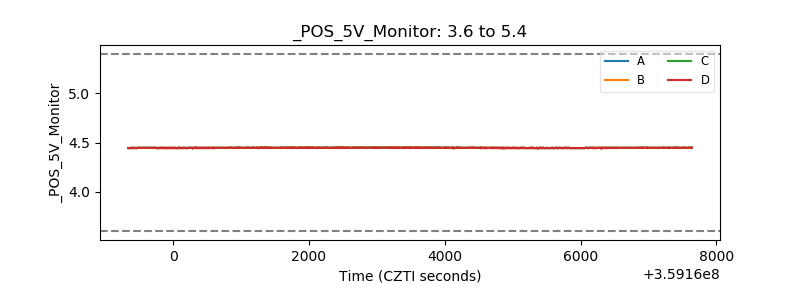 |
| _ROLL_ROT | 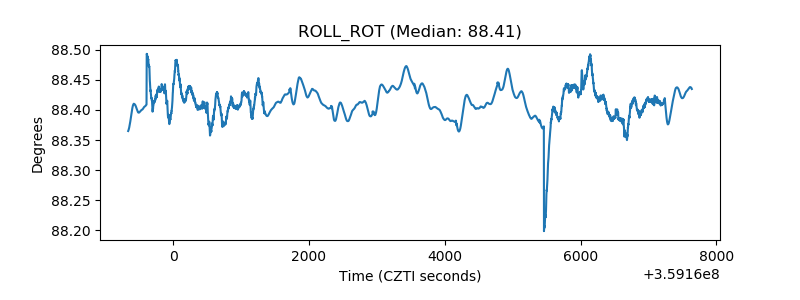 |
| _Roll_DEC |  |
| _Roll_RA | 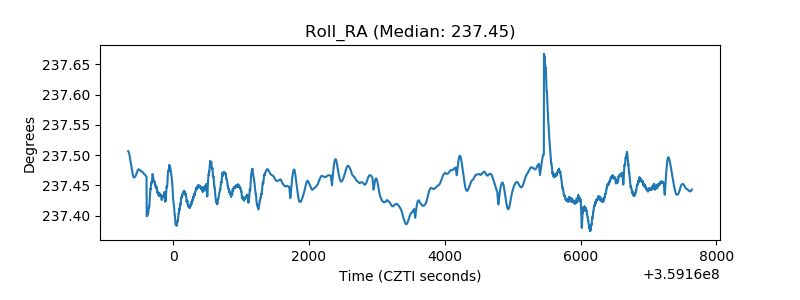 |
| Veto Counter | 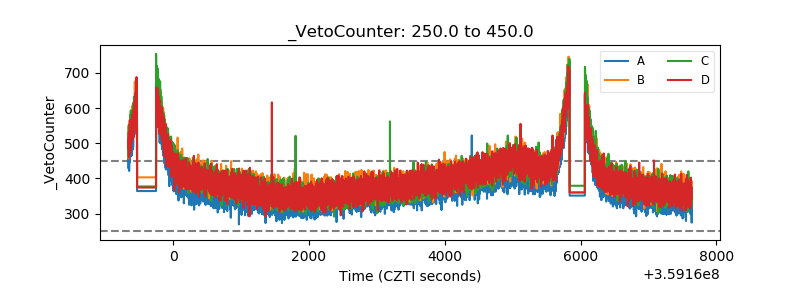 |