| Param | Original file | Final file |
|---|---|---|
| Filename | modeM0/AS1C05_019T04_9000004388_30507cztM0_level2.evt | modeM0/AS1C05_019T04_9000004388_30507cztM0_level2_quad_clean.evt |
| Size (bytes) | 1,580,258,880 | 290,036,160 |
| Size | 1.5 GB | 276.6 MB |
| Events in quadrant A | 8,881,557 | 1,922,945 |
| Events in quadrant B | 14,985,078 | 1,902,637 |
| Events in quadrant C | 9,551,752 | 1,856,644 |
| Events in quadrant D | 13,166,299 | 1,800,446 |
| Mode M0 | |||
|---|---|---|---|
| Quadrant | BADHDUFLAG | Total packets | Discarded packets |
| A | 0 | 39030 | 4 |
| B | 0 | 58748 | 4 |
| C | 0 | 40673 | 4 |
| D | 0 | 52214 | 4 |
| Mode M9 | |||
|---|---|---|---|
| Quadrant | BADHDUFLAG | Total packets | Discarded packets |
| A | 0 | 20 | 0 |
| B | 0 | 20 | 0 |
| C | 0 | 20 | 0 |
| D | 0 | 20 | 0 |
| Mode SS | |||
|---|---|---|---|
| Quadrant | BADHDUFLAG | Total packets | Discarded packets |
| A | 0 | 386 | 0 |
| B | 0 | 386 | 0 |
| C | 0 | 386 | 0 |
| D | 0 | 386 | 0 |
| Quadrant | Total seconds | Saturated seconds | Saturation percentage |
|---|---|---|---|
| A | 18895 | 194 | 1.026727% |
| B | 18896 | 536 | 2.836579% |
| C | 18895 | 332 | 1.757079% |
| D | 18895 | 1091 | 5.774014% |
Noise dominated data is calculated using 1-second bins in cleaned event files. If a bin has >2000 counts, and if more than 50% of those come from <1% of pixels, then it is considered to be noise-dominated and hence unusable.
| Quadrant | # 1 sec bins | Bins with >0 counts | Bins with >2000 counts | High rate bins dominated by noise | Noise dominated (total time) | Noise dominated (detector-on time) | Marked lightcurve |
|---|---|---|---|---|---|---|---|
| A | 20910 | 18899 | 9 | 9 | 0.04% | 0.05% | 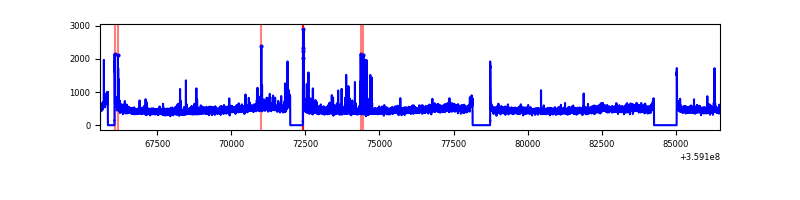 |
| B | 20911 | 18900 | 110 | 110 | 0.53% | 0.58% | 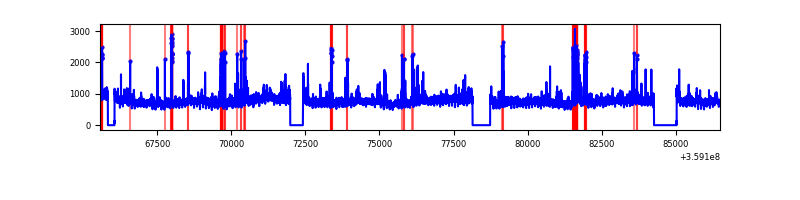 |
| C | 20910 | 18899 | 1 | 1 | 0.00% | 0.01% | 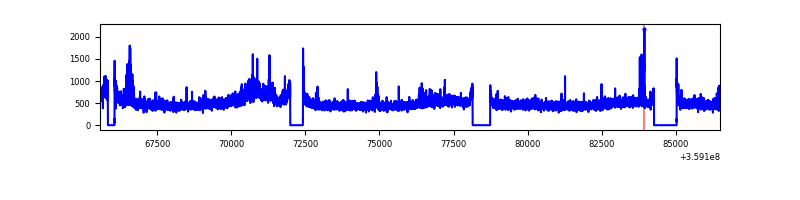 |
| D | 20910 | 18899 | 886 | 886 | 4.24% | 4.69% | 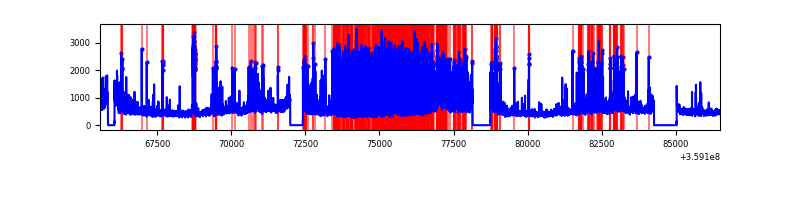 |
Top three noisy pixels from each quadrant. If the there are fewer than three noisy pixels in the level2.evt file, extra rows are filled as -1
| Pixel properties | Quadrant properties | ||||||
|---|---|---|---|---|---|---|---|
| Quadrant | DetID | PixID | Counts | Sigma | Mean | Median | Sigma |
| A | 12 | 96 | 170925 | 378.27 | 2233 | 2185 | 446.1 |
| A | 8 | 192 | 58215 | 125.61 | 2233 | 2185 | 446.1 |
| A | 13 | 254 | 33976 | 71.27 | 2233 | 2185 | 446.1 |
| B | 6 | 159 | 5349798 | 12881.42 | 2204 | 2145 | 415.1 |
| B | 0 | 229 | 740225 | 1777.89 | 2204 | 2145 | 415.1 |
| B | 5 | 172 | 99567 | 234.67 | 2204 | 2145 | 415.1 |
| C | 3 | 233 | 650186 | 1304.25 | 2145 | 2155 | 496.9 |
| C | 14 | 238 | 361667 | 723.57 | 2145 | 2155 | 496.9 |
| C | 10 | 22 | 88415 | 173.61 | 2145 | 2155 | 496.9 |
| D | 8 | 195 | 1995217 | 3988.72 | 2121 | 2065 | 499.7 |
| D | 2 | 250 | 1216513 | 2430.36 | 2121 | 2065 | 499.7 |
| D | 12 | 218 | 901553 | 1800.06 | 2121 | 2065 | 499.7 |
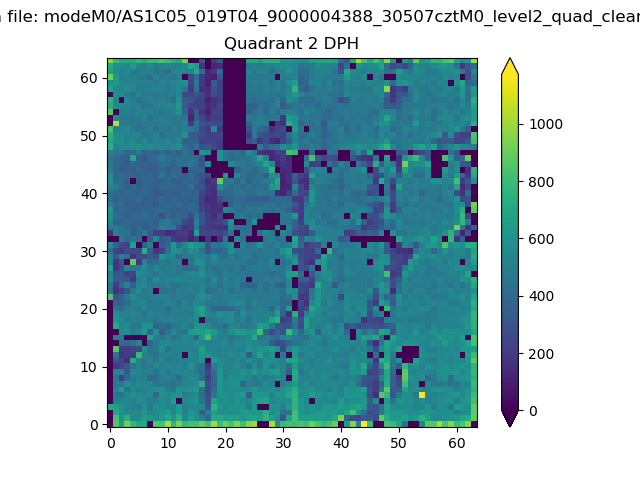
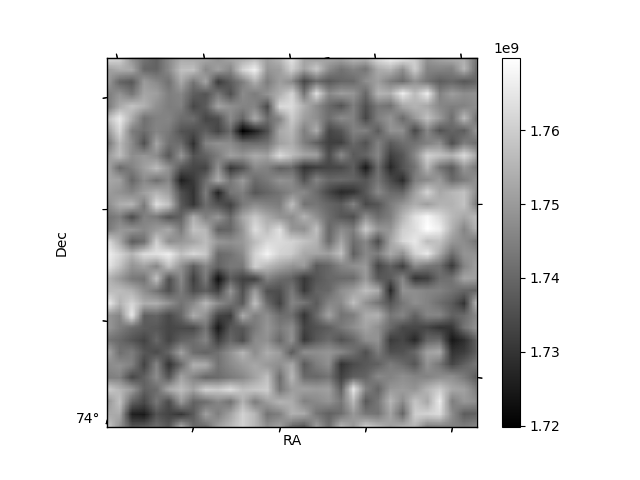
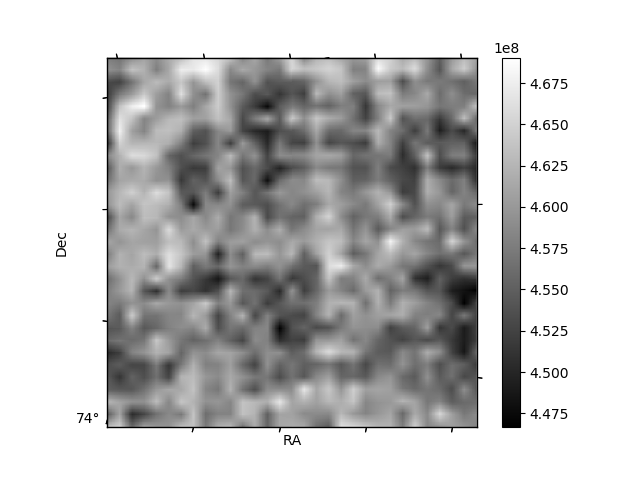
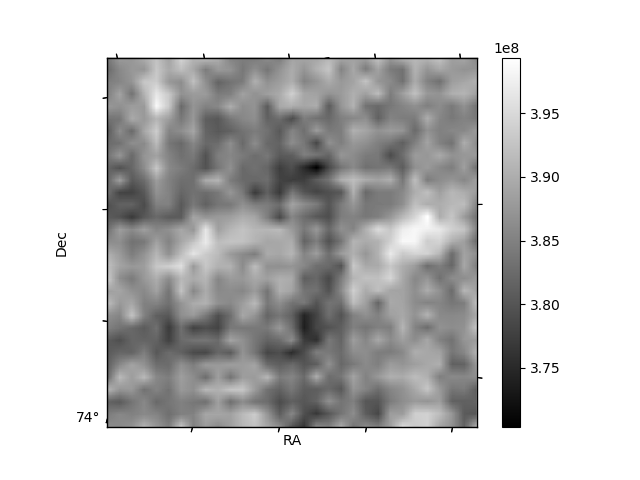
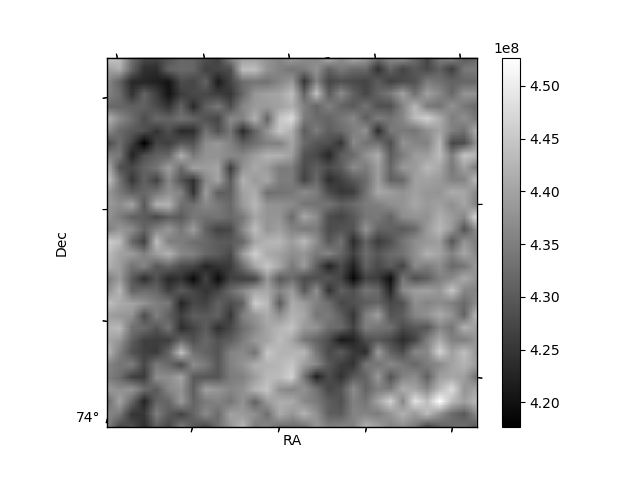
Histogram calculated using DETX and DETY for each event in the final _common_clean file
| Quadrant A | 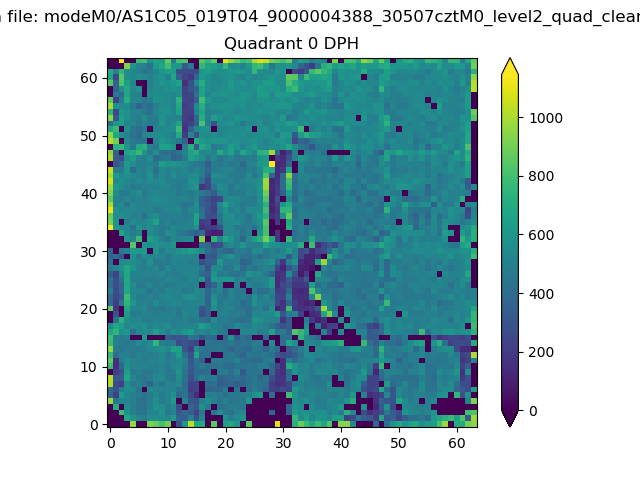 |
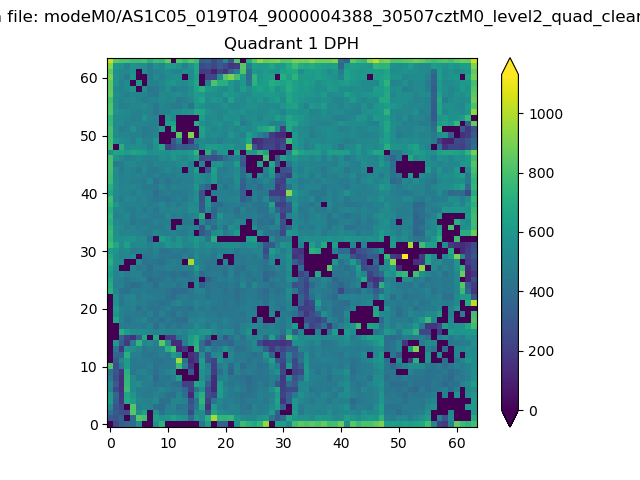 |
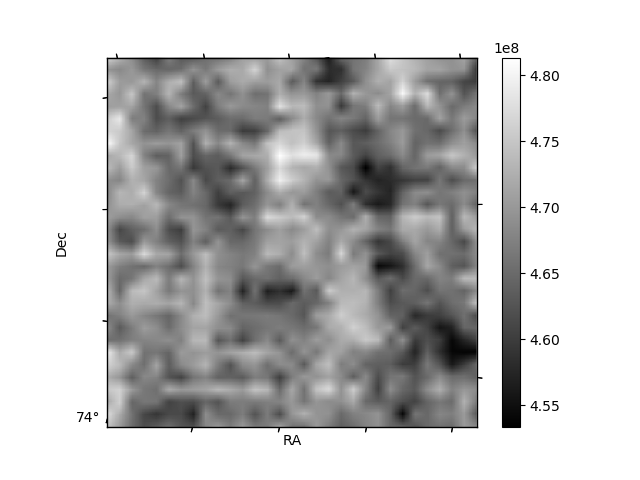
Quadrant B |
|---|---|---|---|
| Quadrant D | 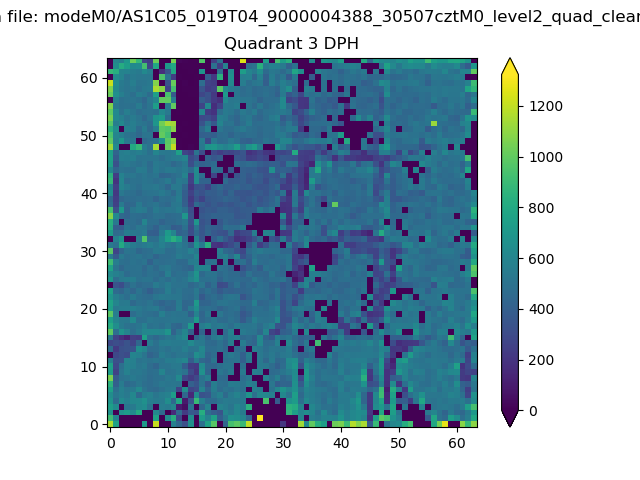 |
 |
Quadrant C |
| Plot type | Count rate plots | Images |
|---|---|---|
| Comparison with Poisson distribution Blue bars denote a histogram of data divided into 1 sec bins. Red curve is a Poisson curve with rate = median count rate of data. |
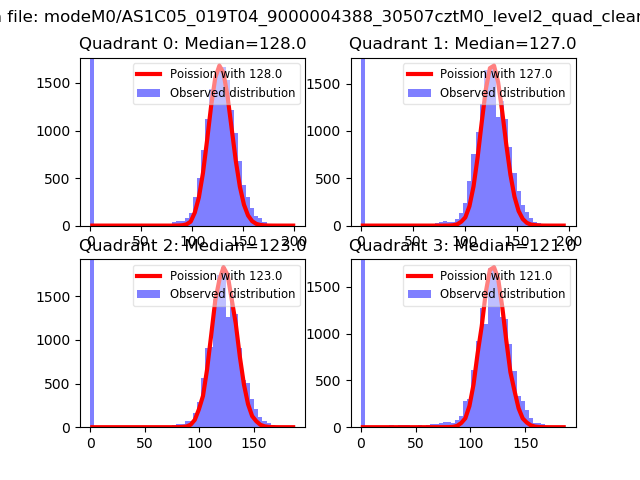 |
 |
| Quadrant-wise count rates Data is divided into 100 sec bins |
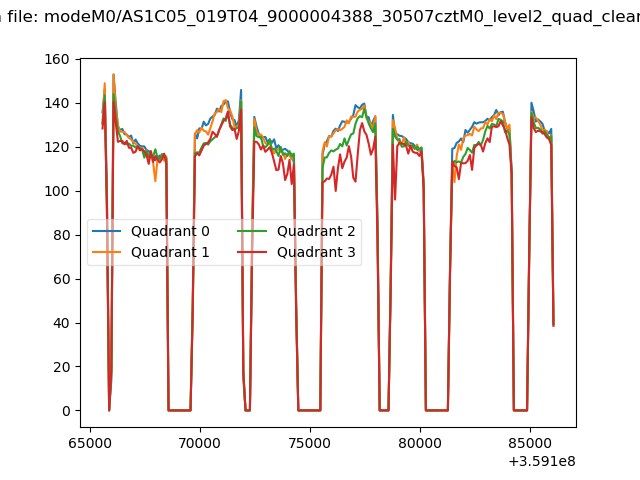 |
|
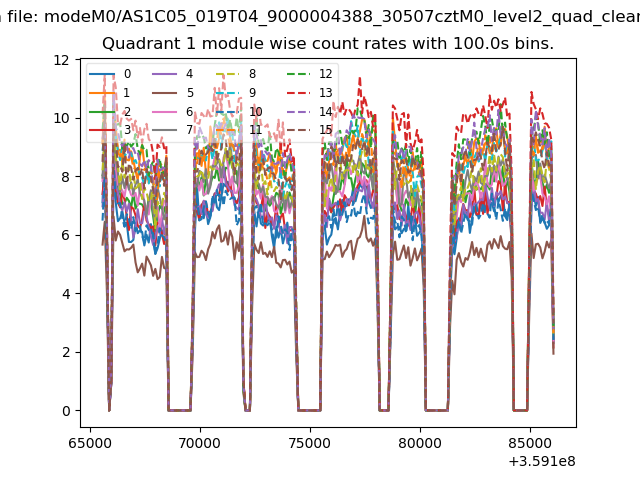
| Module-wise count rates for Quadrant A Data is divided into 100 sec bins |
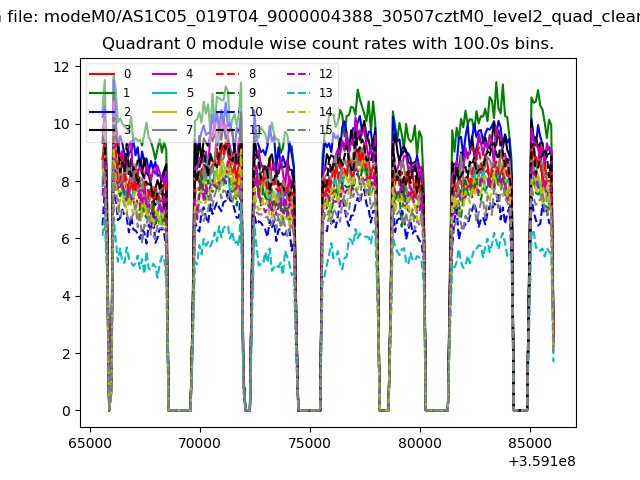 |
 |
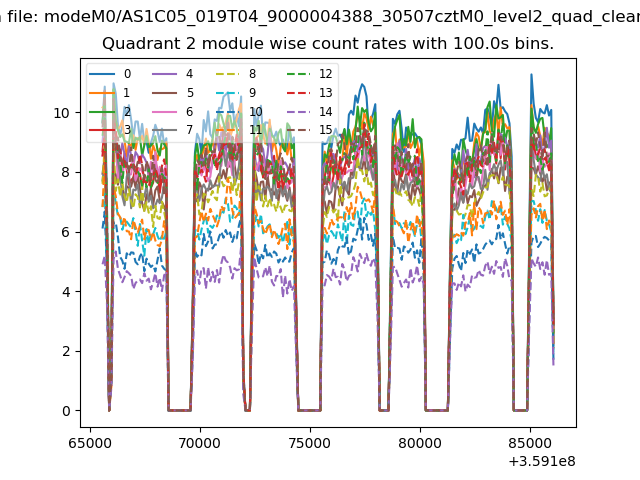
| Module-wise count rates for Quadrant B Data is divided into 100 sec bins |
 |
 |
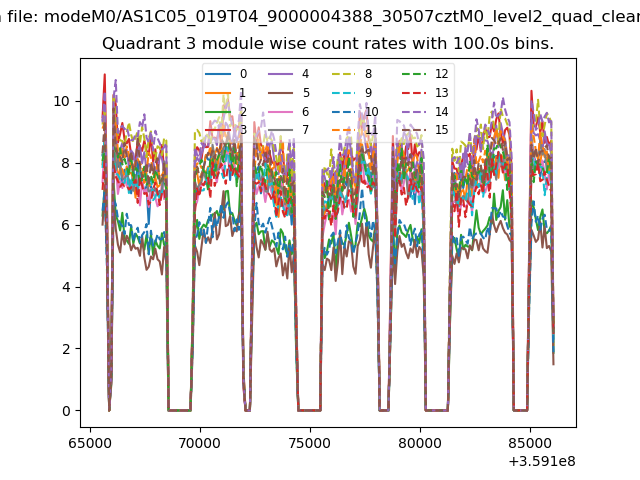
| Module-wise count rates for Quadrant C Data is divided into 100 sec bins |
 |
 |
| Module-wise count rates for Quadrant D Data is divided into 100 sec bins |
 |
 |
| Parameter | Plot |
|---|---|
| CZT HV Monitor | 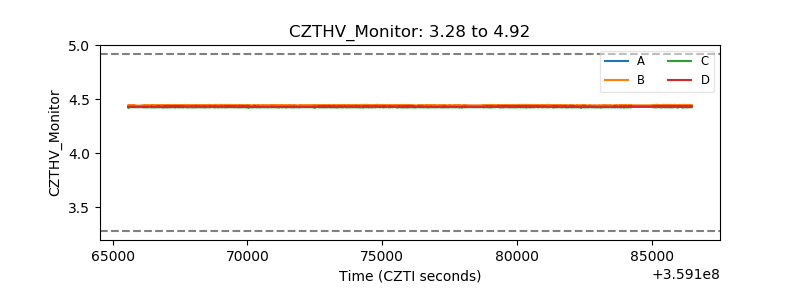 |
| D_VDD | 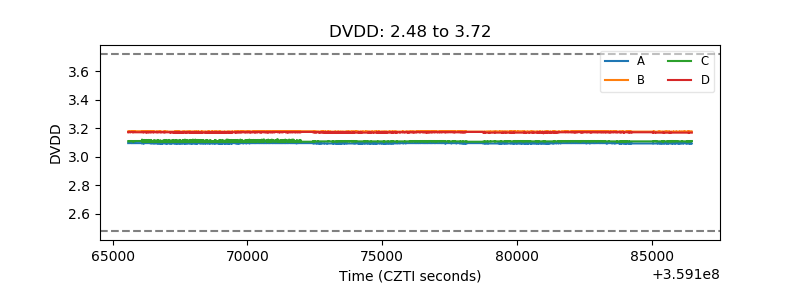 |
| Temperature 1 | 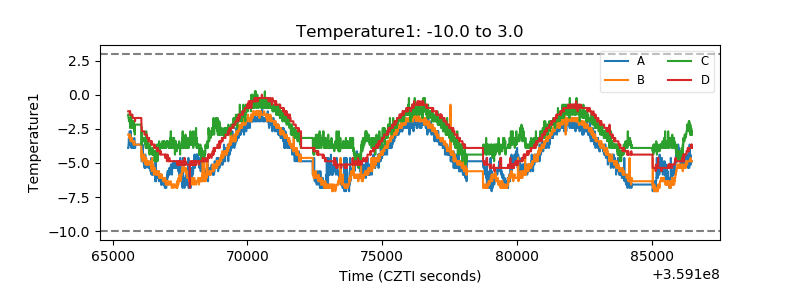 |
| Veto HV Monitor |  |
| Veto LLD | 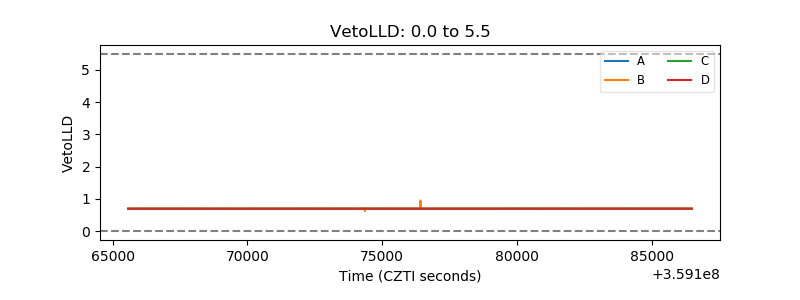 |
| Alpha Counter | 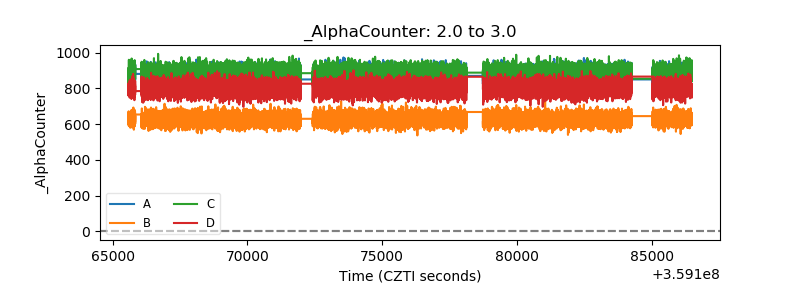 |
| _CPM_Rate | 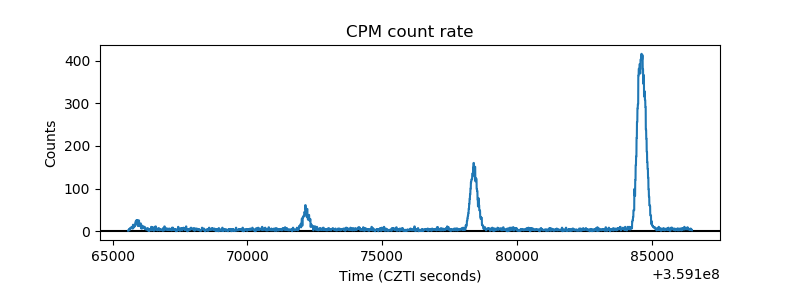 |
| CZT Counter | 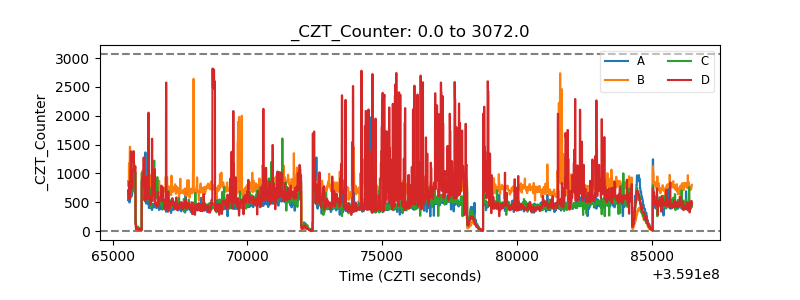 |
| +2.5 Volts monitor | 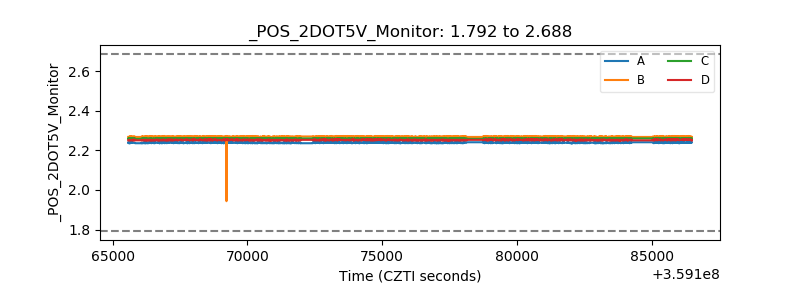 |
| +5 Volts monitor |  |
| _ROLL_ROT | 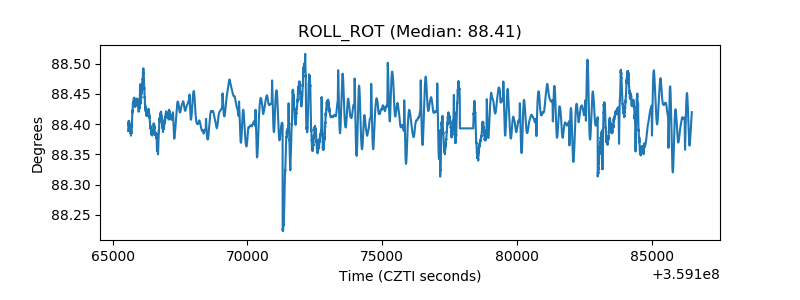 |
| _Roll_DEC | 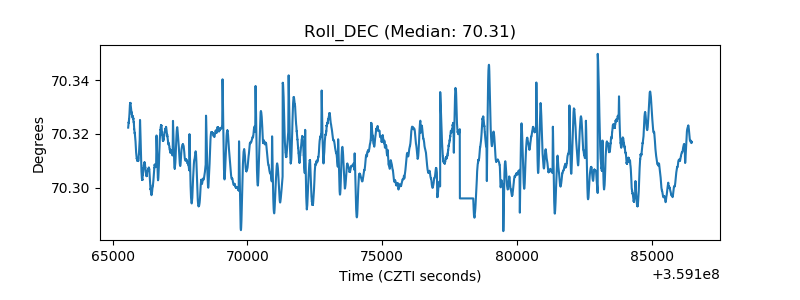 |
| _Roll_RA | 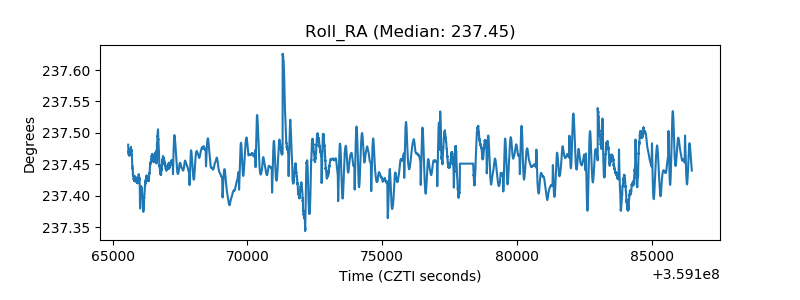 |
| Veto Counter | 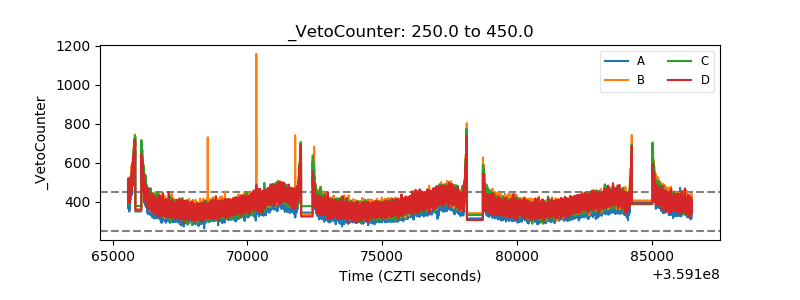 |