| Param | Original file | Final file |
|---|---|---|
| Filename | modeM0/AS1C05_019T04_9000004388_30508cztM0_level2.evt | modeM0/AS1C05_019T04_9000004388_30508cztM0_level2_quad_clean.evt |
| Size (bytes) | 492,134,400 | 87,114,240 |
| Size | 469.3 MB | 83.1 MB |
| Events in quadrant A | 2,964,307 | 566,189 |
| Events in quadrant B | 4,831,653 | 562,272 |
| Events in quadrant C | 2,988,586 | 541,529 |
| Events in quadrant D | 3,697,470 | 533,518 |
| Mode M0 | |||
|---|---|---|---|
| Quadrant | BADHDUFLAG | Total packets | Discarded packets |
| A | 0 | 12769 | 1 |
| B | 0 | 18981 | 1 |
| C | 0 | 12765 | 1 |
| D | 0 | 14830 | 1 |
| Mode M9 | |||
|---|---|---|---|
| Quadrant | BADHDUFLAG | Total packets | Discarded packets |
| A | 0 | 9 | 0 |
| B | 0 | 9 | 0 |
| C | 0 | 9 | 0 |
| D | 0 | 9 | 0 |
| Mode SS | |||
|---|---|---|---|
| Quadrant | BADHDUFLAG | Total packets | Discarded packets |
| A | 0 | 126 | 0 |
| B | 0 | 126 | 0 |
| C | 0 | 126 | 0 |
| D | 0 | 126 | 0 |
| Quadrant | Total seconds | Saturated seconds | Saturation percentage |
|---|---|---|---|
| A | 6227 | 65 | 1.043841% |
| B | 6228 | 121 | 1.942839% |
| C | 6228 | 98 | 1.573539% |
| D | 6228 | 135 | 2.167630% |
Noise dominated data is calculated using 1-second bins in cleaned event files. If a bin has >2000 counts, and if more than 50% of those come from <1% of pixels, then it is considered to be noise-dominated and hence unusable.
| Quadrant | # 1 sec bins | Bins with >0 counts | Bins with >2000 counts | High rate bins dominated by noise | Noise dominated (total time) | Noise dominated (detector-on time) | Marked lightcurve |
|---|---|---|---|---|---|---|---|
| A | 7137 | 6228 | 2 | 2 | 0.03% | 0.03% | 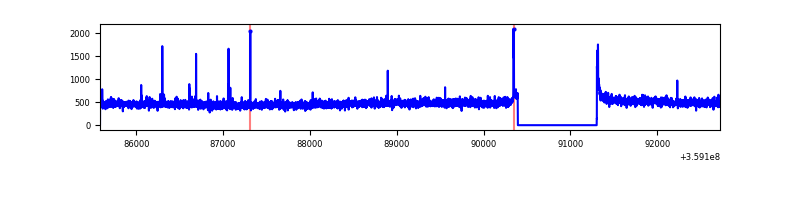 |
| B | 7138 | 6229 | 10 | 10 | 0.14% | 0.16% | 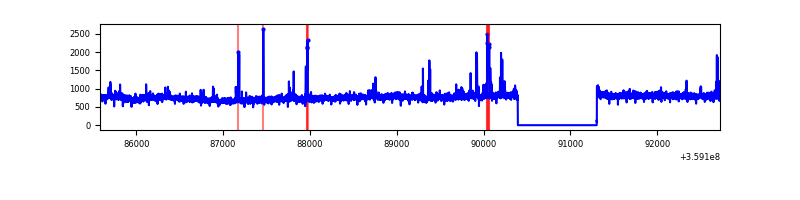 |
| C | 7138 | 6229 | 0 | 0 | 0.00% | 0.00% | 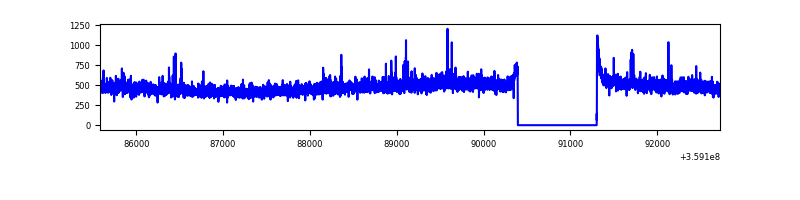 |
| D | 7138 | 6229 | 93 | 93 | 1.30% | 1.49% | 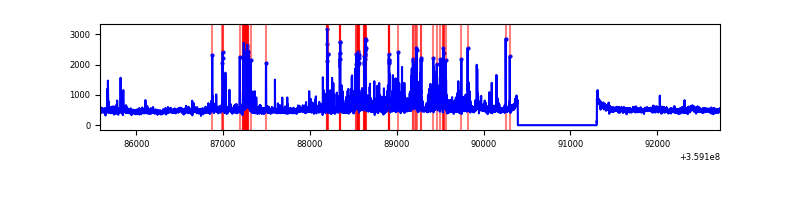 |
Top three noisy pixels from each quadrant. If the there are fewer than three noisy pixels in the level2.evt file, extra rows are filled as -1
| Pixel properties | Quadrant properties | ||||||
|---|---|---|---|---|---|---|---|
| Quadrant | DetID | PixID | Counts | Sigma | Mean | Median | Sigma |
| A | 12 | 96 | 33281 | 217.36 | 752 | 736 | 149.7 |
| A | 13 | 254 | 11402 | 71.24 | 752 | 736 | 149.7 |
| A | 8 | 192 | 9915 | 61.3 | 752 | 736 | 149.7 |
| B | 6 | 159 | 1741075 | 12403.46 | 738 | 720 | 140.3 |
| B | 0 | 229 | 120580 | 854.24 | 738 | 720 | 140.3 |
| B | 5 | 172 | 24017 | 166.04 | 738 | 720 | 140.3 |
| C | 14 | 238 | 127037 | 761.1 | 712 | 717 | 166.0 |
| C | 3 | 233 | 49115 | 291.61 | 712 | 717 | 166.0 |
| C | 14 | 254 | 14562 | 83.42 | 712 | 717 | 166.0 |
| D | 8 | 195 | 461151 | 2671.22 | 718 | 699 | 172.4 |
| D | 2 | 250 | 304469 | 1762.26 | 718 | 699 | 172.4 |
| D | 13 | 249 | 73620 | 423.03 | 718 | 699 | 172.4 |
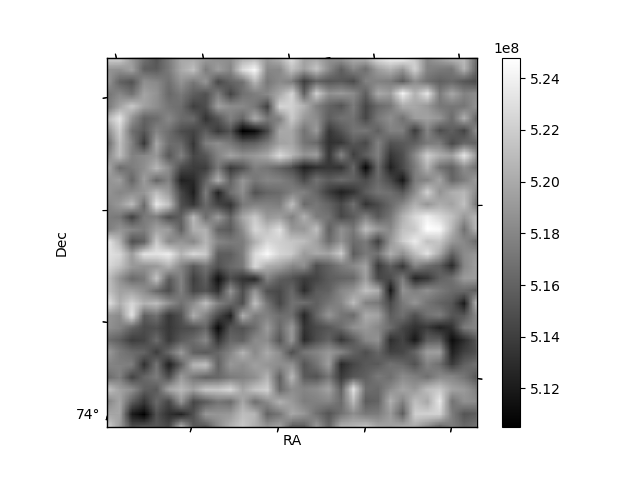
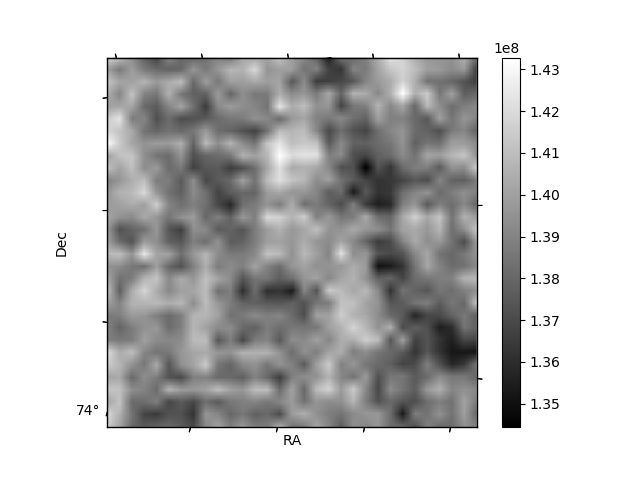
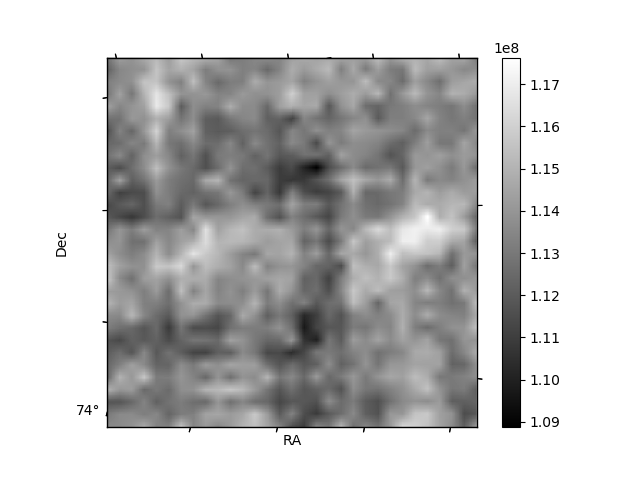
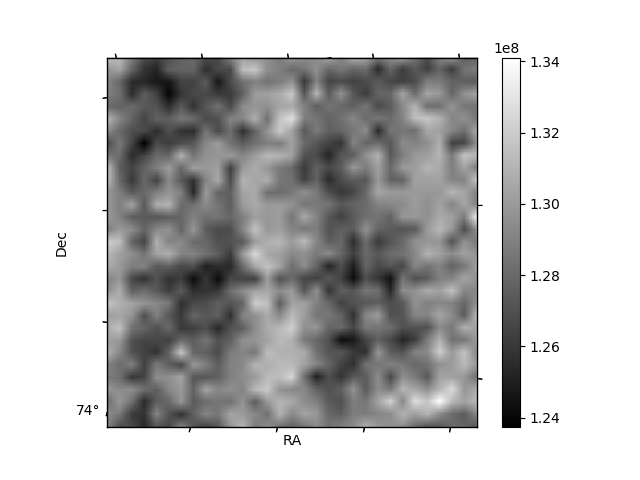
Histogram calculated using DETX and DETY for each event in the final _common_clean file
| Quadrant A | 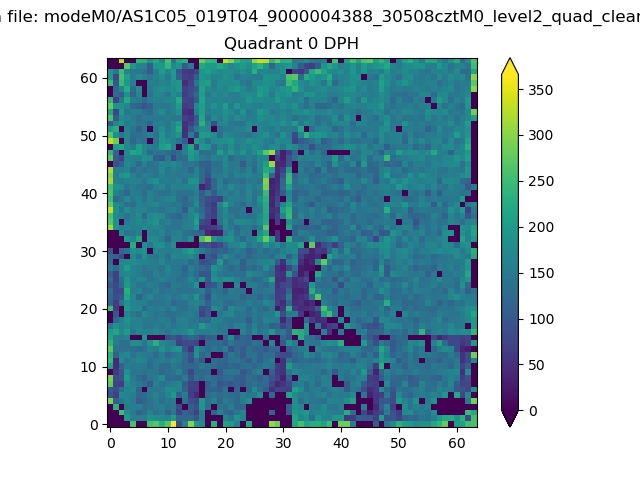 |
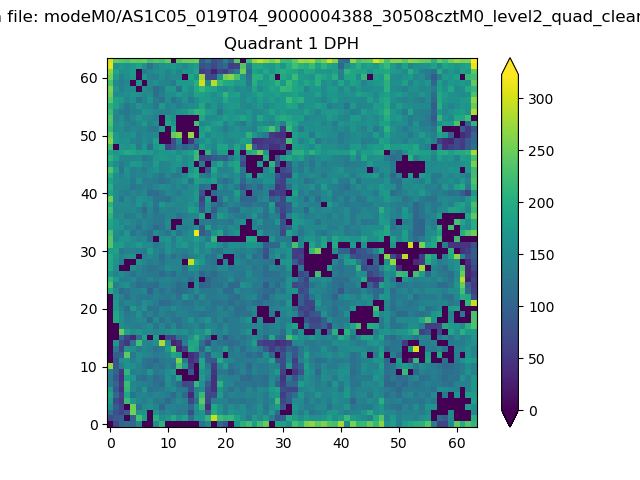 |
Quadrant B |
|---|---|---|---|
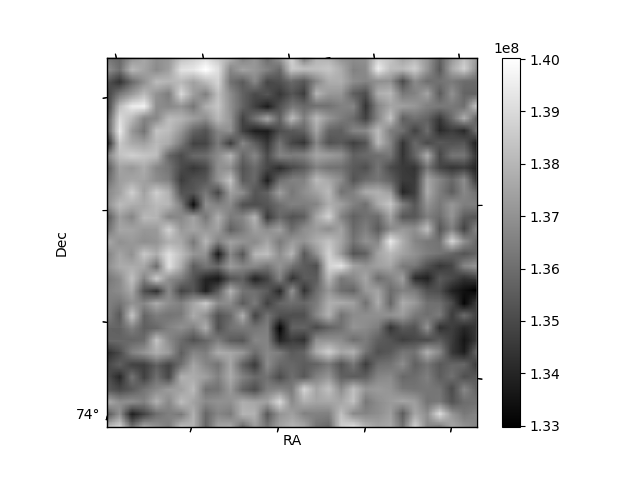
| Quadrant D | 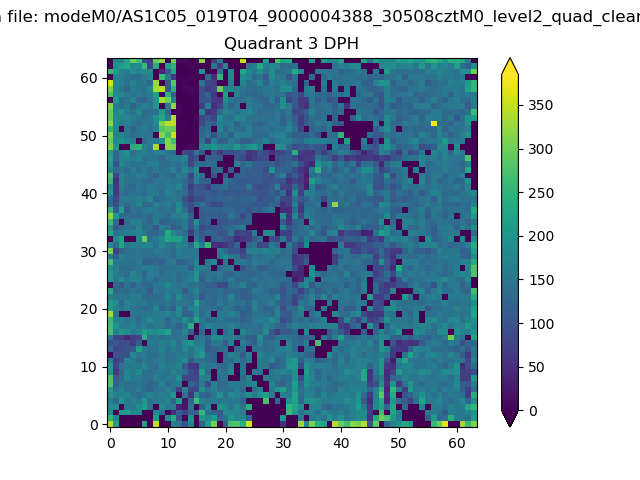 |
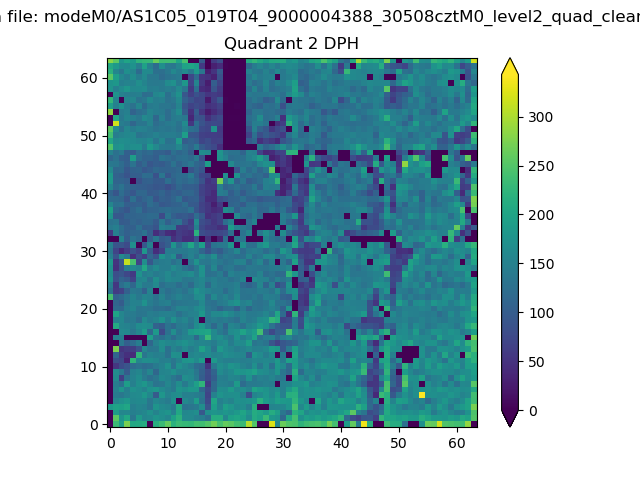 |
Quadrant C |
| Plot type | Count rate plots | Images |
|---|---|---|
| Comparison with Poisson distribution Blue bars denote a histogram of data divided into 1 sec bins. Red curve is a Poisson curve with rate = median count rate of data. |
 |
 |
| Quadrant-wise count rates Data is divided into 100 sec bins |
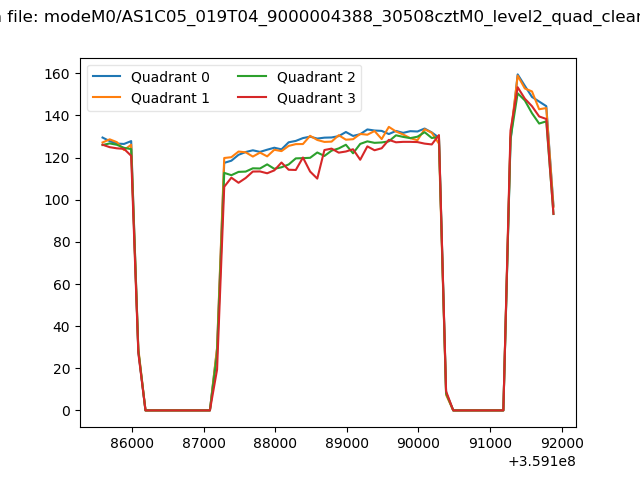 |
|
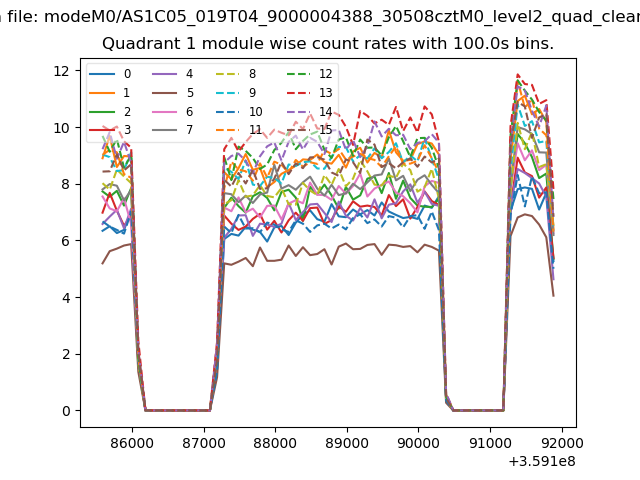
| Module-wise count rates for Quadrant A Data is divided into 100 sec bins |
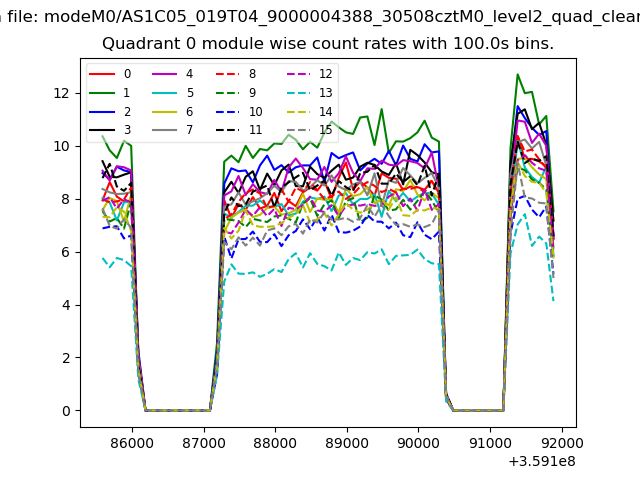 |
 |
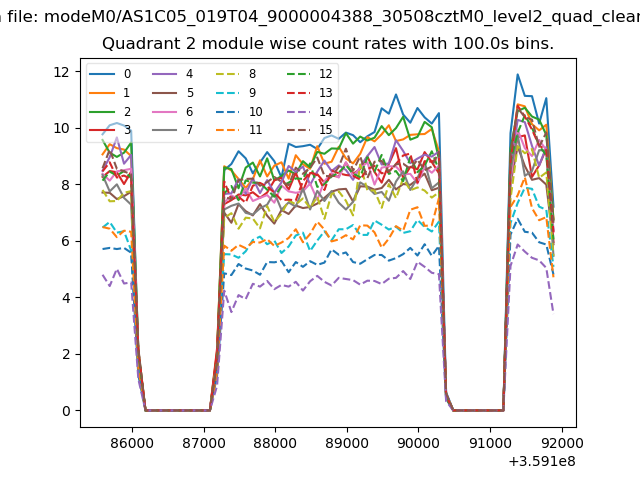
| Module-wise count rates for Quadrant B Data is divided into 100 sec bins |
 |
 |
| Module-wise count rates for Quadrant C Data is divided into 100 sec bins |
 |
 |
| Module-wise count rates for Quadrant D Data is divided into 100 sec bins |
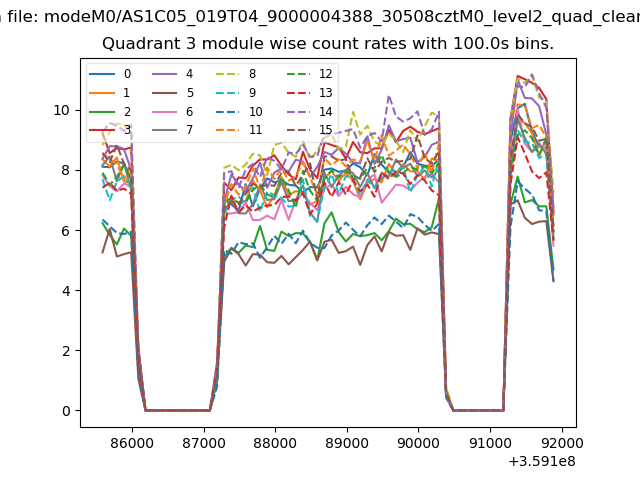 |
 |
| Parameter | Plot |
|---|---|
| CZT HV Monitor | 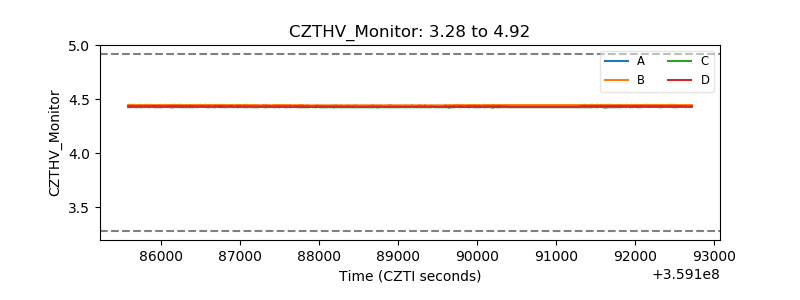 |
| D_VDD | 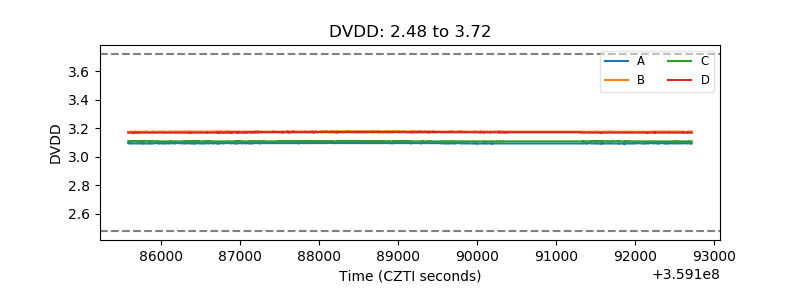 |
| Temperature 1 | 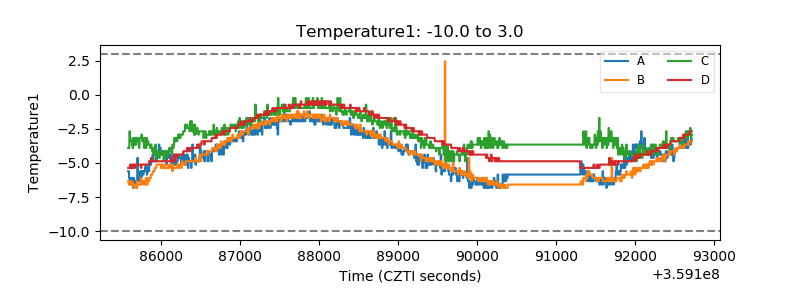 |
| Veto HV Monitor | 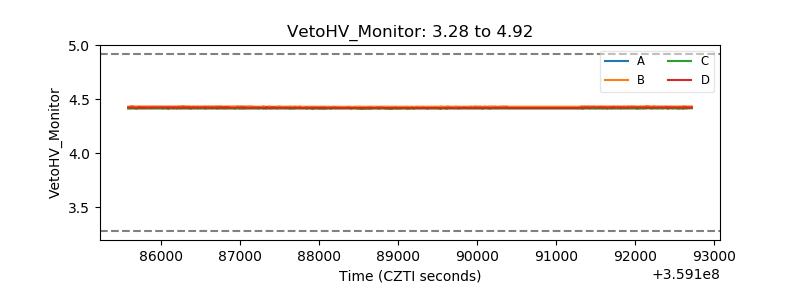 |
| Veto LLD | 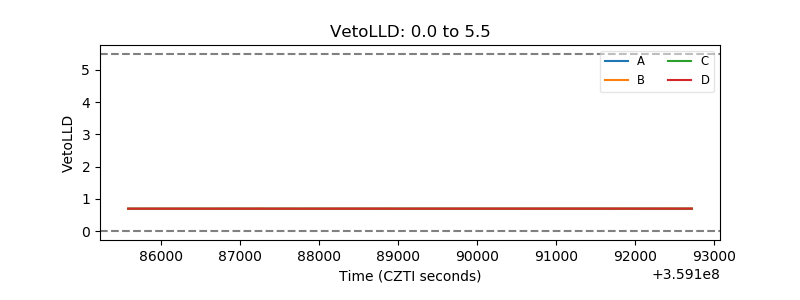 |
| Alpha Counter | 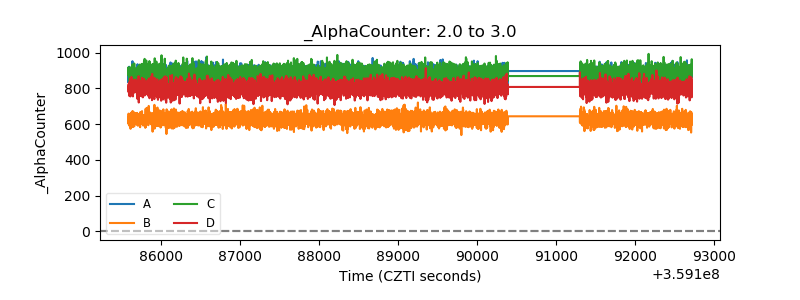 |
| _CPM_Rate | 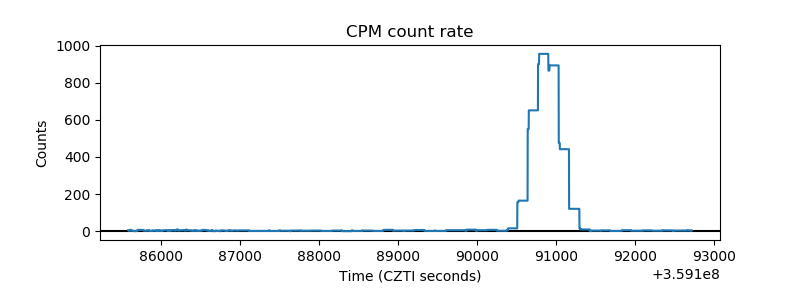 |
| CZT Counter |  |
| +2.5 Volts monitor |  |
| +5 Volts monitor |  |
| _ROLL_ROT | 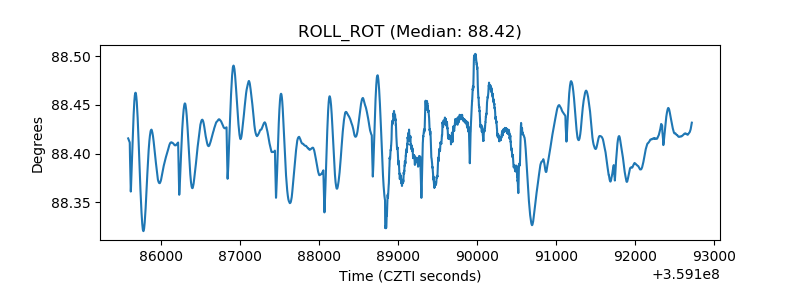 |
| _Roll_DEC | 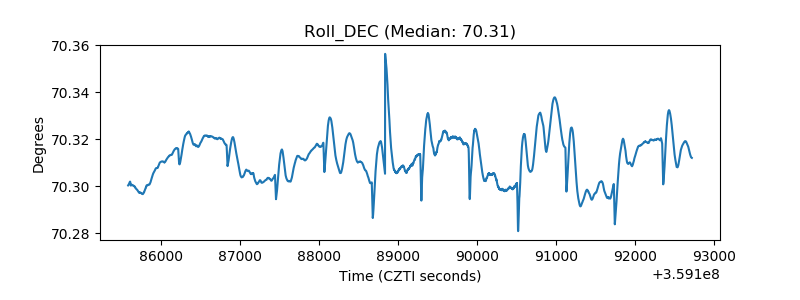 |
| _Roll_RA |  |
| Veto Counter | 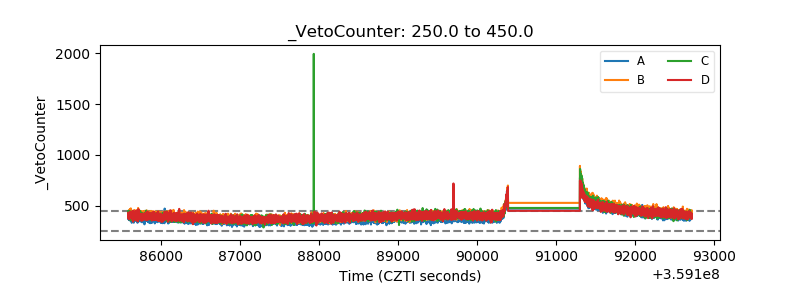 |