| Param | Original file | Final file |
|---|---|---|
| Filename | modeM0/AS1C05_019T04_9000004388_30511cztM0_level2.evt | modeM0/AS1C05_019T04_9000004388_30511cztM0_level2_quad_clean.evt |
| Size (bytes) | 550,756,800 | 93,516,480 |
| Size | 525.2 MB | 89.2 MB |
| Events in quadrant A | 3,423,593 | 621,317 |
| Events in quadrant B | 5,306,981 | 609,975 |
| Events in quadrant C | 3,435,945 | 583,406 |
| Events in quadrant D | 4,078,152 | 569,097 |
| Mode M0 | |||
|---|---|---|---|
| Quadrant | BADHDUFLAG | Total packets | Discarded packets |
| A | 0 | 14303 | 1 |
| B | 0 | 20049 | 1 |
| C | 0 | 14159 | 1 |
| D | 0 | 16101 | 1 |
| Mode M9 | |||
|---|---|---|---|
| Quadrant | BADHDUFLAG | Total packets | Discarded packets |
| A | 0 | 12 | 0 |
| B | 0 | 12 | 0 |
| C | 0 | 12 | 0 |
| D | 0 | 12 | 0 |
| Mode SS | |||
|---|---|---|---|
| Quadrant | BADHDUFLAG | Total packets | Discarded packets |
| A | 0 | 130 | 0 |
| B | 0 | 130 | 0 |
| C | 0 | 130 | 0 |
| D | 0 | 130 | 0 |
| Quadrant | Total seconds | Saturated seconds | Saturation percentage |
|---|---|---|---|
| A | 6424 | 96 | 1.494396% |
| B | 6425 | 166 | 2.583658% |
| C | 6425 | 188 | 2.926070% |
| D | 6425 | 237 | 3.688716% |
Noise dominated data is calculated using 1-second bins in cleaned event files. If a bin has >2000 counts, and if more than 50% of those come from <1% of pixels, then it is considered to be noise-dominated and hence unusable.
| Quadrant | # 1 sec bins | Bins with >0 counts | Bins with >2000 counts | High rate bins dominated by noise | Noise dominated (total time) | Noise dominated (detector-on time) | Marked lightcurve |
|---|---|---|---|---|---|---|---|
| A | 7569 | 6425 | 4 | 4 | 0.05% | 0.06% | 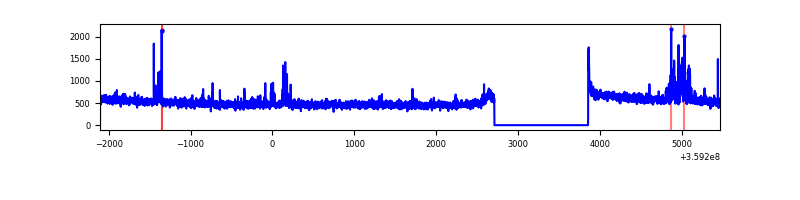 |
| B | 7570 | 6426 | 25 | 25 | 0.33% | 0.39% | 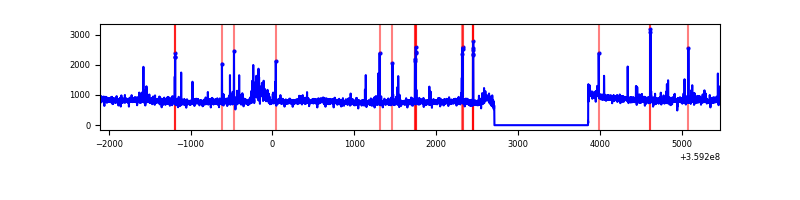 |
| C | 7570 | 6426 | 0 | 0 | 0.00% | 0.00% | 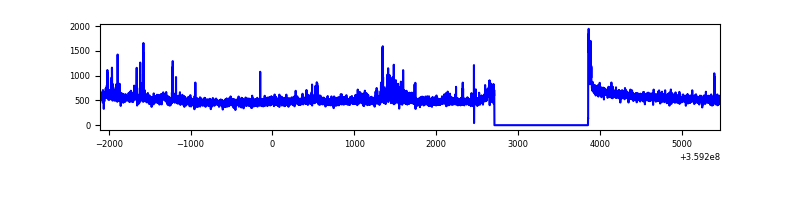 |
| D | 7570 | 6426 | 142 | 142 | 1.88% | 2.21% | 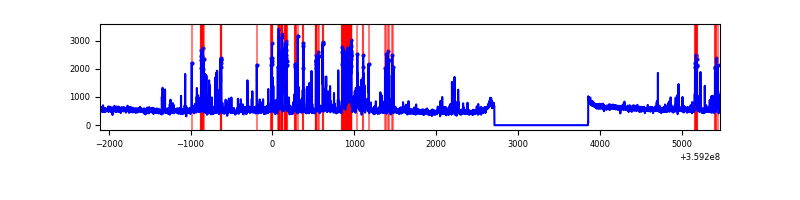 |
Top three noisy pixels from each quadrant. If the there are fewer than three noisy pixels in the level2.evt file, extra rows are filled as -1
| Pixel properties | Quadrant properties | ||||||
|---|---|---|---|---|---|---|---|
| Quadrant | DetID | PixID | Counts | Sigma | Mean | Median | Sigma |
| A | 12 | 96 | 131141 | 779.74 | 845 | 831 | 167.1 |
| A | 8 | 192 | 12542 | 70.08 | 845 | 831 | 167.1 |
| A | 13 | 254 | 11669 | 64.85 | 845 | 831 | 167.1 |
| B | 6 | 159 | 1791485 | 11655.8 | 823 | 806 | 153.6 |
| B | 0 | 229 | 129993 | 840.9 | 823 | 806 | 153.6 |
| B | 0 | 155 | 78186 | 503.68 | 823 | 806 | 153.6 |
| C | 14 | 238 | 159641 | 883.7 | 789 | 793 | 179.8 |
| C | 10 | 22 | 64375 | 353.72 | 789 | 793 | 179.8 |
| C | 3 | 233 | 60423 | 331.73 | 789 | 793 | 179.8 |
| D | 13 | 249 | 251853 | 1325.17 | 803 | 784 | 189.5 |
| D | 8 | 195 | 251258 | 1322.03 | 803 | 784 | 189.5 |
| D | 12 | 218 | 130576 | 685.06 | 803 | 784 | 189.5 |
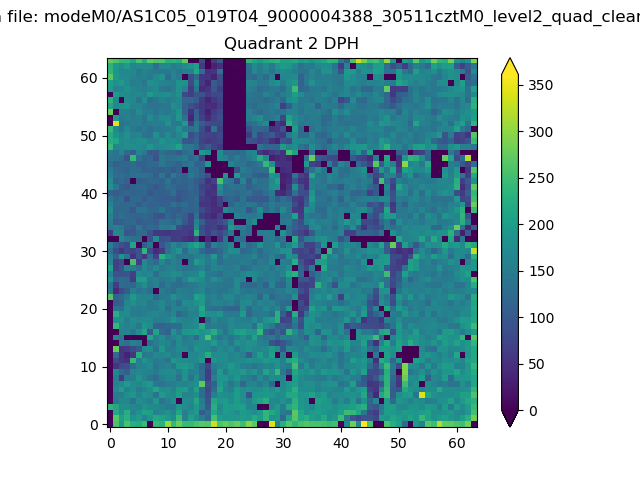
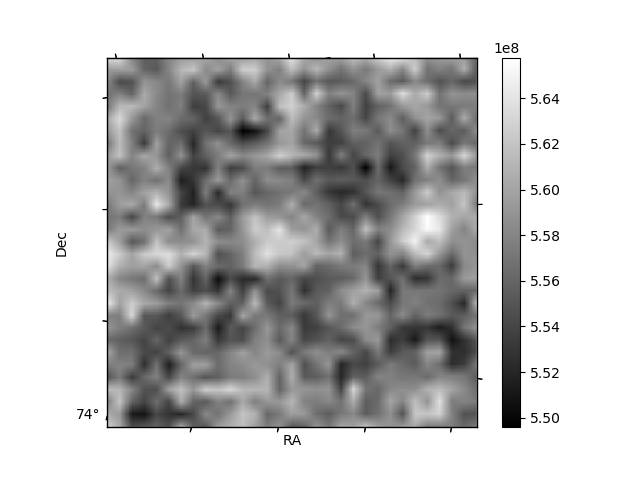
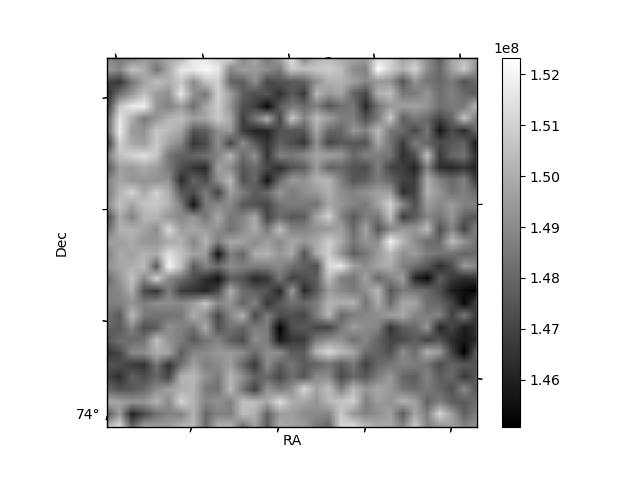
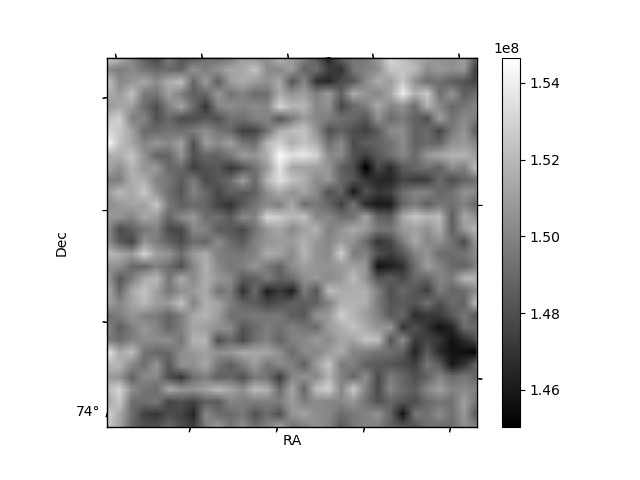
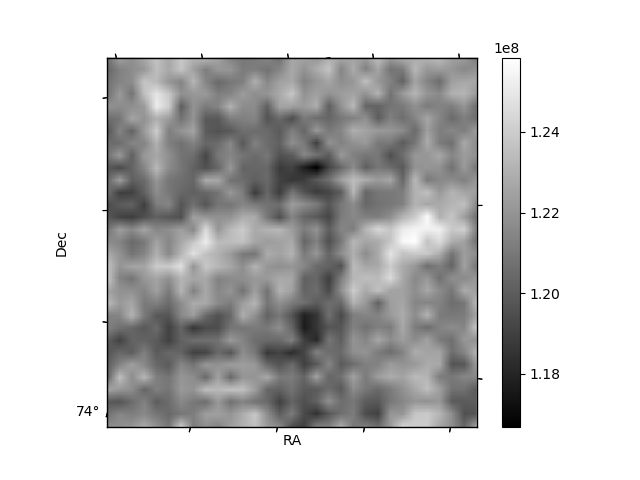
Histogram calculated using DETX and DETY for each event in the final _common_clean file
| Quadrant A | 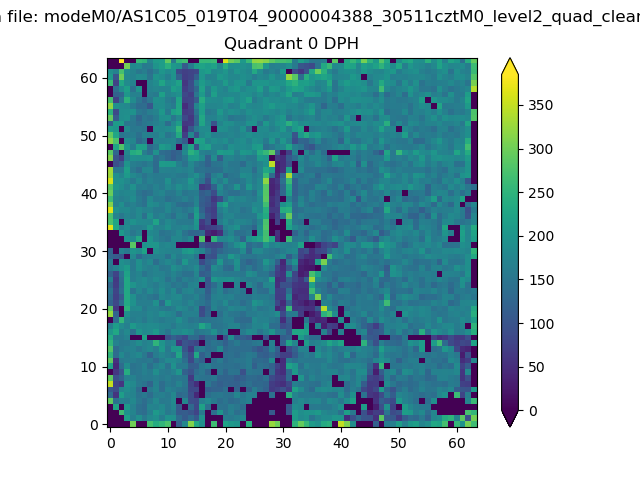 |
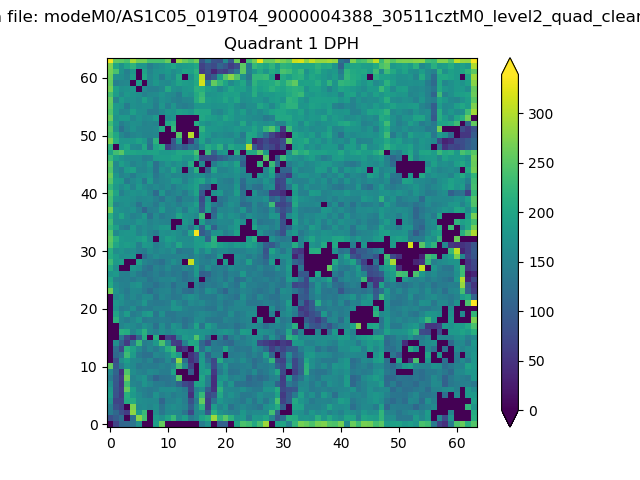 |
Quadrant B |
|---|---|---|---|
| Quadrant D | 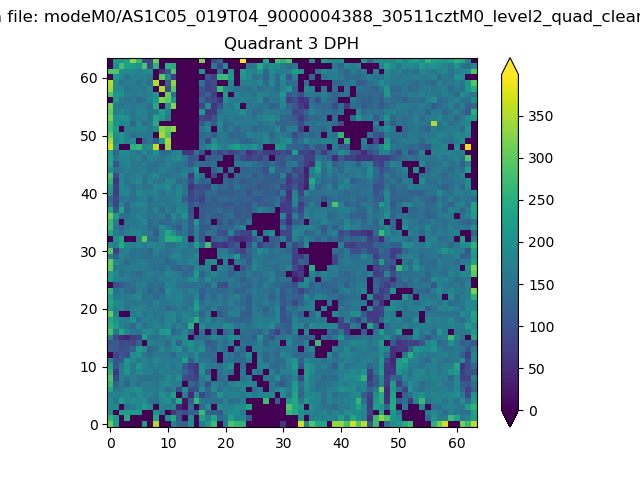 |
 |
Quadrant C |
| Plot type | Count rate plots | Images |
|---|---|---|
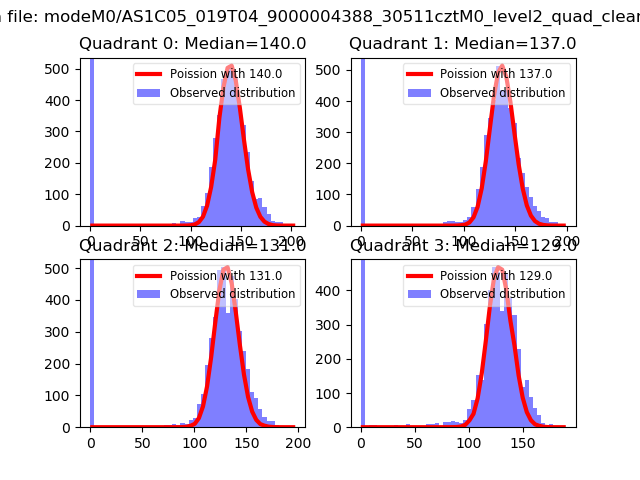
| Comparison with Poisson distribution Blue bars denote a histogram of data divided into 1 sec bins. Red curve is a Poisson curve with rate = median count rate of data. |
 |
 |
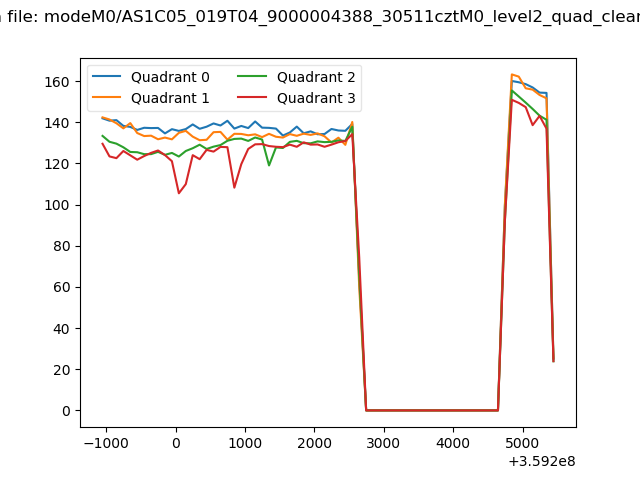
| Quadrant-wise count rates Data is divided into 100 sec bins |
 |
|
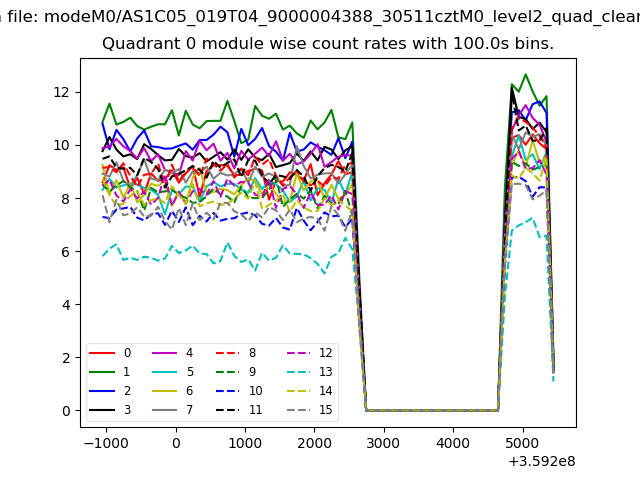
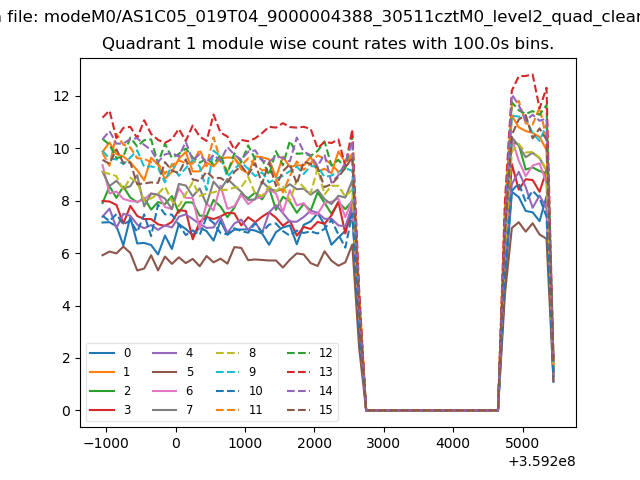
| Module-wise count rates for Quadrant A Data is divided into 100 sec bins |
 |
 |
| Module-wise count rates for Quadrant B Data is divided into 100 sec bins |
 |
 |
| Module-wise count rates for Quadrant C Data is divided into 100 sec bins |
 |
 |
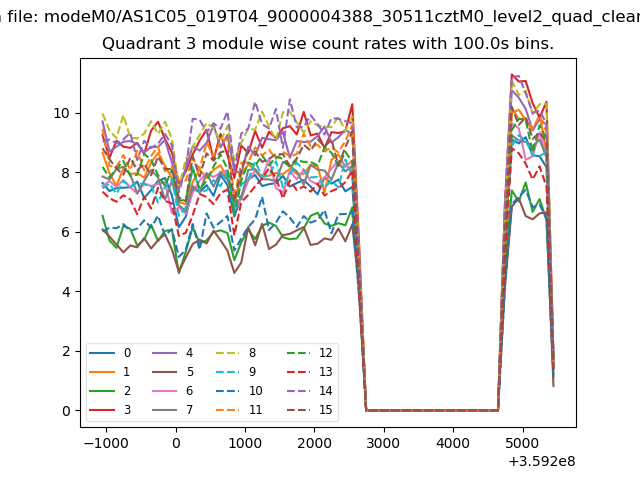
| Module-wise count rates for Quadrant D Data is divided into 100 sec bins |
 |
 |
| Parameter | Plot |
|---|---|
| CZT HV Monitor | 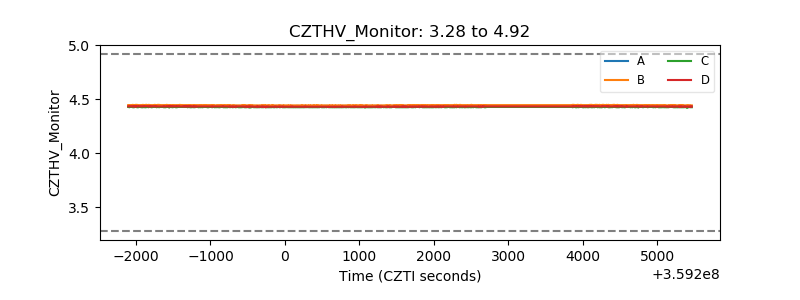 |
| D_VDD |  |
| Temperature 1 | 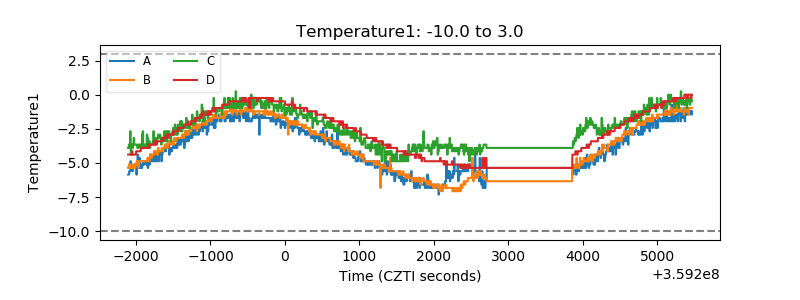 |
| Veto HV Monitor | 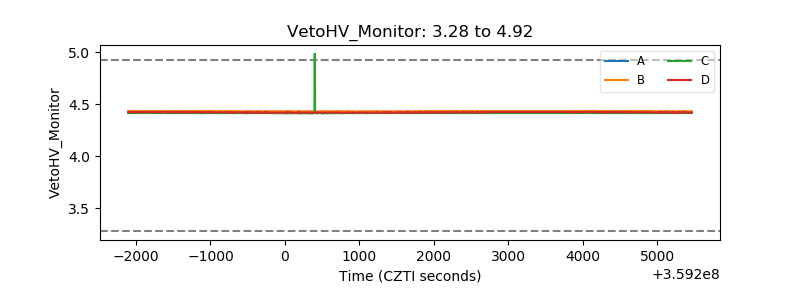 |
| Veto LLD | 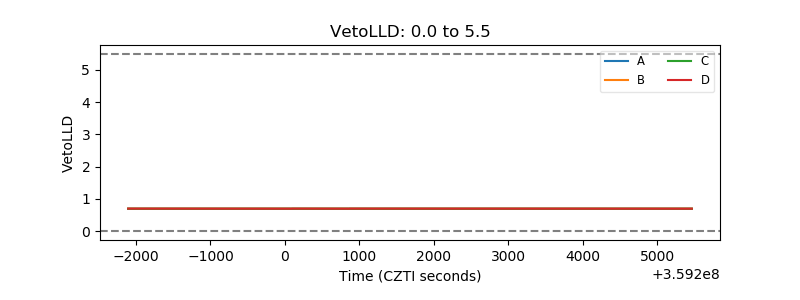 |
| Alpha Counter | 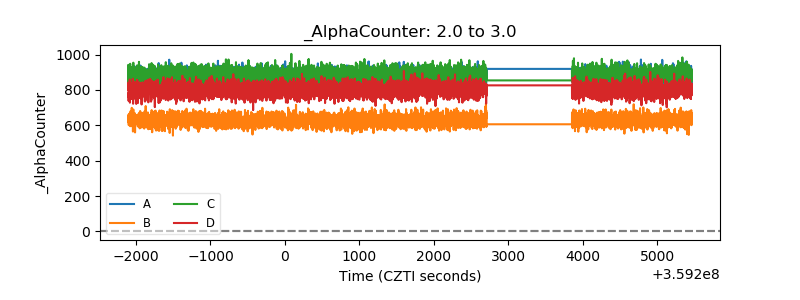 |
| _CPM_Rate | 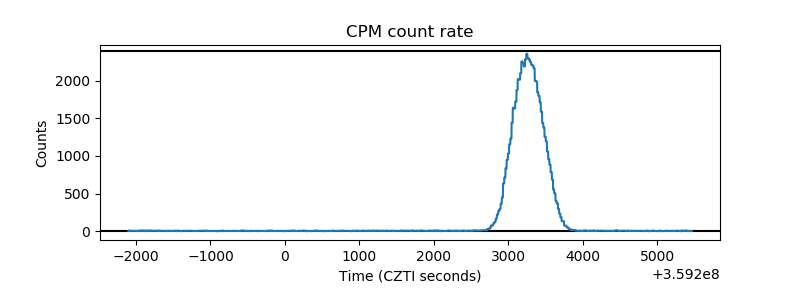 |
| CZT Counter | 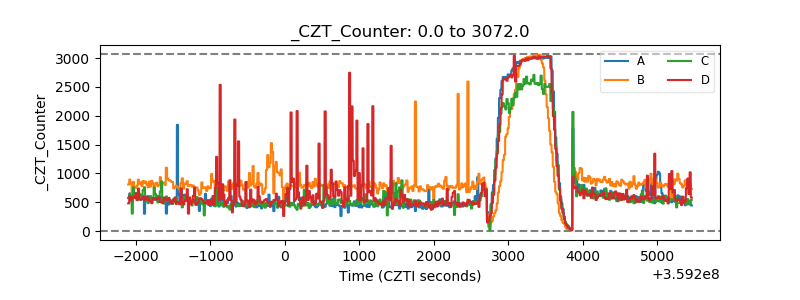 |
| +2.5 Volts monitor |  |
| +5 Volts monitor |  |
| _ROLL_ROT | 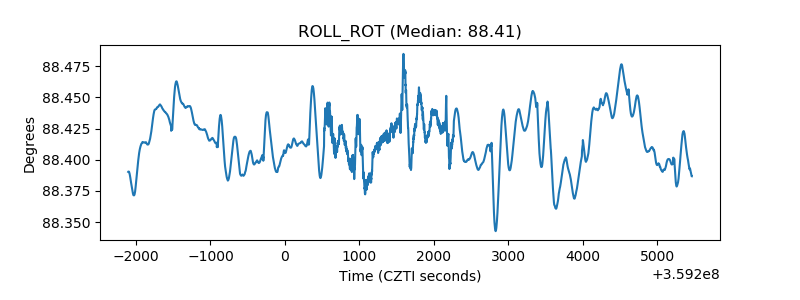 |
| _Roll_DEC | 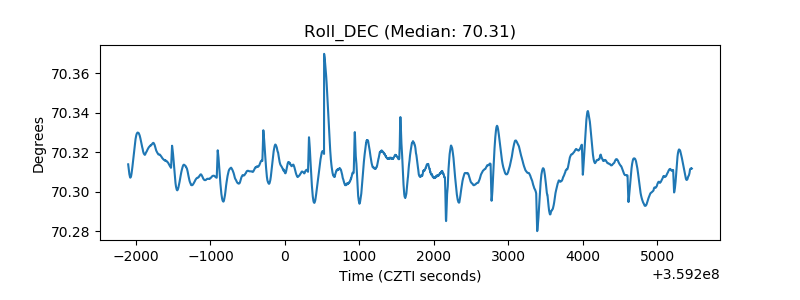 |
| _Roll_RA |  |
| Veto Counter | 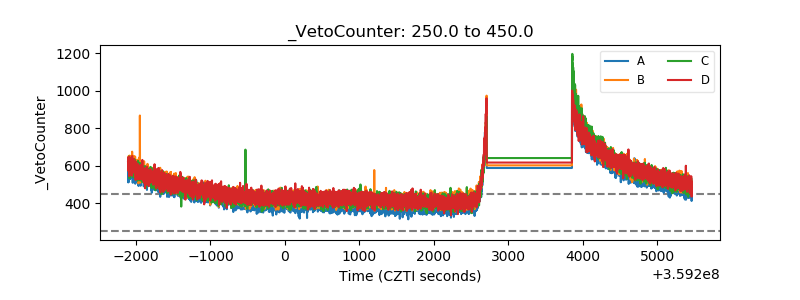 |