| Param | Original file | Final file |
|---|---|---|
| Filename | modeM0/AS1C05_019T04_9000004388_30512cztM0_level2.evt | modeM0/AS1C05_019T04_9000004388_30512cztM0_level2_quad_clean.evt |
| Size (bytes) | 525,035,520 | 112,331,520 |
| Size | 500.7 MB | 107.1 MB |
| Events in quadrant A | 3,335,939 | 775,586 |
| Events in quadrant B | 5,043,359 | 762,675 |
| Events in quadrant C | 3,200,386 | 732,170 |
| Events in quadrant D | 3,919,403 | 717,477 |
| Mode M0 | |||
|---|---|---|---|
| Quadrant | BADHDUFLAG | Total packets | Discarded packets |
| A | 0 | 13693 | 1 |
| B | 0 | 18778 | 1 |
| C | 0 | 13007 | 1 |
| D | 0 | 15527 | 1 |
| Mode M9 | |||
|---|---|---|---|
| Quadrant | BADHDUFLAG | Total packets | Discarded packets |
| A | 0 | 12 | 0 |
| B | 0 | 12 | 0 |
| C | 0 | 12 | 0 |
| D | 0 | 12 | 0 |
| Mode SS | |||
|---|---|---|---|
| Quadrant | BADHDUFLAG | Total packets | Discarded packets |
| A | 0 | 122 | 0 |
| B | 0 | 122 | 0 |
| C | 0 | 122 | 0 |
| D | 0 | 122 | 0 |
| Quadrant | Total seconds | Saturated seconds | Saturation percentage |
|---|---|---|---|
| A | 5926 | 78 | 1.316234% |
| B | 5925 | 137 | 2.312236% |
| C | 5925 | 247 | 4.168776% |
| D | 5926 | 162 | 2.733716% |
Noise dominated data is calculated using 1-second bins in cleaned event files. If a bin has >2000 counts, and if more than 50% of those come from <1% of pixels, then it is considered to be noise-dominated and hence unusable.
| Quadrant | # 1 sec bins | Bins with >0 counts | Bins with >2000 counts | High rate bins dominated by noise | Noise dominated (total time) | Noise dominated (detector-on time) | Marked lightcurve |
|---|---|---|---|---|---|---|---|
| A | 7191 | 5927 | 8 | 8 | 0.11% | 0.13% | 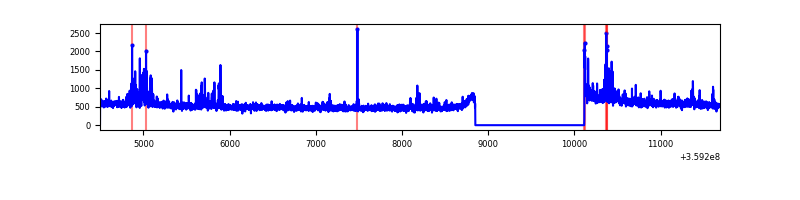 |
| B | 7190 | 5926 | 16 | 16 | 0.22% | 0.27% | 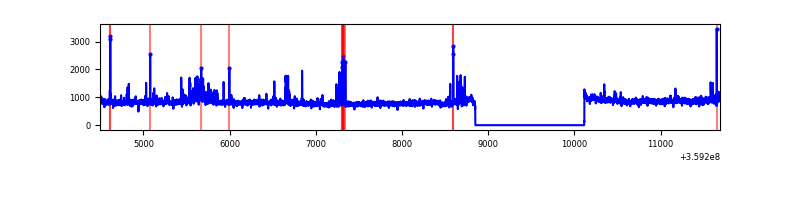 |
| C | 7190 | 5926 | 1 | 1 | 0.01% | 0.02% | 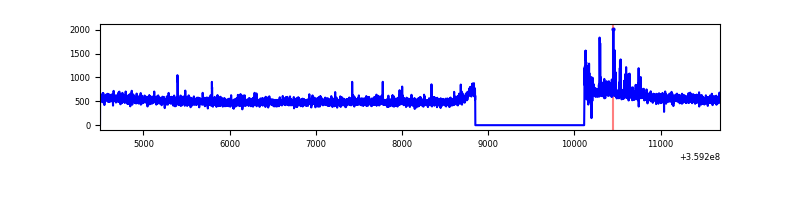 |
| D | 7191 | 5927 | 116 | 116 | 1.61% | 1.96% | 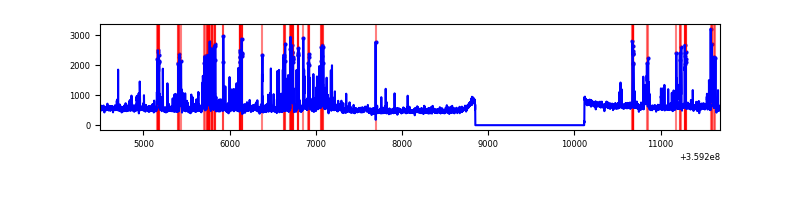 |
Top three noisy pixels from each quadrant. If the there are fewer than three noisy pixels in the level2.evt file, extra rows are filled as -1
| Pixel properties | Quadrant properties | ||||||
|---|---|---|---|---|---|---|---|
| Quadrant | DetID | PixID | Counts | Sigma | Mean | Median | Sigma |
| A | 12 | 96 | 228223 | 1444.34 | 799 | 787 | 157.5 |
| A | 8 | 192 | 14379 | 86.32 | 799 | 787 | 157.5 |
| A | 13 | 254 | 11228 | 66.31 | 799 | 787 | 157.5 |
| B | 6 | 159 | 1690585 | 11798.26 | 777 | 762 | 143.2 |
| B | 0 | 155 | 96041 | 665.23 | 777 | 762 | 143.2 |
| B | 0 | 229 | 92040 | 637.3 | 777 | 762 | 143.2 |
| C | 14 | 238 | 161365 | 940.85 | 745 | 753 | 170.7 |
| C | 14 | 254 | 52037 | 300.42 | 745 | 753 | 170.7 |
| C | 10 | 22 | 37305 | 214.12 | 745 | 753 | 170.7 |
| D | 8 | 195 | 282745 | 1582.76 | 767 | 749 | 178.2 |
| D | 13 | 249 | 193106 | 1079.64 | 767 | 749 | 178.2 |
| D | 12 | 218 | 158563 | 885.76 | 767 | 749 | 178.2 |
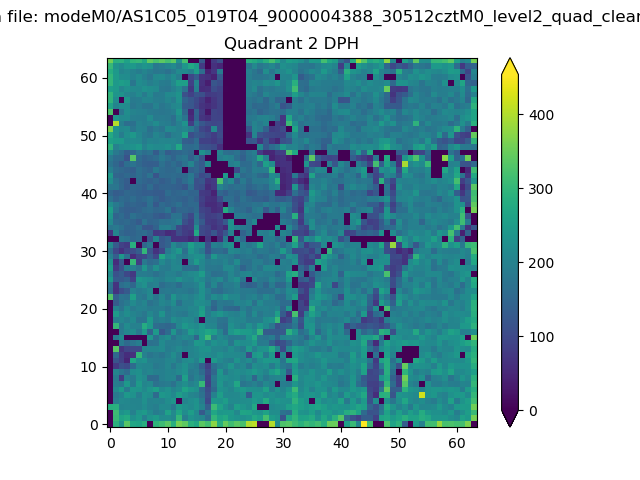
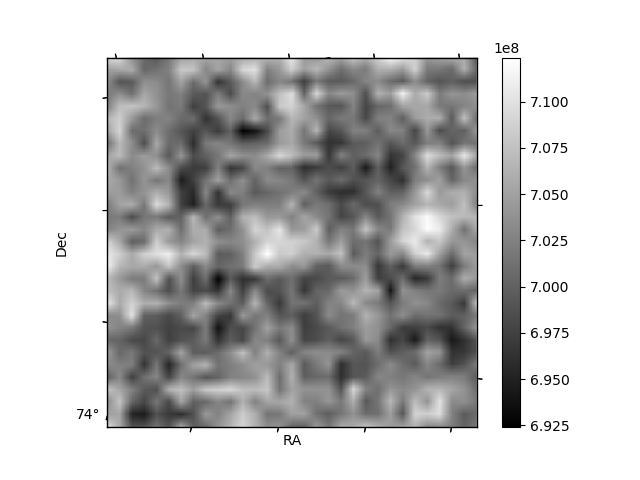
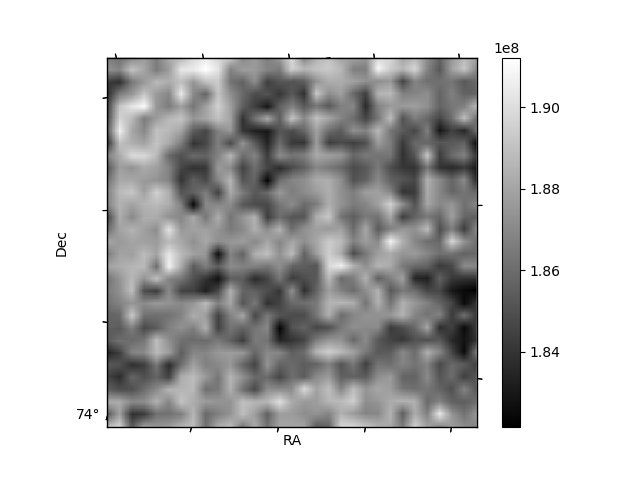
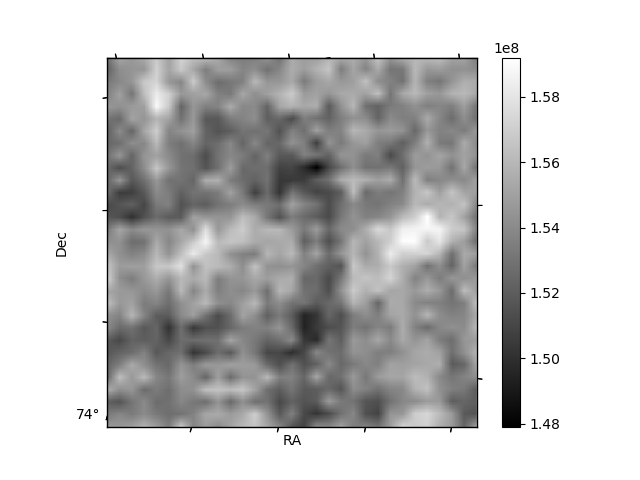
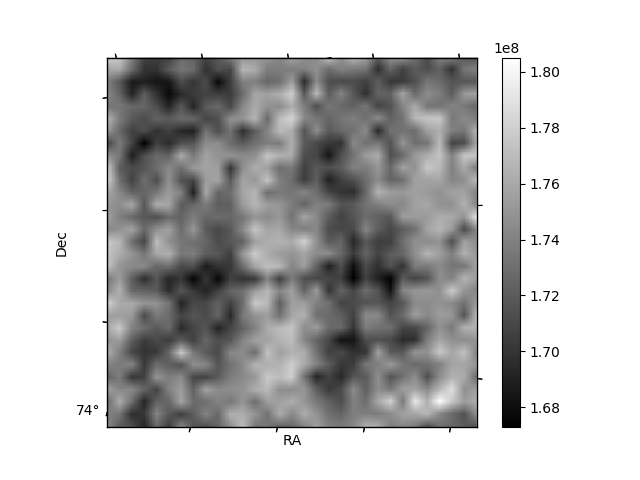
Histogram calculated using DETX and DETY for each event in the final _common_clean file
| Quadrant A | 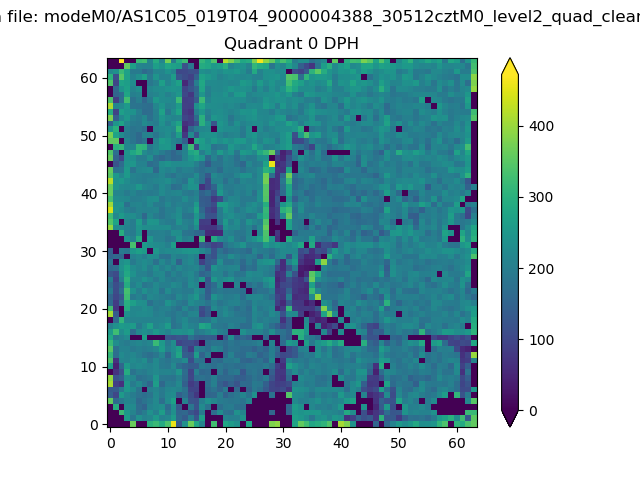 |
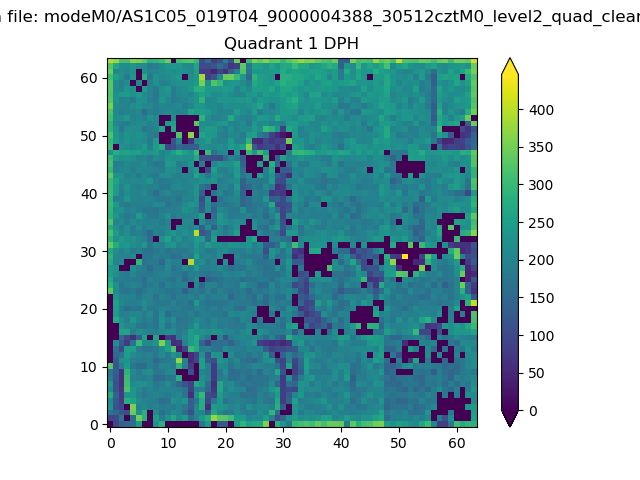 |
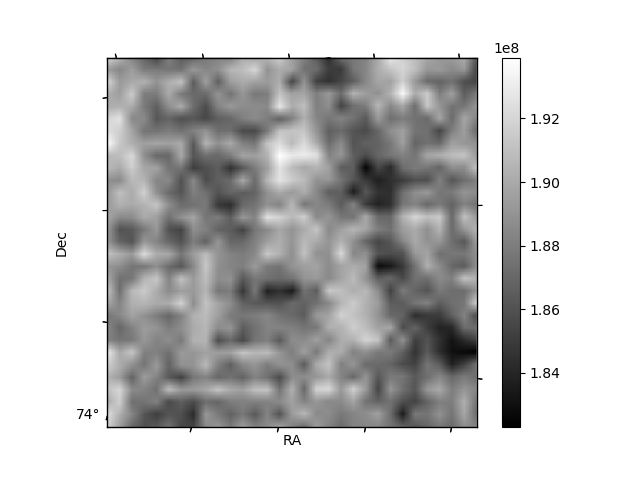
Quadrant B |
|---|---|---|---|
| Quadrant D | 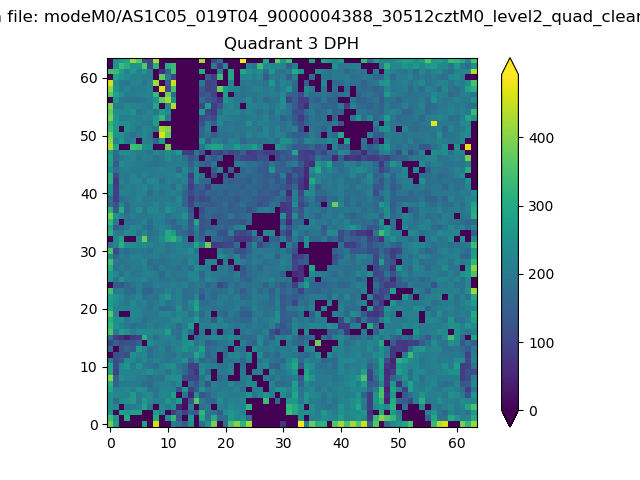 |
 |
Quadrant C |
| Plot type | Count rate plots | Images |
|---|---|---|
| Comparison with Poisson distribution Blue bars denote a histogram of data divided into 1 sec bins. Red curve is a Poisson curve with rate = median count rate of data. |
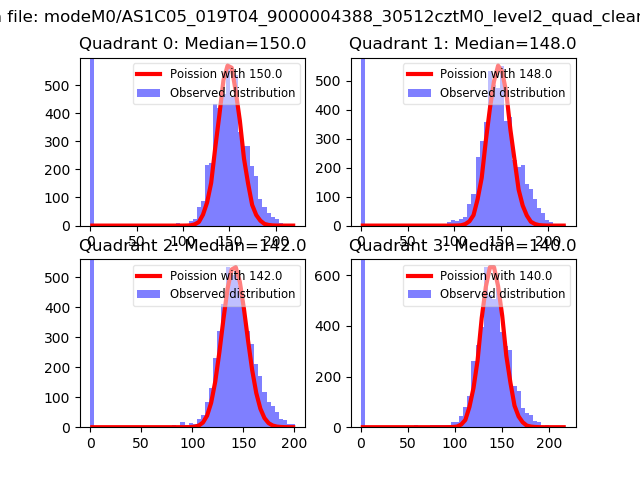 |
 |
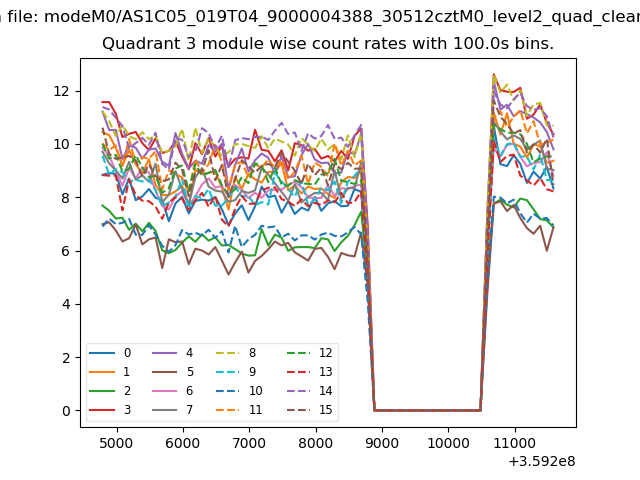
| Quadrant-wise count rates Data is divided into 100 sec bins |
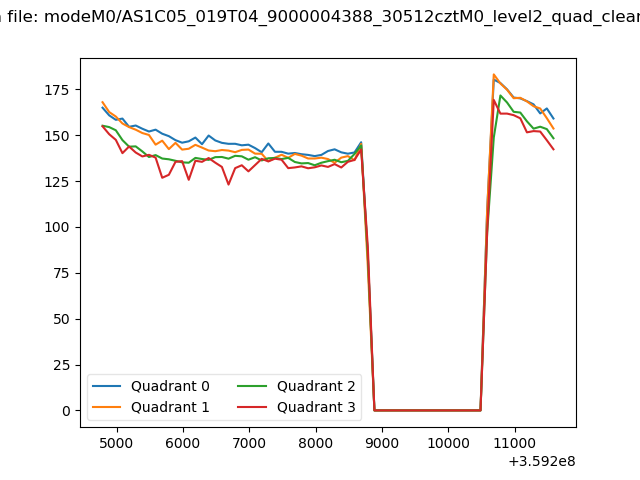 |
|
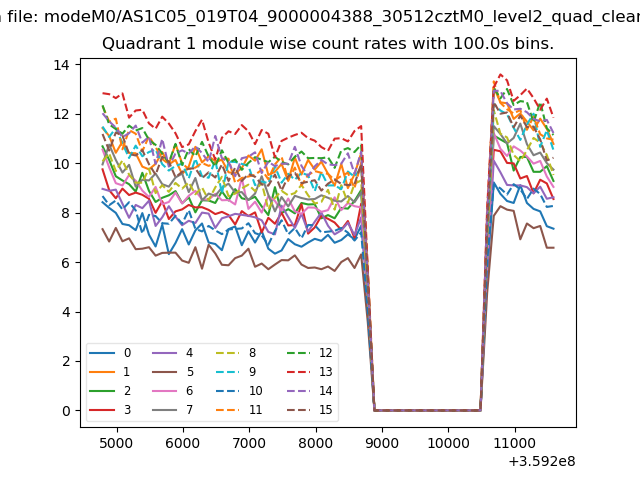
| Module-wise count rates for Quadrant A Data is divided into 100 sec bins |
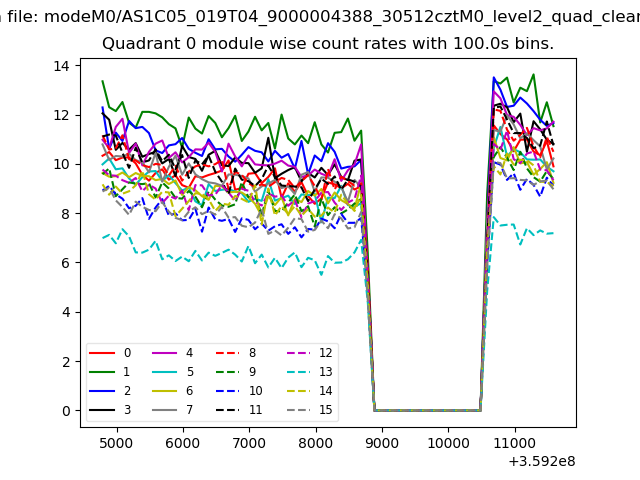 |
 |
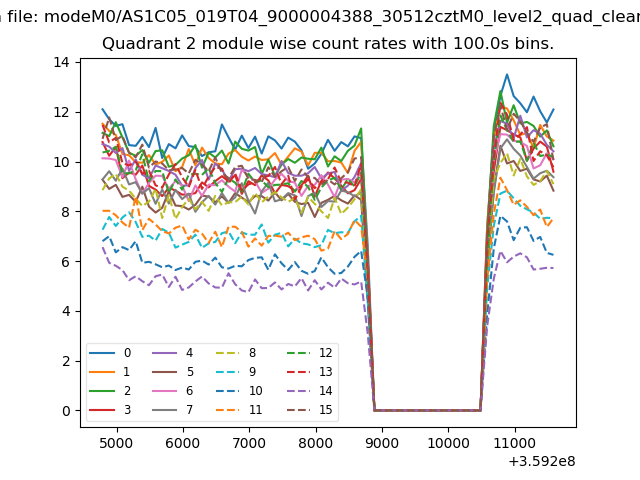
| Module-wise count rates for Quadrant B Data is divided into 100 sec bins |
 |
 |
| Module-wise count rates for Quadrant C Data is divided into 100 sec bins |
 |
 |
| Module-wise count rates for Quadrant D Data is divided into 100 sec bins |
 |
 |
| Parameter | Plot |
|---|---|
| CZT HV Monitor | 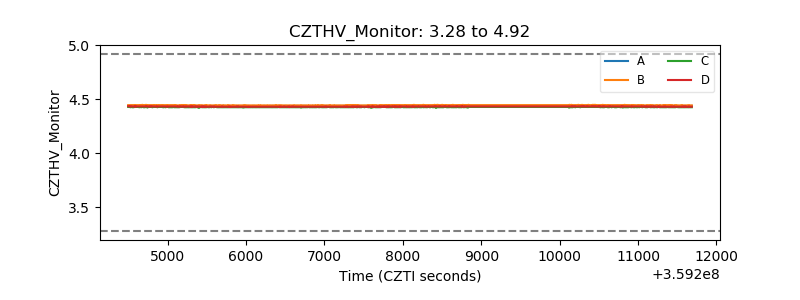 |
| D_VDD | 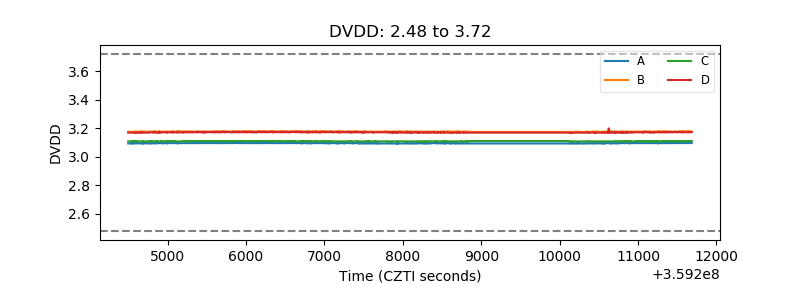 |
| Temperature 1 | 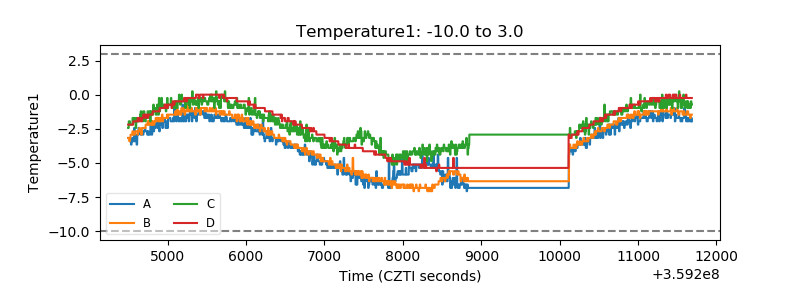 |
| Veto HV Monitor | 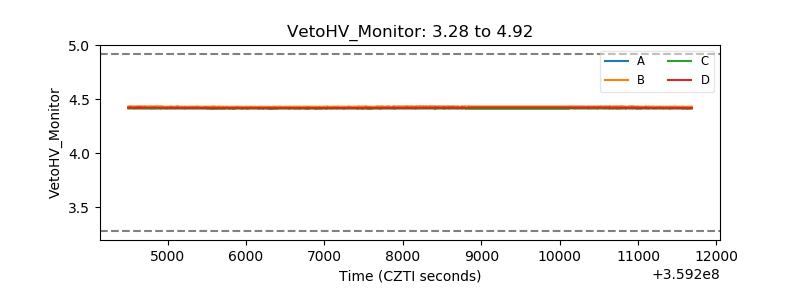 |
| Veto LLD | 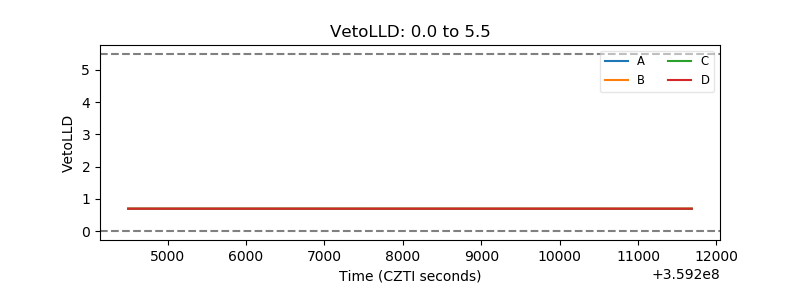 |
| Alpha Counter | 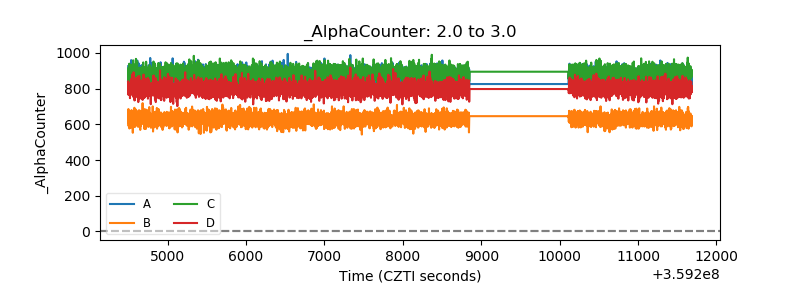 |
| _CPM_Rate |  |
| CZT Counter | 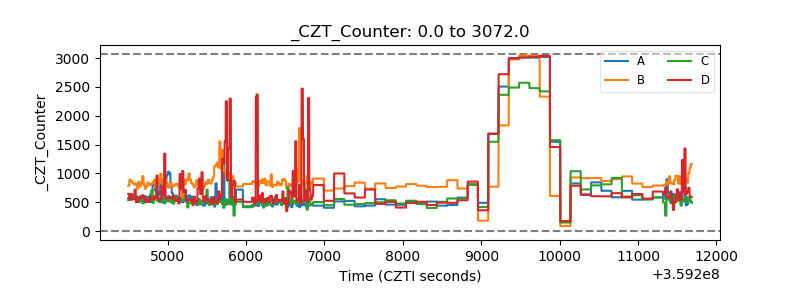 |
| +2.5 Volts monitor |  |
| +5 Volts monitor |  |
| _ROLL_ROT | 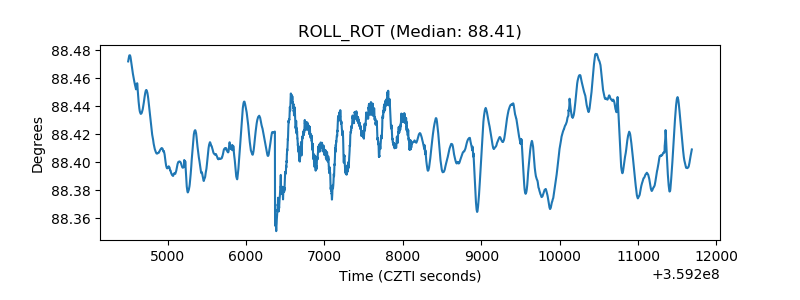 |
| _Roll_DEC | 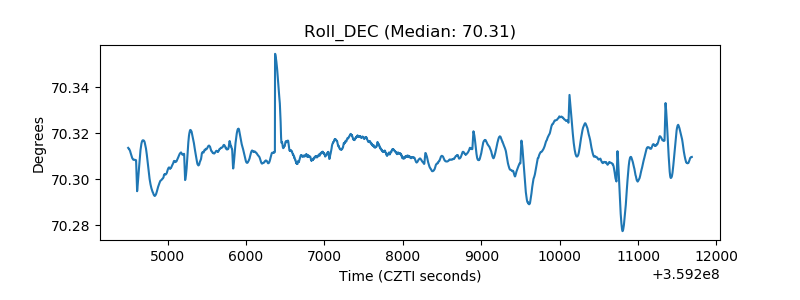 |
| _Roll_RA | 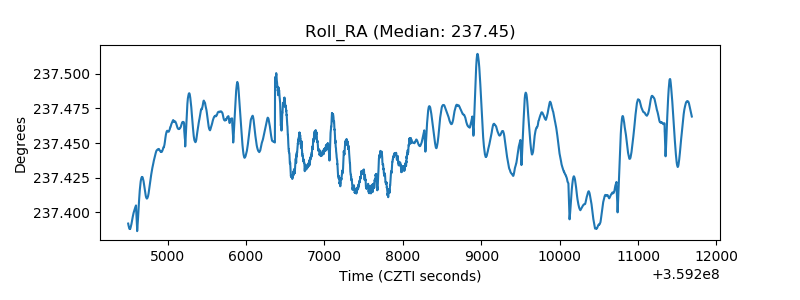 |
| Veto Counter | 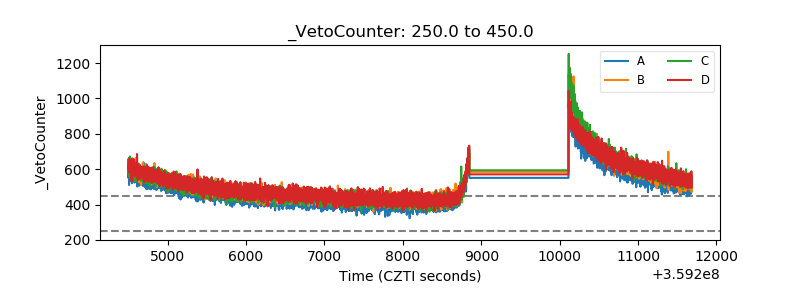 |