| Param | Original file | Final file |
|---|---|---|
| Filename | modeM0/AS1C05_019T04_9000004388_30514cztM0_level2.evt | modeM0/AS1C05_019T04_9000004388_30514cztM0_level2_quad_clean.evt |
| Size (bytes) | 499,893,120 | 120,985,920 |
| Size | 476.7 MB | 115.4 MB |
| Events in quadrant A | 2,962,627 | 837,057 |
| Events in quadrant B | 4,781,244 | 829,045 |
| Events in quadrant C | 3,105,209 | 814,121 |
| Events in quadrant D | 3,905,685 | 787,587 |
| Mode M0 | |||
|---|---|---|---|
| Quadrant | BADHDUFLAG | Total packets | Discarded packets |
| A | 0 | 12306 | 1 |
| B | 0 | 17968 | 1 |
| C | 0 | 12631 | 1 |
| D | 0 | 15390 | 1 |
| Mode M9 | |||
|---|---|---|---|
| Quadrant | BADHDUFLAG | Total packets | Discarded packets |
| A | 0 | 13 | 0 |
| B | 0 | 13 | 0 |
| C | 0 | 13 | 0 |
| D | 0 | 13 | 0 |
| Mode SS | |||
|---|---|---|---|
| Quadrant | BADHDUFLAG | Total packets | Discarded packets |
| A | 0 | 114 | 0 |
| B | 0 | 114 | 0 |
| C | 0 | 114 | 0 |
| D | 0 | 114 | 0 |
| Quadrant | Total seconds | Saturated seconds | Saturation percentage |
|---|---|---|---|
| A | 5675 | 138 | 2.431718% |
| B | 5676 | 185 | 3.259338% |
| C | 5676 | 217 | 3.823115% |
| D | 5676 | 280 | 4.933051% |
Noise dominated data is calculated using 1-second bins in cleaned event files. If a bin has >2000 counts, and if more than 50% of those come from <1% of pixels, then it is considered to be noise-dominated and hence unusable.
| Quadrant | # 1 sec bins | Bins with >0 counts | Bins with >2000 counts | High rate bins dominated by noise | Noise dominated (total time) | Noise dominated (detector-on time) | Marked lightcurve |
|---|---|---|---|---|---|---|---|
| A | 6935 | 5676 | 19 | 19 | 0.27% | 0.33% | 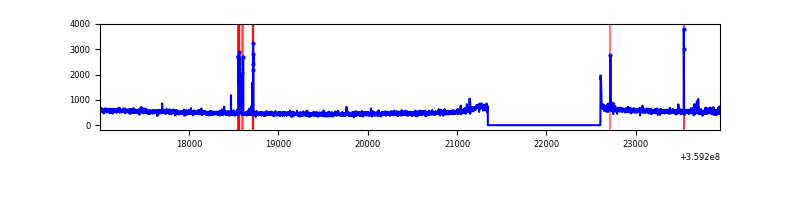 |
| B | 6936 | 5677 | 11 | 11 | 0.16% | 0.19% | 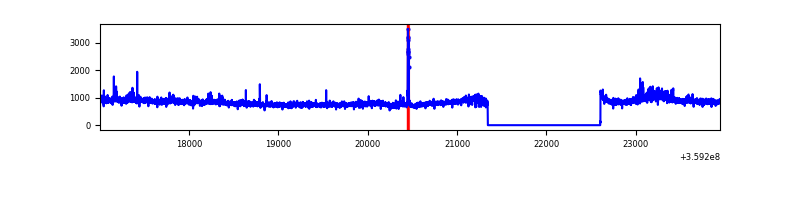 |
| C | 6936 | 5677 | 10 | 10 | 0.14% | 0.18% | 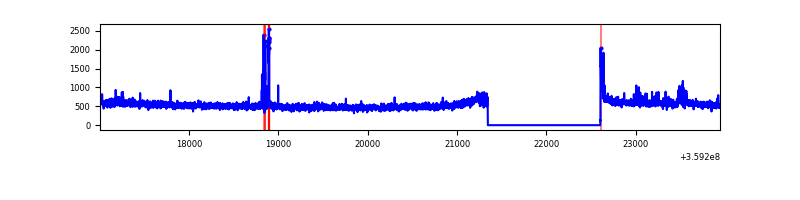 |
| D | 6936 | 5677 | 169 | 169 | 2.44% | 2.98% | 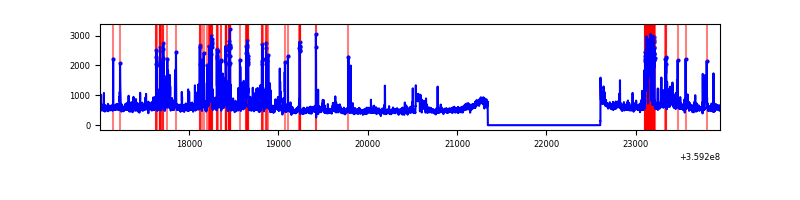 |
Top three noisy pixels from each quadrant. If the there are fewer than three noisy pixels in the level2.evt file, extra rows are filled as -1
| Pixel properties | Quadrant properties | ||||||
|---|---|---|---|---|---|---|---|
| Quadrant | DetID | PixID | Counts | Sigma | Mean | Median | Sigma |
| A | 12 | 96 | 81543 | 555.98 | 741 | 728 | 145.4 |
| A | 8 | 192 | 12280 | 79.47 | 741 | 728 | 145.4 |
| A | 13 | 254 | 10370 | 66.33 | 741 | 728 | 145.4 |
| B | 6 | 159 | 1734646 | 12868.9 | 728 | 712 | 134.7 |
| B | 0 | 155 | 87842 | 646.66 | 728 | 712 | 134.7 |
| B | 4 | 171 | 36415 | 264.98 | 728 | 712 | 134.7 |
| C | 14 | 238 | 135846 | 824.6 | 719 | 725 | 163.9 |
| C | 3 | 233 | 64931 | 391.83 | 719 | 725 | 163.9 |
| C | 10 | 22 | 36004 | 215.3 | 719 | 725 | 163.9 |
| D | 13 | 249 | 287668 | 1703.3 | 721 | 705 | 168.5 |
| D | 12 | 218 | 274781 | 1626.8 | 721 | 705 | 168.5 |
| D | 8 | 195 | 261054 | 1545.33 | 721 | 705 | 168.5 |
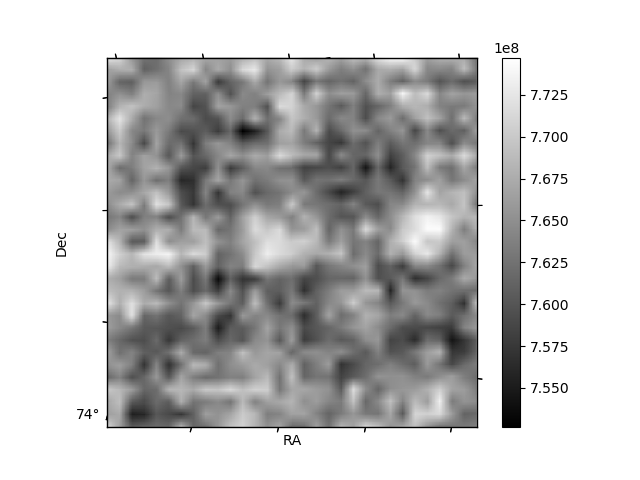
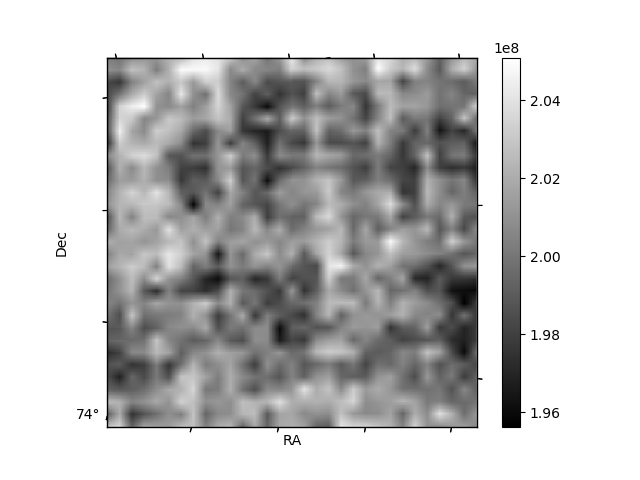
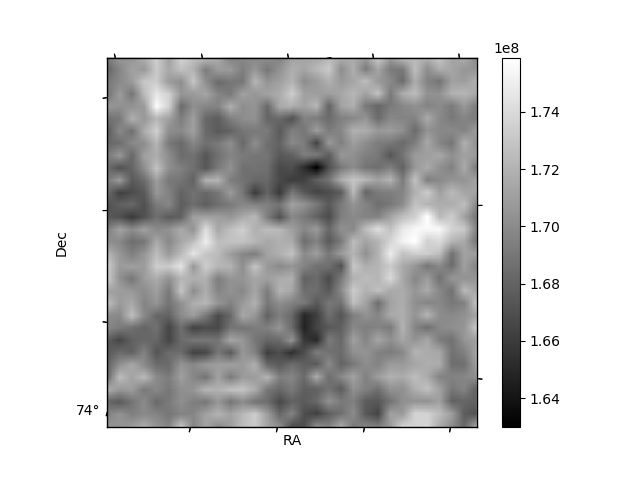
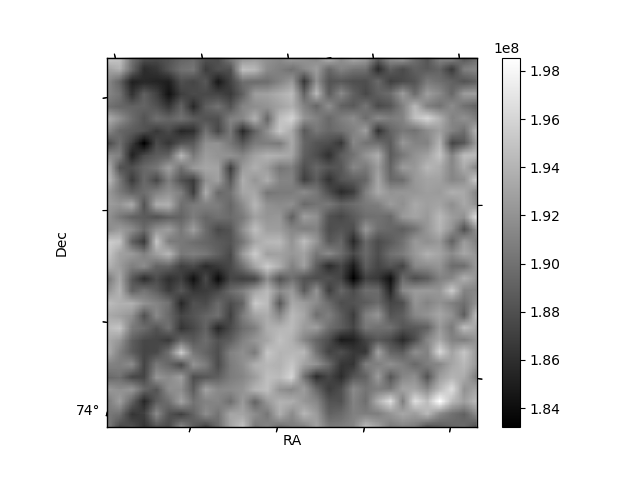
Histogram calculated using DETX and DETY for each event in the final _common_clean file
| Quadrant A | 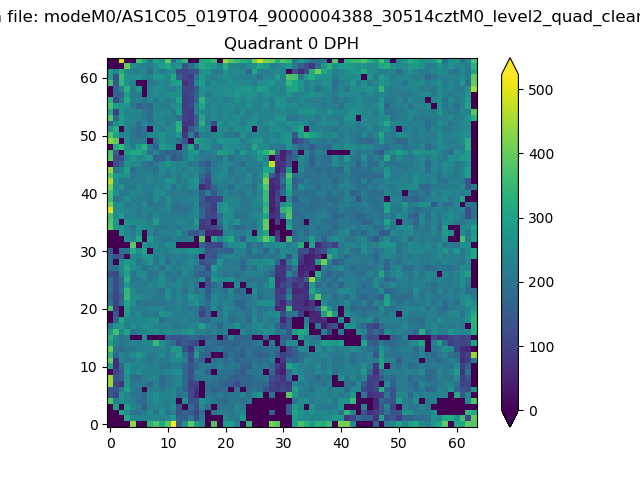 |
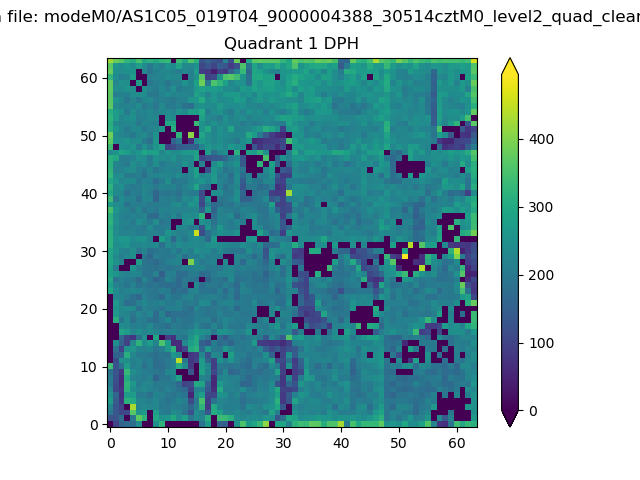 |
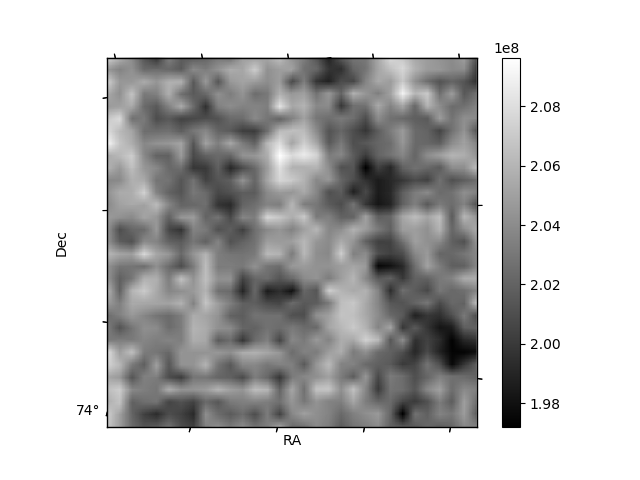
Quadrant B |
|---|---|---|---|
| Quadrant D | 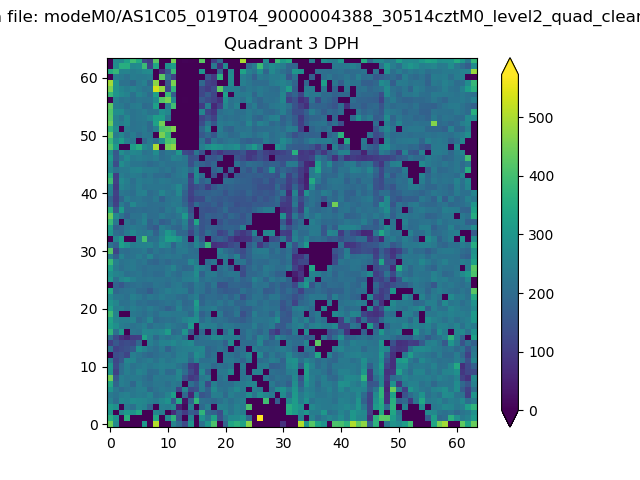 |
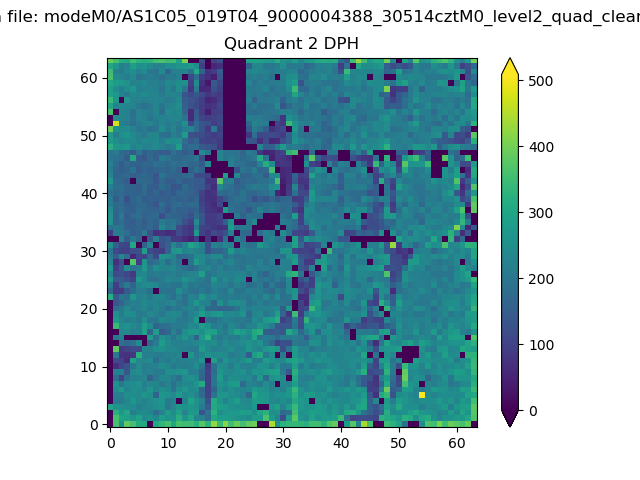 |
Quadrant C |
| Plot type | Count rate plots | Images |
|---|---|---|
| Comparison with Poisson distribution Blue bars denote a histogram of data divided into 1 sec bins. Red curve is a Poisson curve with rate = median count rate of data. |
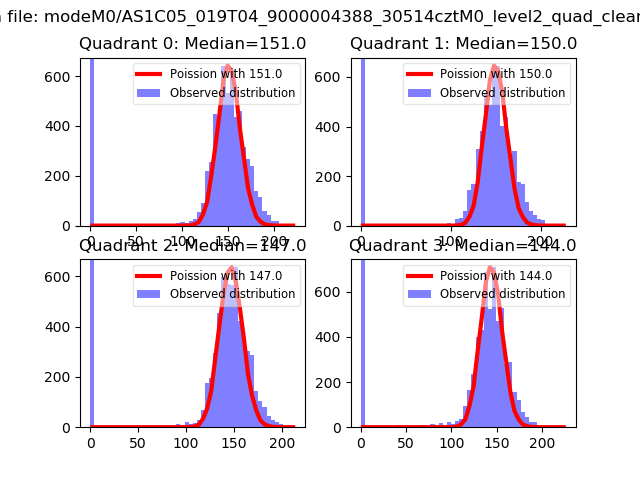 |
 |
| Quadrant-wise count rates Data is divided into 100 sec bins |
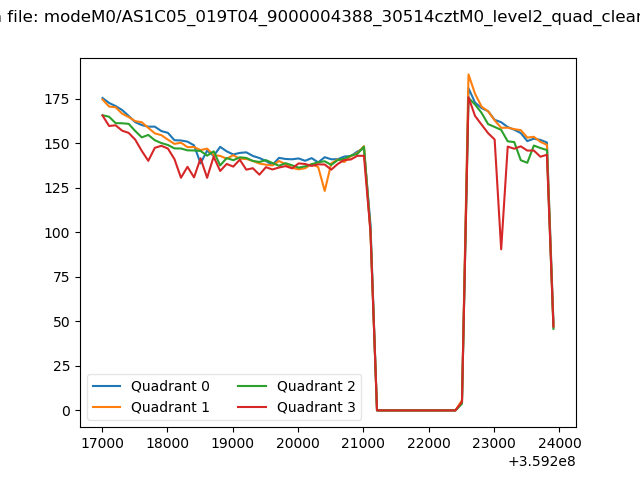 |
|
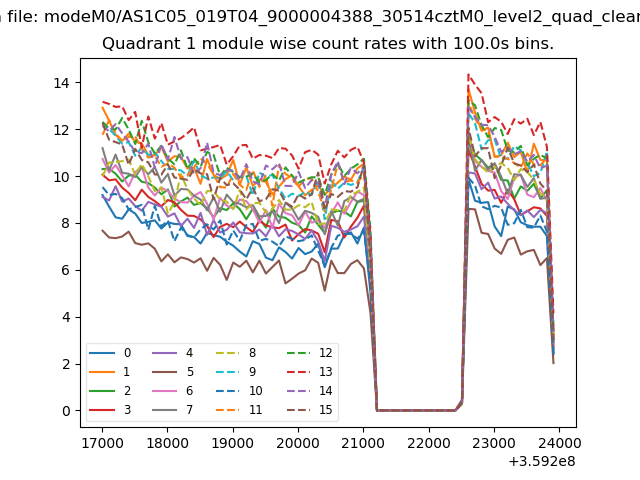
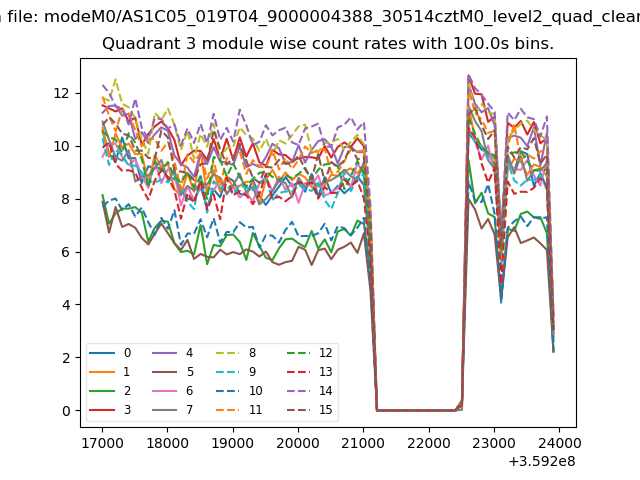
| Module-wise count rates for Quadrant A Data is divided into 100 sec bins |
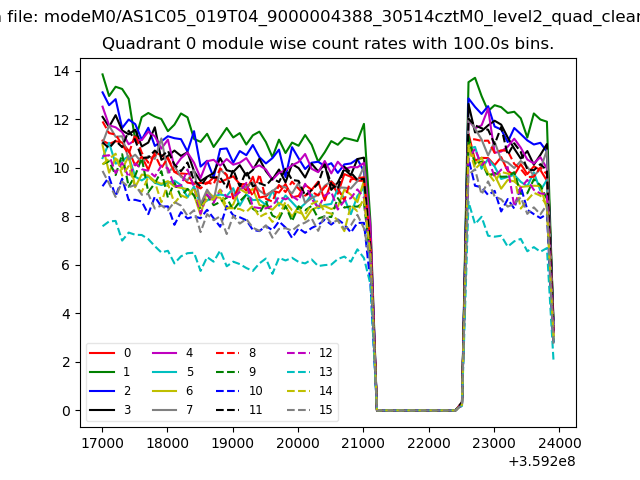 |
 |
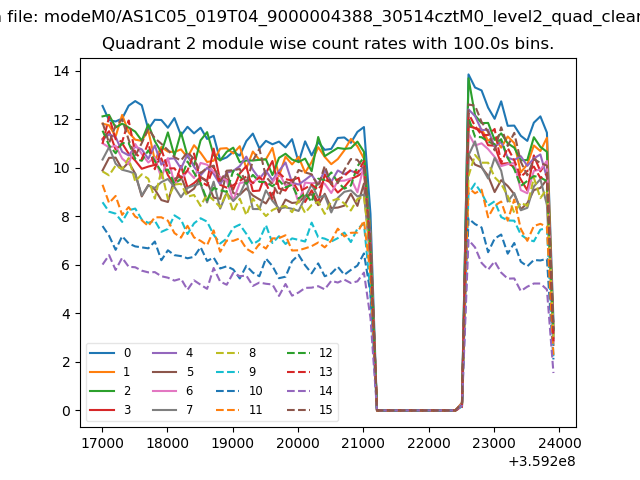
| Module-wise count rates for Quadrant B Data is divided into 100 sec bins |
 |
 |
| Module-wise count rates for Quadrant C Data is divided into 100 sec bins |
 |
 |
| Module-wise count rates for Quadrant D Data is divided into 100 sec bins |
 |
 |
| Parameter | Plot |
|---|---|
| CZT HV Monitor | 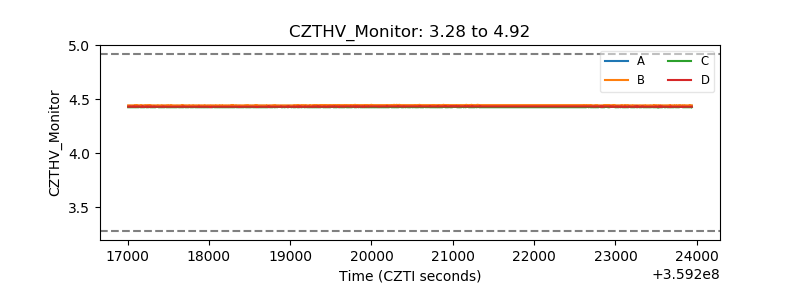 |
| D_VDD | 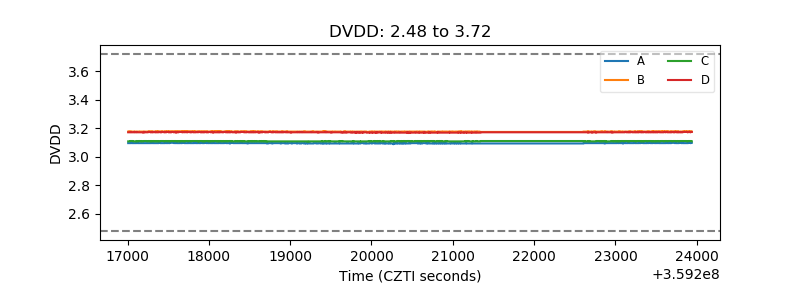 |
| Temperature 1 | 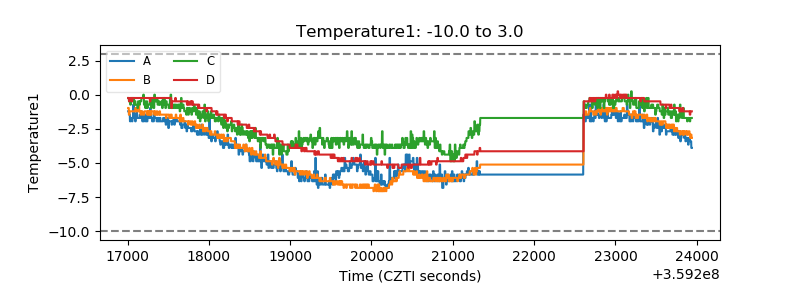 |
| Veto HV Monitor |  |
| Veto LLD | 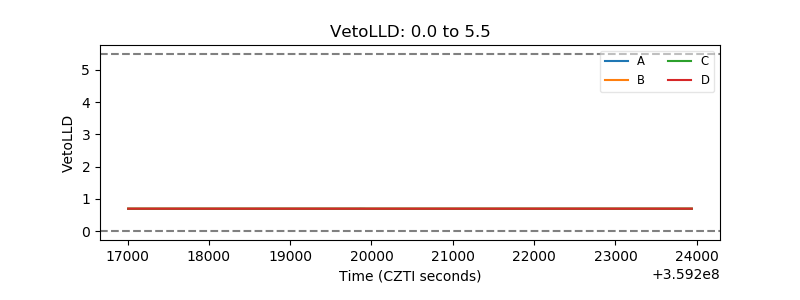 |
| Alpha Counter | 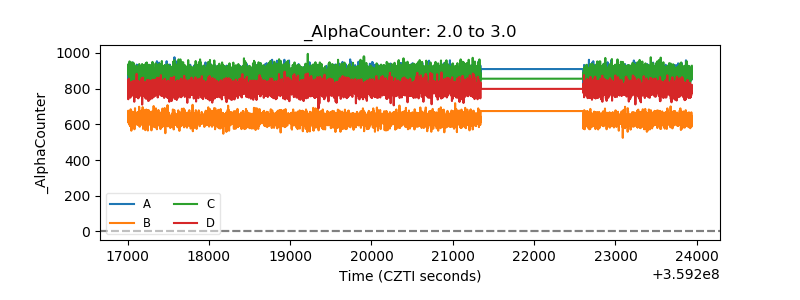 |
| _CPM_Rate | 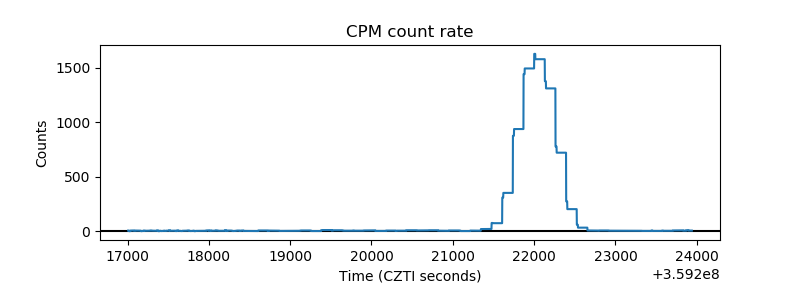 |
| CZT Counter | 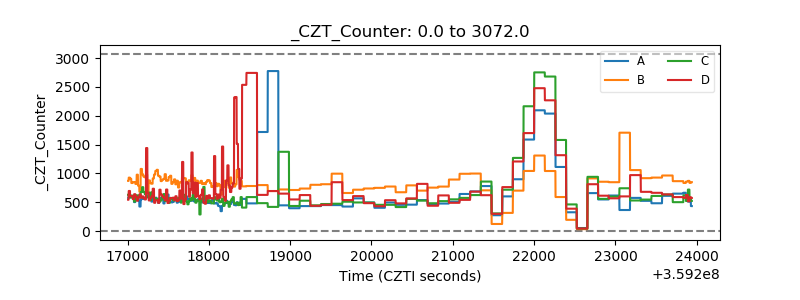 |
| +2.5 Volts monitor |  |
| +5 Volts monitor |  |
| _ROLL_ROT | 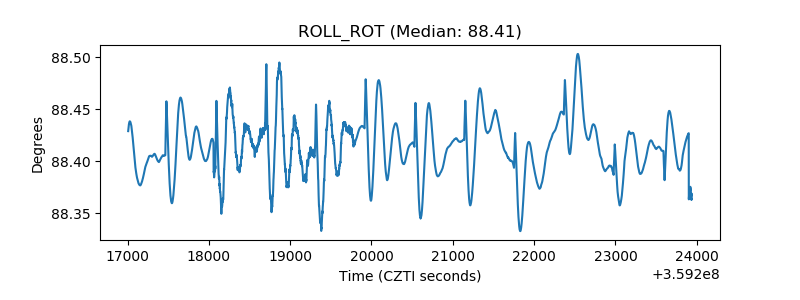 |
| _Roll_DEC | 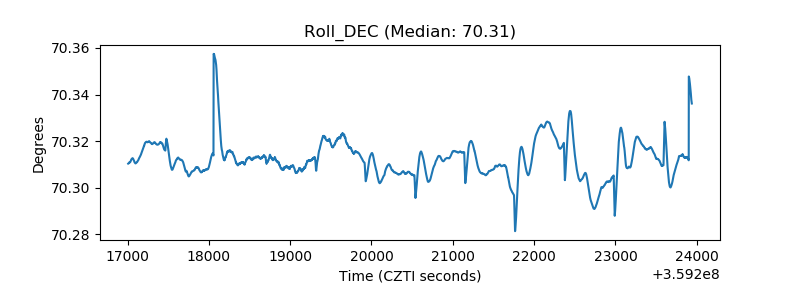 |
| _Roll_RA | 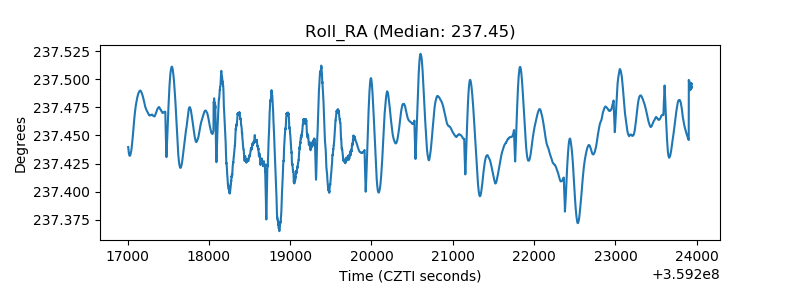 |
| Veto Counter | 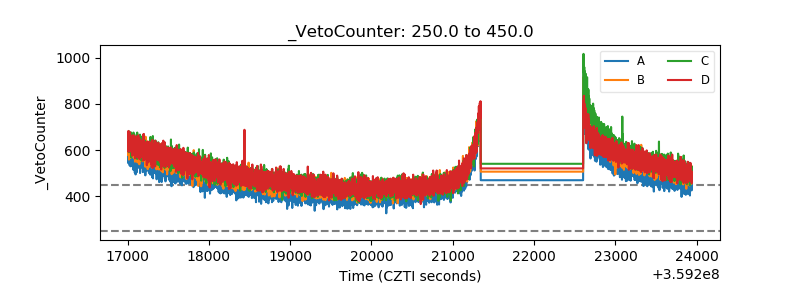 |