| Param | Original file | Final file |
|---|---|---|
| Filename | modeM0/AS1C05_019T04_9000004388_30516cztM0_level2.evt | modeM0/AS1C05_019T04_9000004388_30516cztM0_level2_quad_clean.evt |
| Size (bytes) | 565,200,000 | 114,624,000 |
| Size | 539.0 MB | 109.3 MB |
| Events in quadrant A | 3,234,460 | 769,374 |
| Events in quadrant B | 5,624,368 | 759,861 |
| Events in quadrant C | 3,441,240 | 746,930 |
| Events in quadrant D | 4,356,656 | 721,620 |
| Mode M0 | |||
|---|---|---|---|
| Quadrant | BADHDUFLAG | Total packets | Discarded packets |
| A | 0 | 14134 | 2 |
| B | 0 | 21590 | 2 |
| C | 0 | 14473 | 2 |
| D | 0 | 17429 | 2 |
| Mode M9 | |||
|---|---|---|---|
| Quadrant | BADHDUFLAG | Total packets | Discarded packets |
| A | 0 | 8 | 0 |
| B | 0 | 9 | 0 |
| C | 0 | 9 | 0 |
| D | 0 | 9 | 0 |
| Mode SS | |||
|---|---|---|---|
| Quadrant | BADHDUFLAG | Total packets | Discarded packets |
| A | 0 | 138 | 0 |
| B | 0 | 138 | 0 |
| C | 0 | 138 | 0 |
| D | 0 | 138 | 0 |
| Quadrant | Total seconds | Saturated seconds | Saturation percentage |
|---|---|---|---|
| A | 6796 | 56 | 0.824014% |
| B | 6796 | 181 | 2.663331% |
| C | 6796 | 179 | 2.633902% |
| D | 6796 | 251 | 3.693349% |
Noise dominated data is calculated using 1-second bins in cleaned event files. If a bin has >2000 counts, and if more than 50% of those come from <1% of pixels, then it is considered to be noise-dominated and hence unusable.
| Quadrant | # 1 sec bins | Bins with >0 counts | Bins with >2000 counts | High rate bins dominated by noise | Noise dominated (total time) | Noise dominated (detector-on time) | Marked lightcurve |
|---|---|---|---|---|---|---|---|
| A | 7611 | 6797 | 3 | 3 | 0.04% | 0.04% | 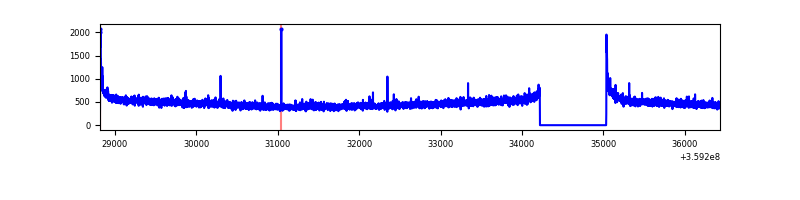 |
| B | 7611 | 6797 | 16 | 16 | 0.21% | 0.24% | 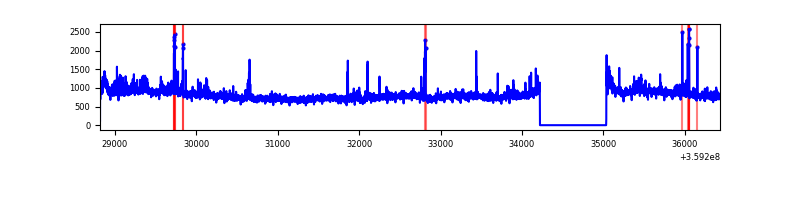 |
| C | 7611 | 6797 | 4 | 4 | 0.05% | 0.06% | 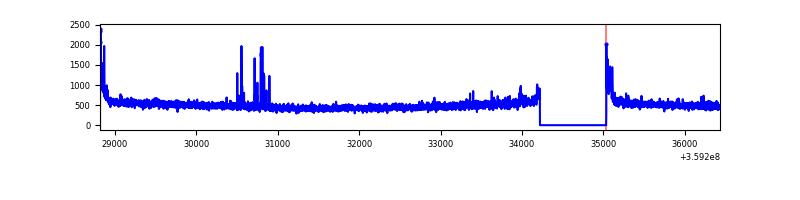 |
| D | 7611 | 6797 | 172 | 172 | 2.26% | 2.53% |  |
Top three noisy pixels from each quadrant. If the there are fewer than three noisy pixels in the level2.evt file, extra rows are filled as -1
| Pixel properties | Quadrant properties | ||||||
|---|---|---|---|---|---|---|---|
| Quadrant | DetID | PixID | Counts | Sigma | Mean | Median | Sigma |
| A | 8 | 192 | 23683 | 137.07 | 829 | 812 | 166.9 |
| A | 13 | 254 | 12534 | 70.25 | 829 | 812 | 166.9 |
| A | 3 | 137 | 7801 | 41.89 | 829 | 812 | 166.9 |
| B | 6 | 159 | 2068948 | 13454.07 | 820 | 799 | 153.7 |
| B | 0 | 229 | 98412 | 635.01 | 820 | 799 | 153.7 |
| B | 0 | 155 | 76271 | 490.97 | 820 | 799 | 153.7 |
| C | 14 | 238 | 133846 | 715.37 | 802 | 806 | 186.0 |
| C | 0 | 10 | 68452 | 363.74 | 802 | 806 | 186.0 |
| C | 10 | 22 | 47580 | 251.51 | 802 | 806 | 186.0 |
| D | 8 | 195 | 469721 | 2491.0 | 800 | 779 | 188.3 |
| D | 12 | 218 | 351491 | 1862.97 | 800 | 779 | 188.3 |
| D | 13 | 249 | 219758 | 1163.21 | 800 | 779 | 188.3 |
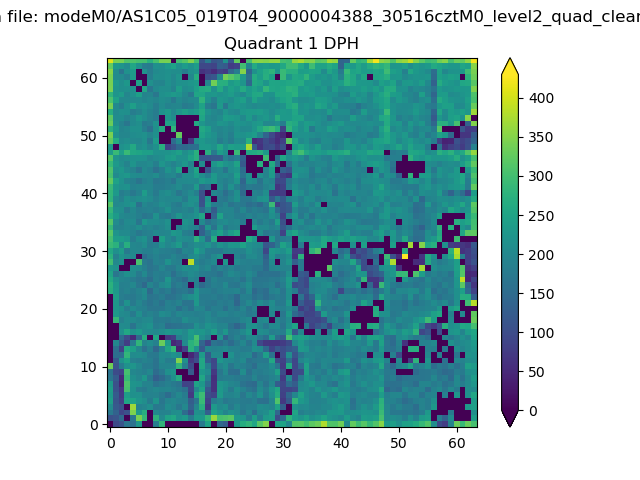
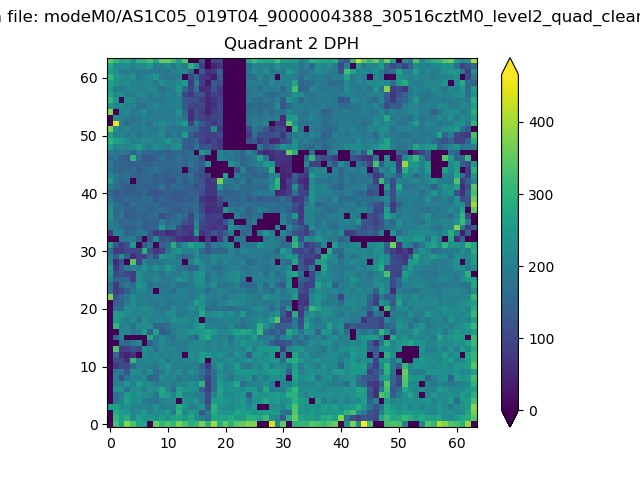
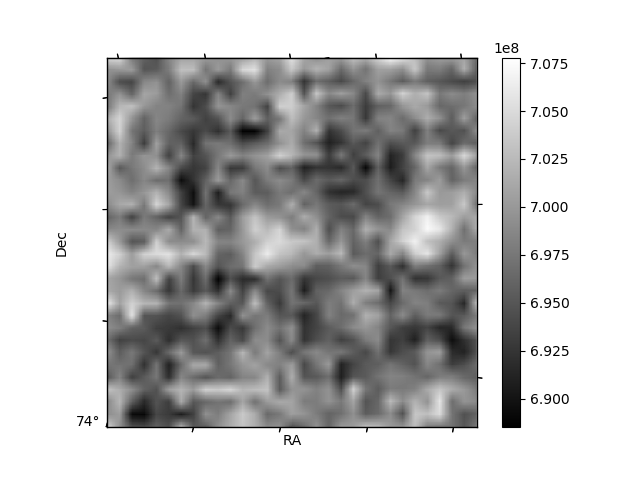
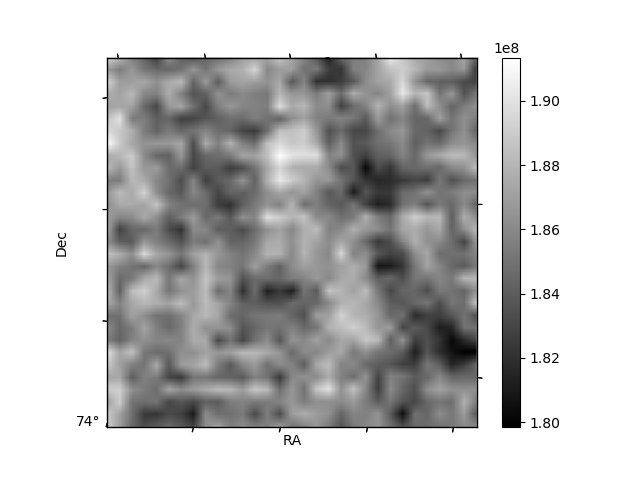
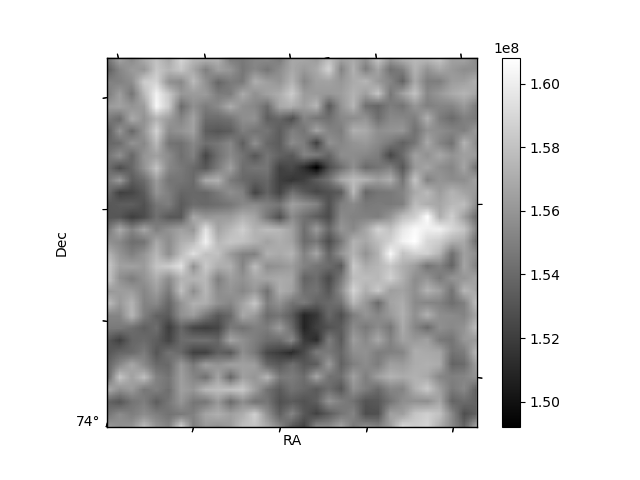
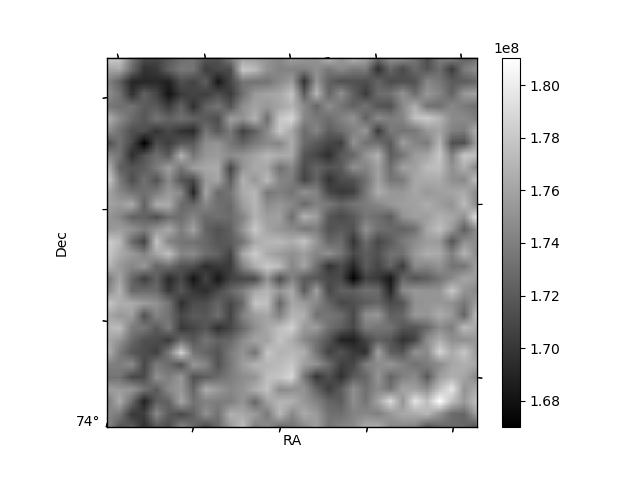
Histogram calculated using DETX and DETY for each event in the final _common_clean file
| Quadrant A | 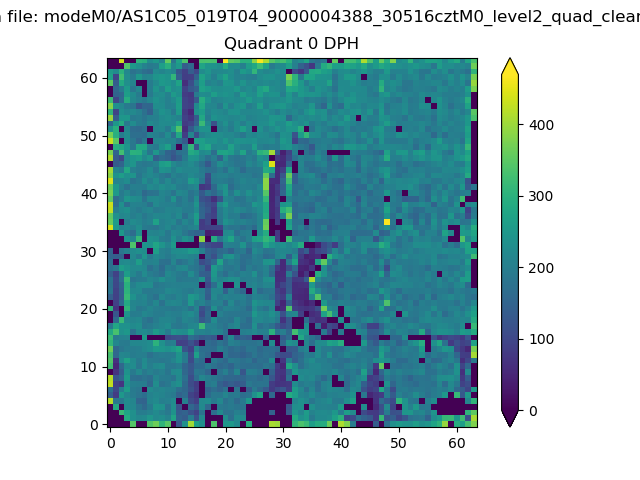 |
 |
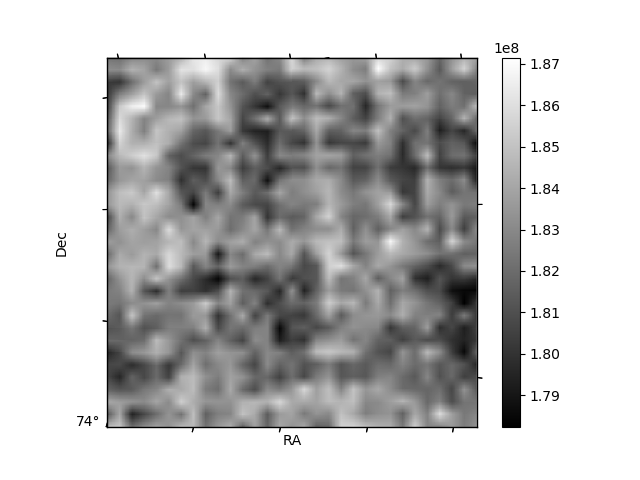
Quadrant B |
|---|---|---|---|
| Quadrant D | 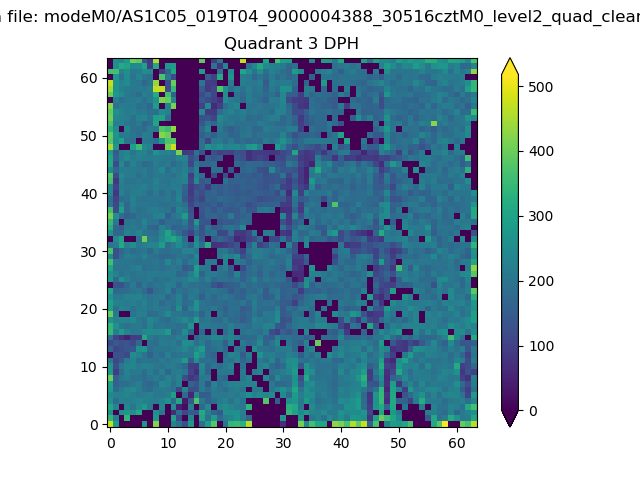 |
 |
Quadrant C |
| Plot type | Count rate plots | Images |
|---|---|---|
| Comparison with Poisson distribution Blue bars denote a histogram of data divided into 1 sec bins. Red curve is a Poisson curve with rate = median count rate of data. |
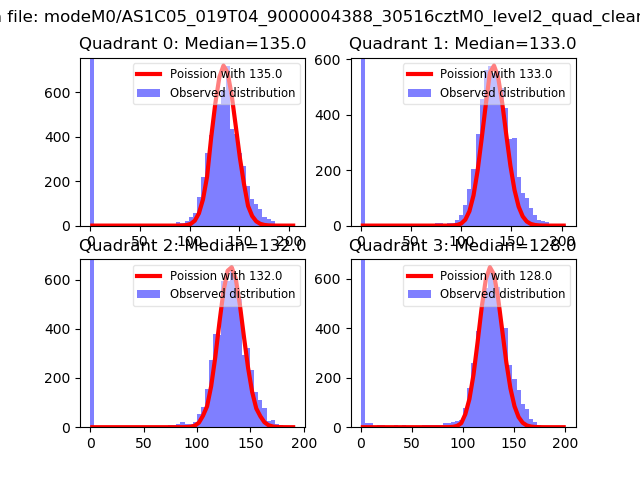 |
 |
| Quadrant-wise count rates Data is divided into 100 sec bins |
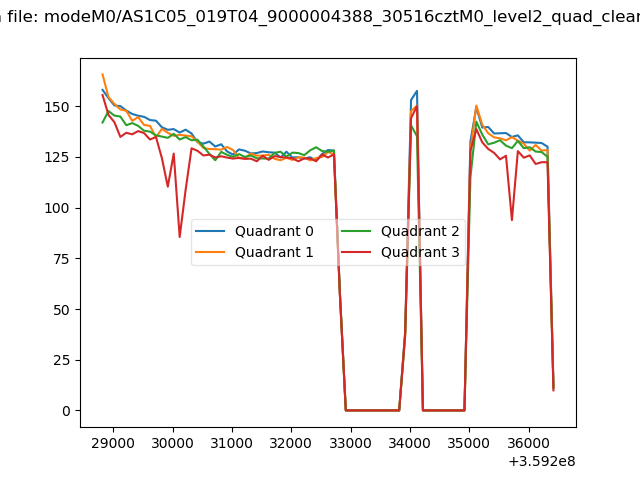 |
|
| Module-wise count rates for Quadrant A Data is divided into 100 sec bins |
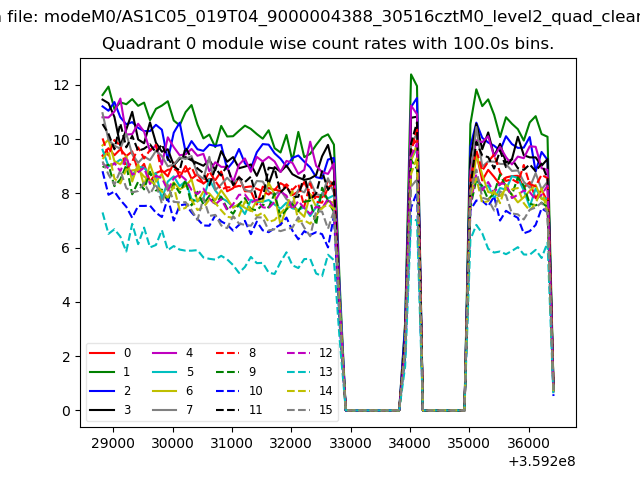 |
 |
| Module-wise count rates for Quadrant B Data is divided into 100 sec bins |
 |
 |
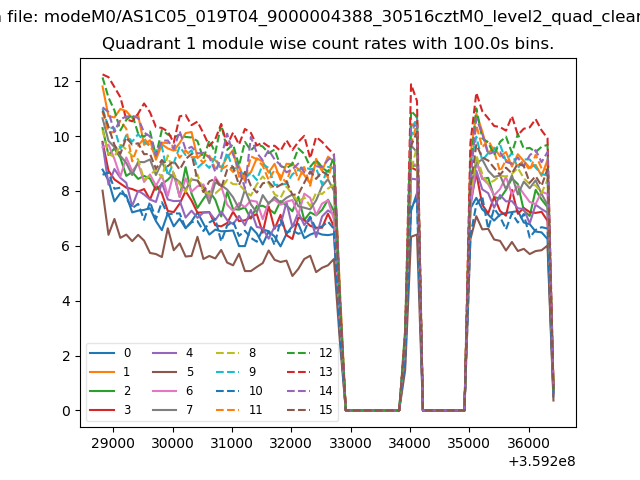
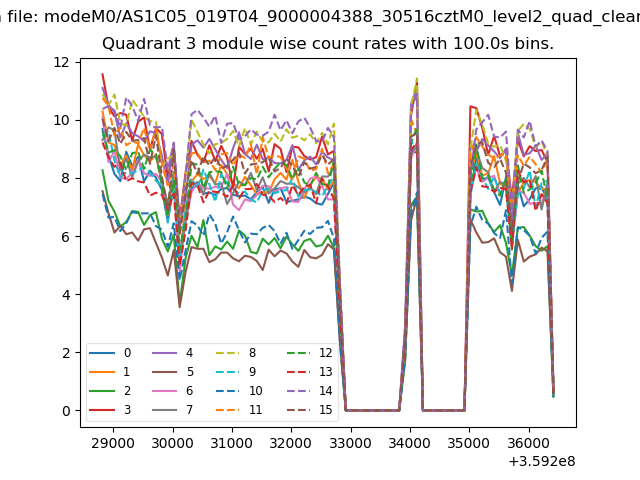
| Module-wise count rates for Quadrant C Data is divided into 100 sec bins |
 |
 |
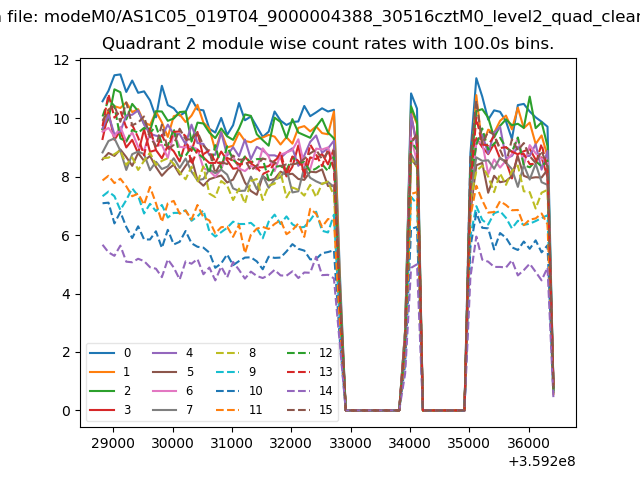
| Module-wise count rates for Quadrant D Data is divided into 100 sec bins |
 |
 |
| Parameter | Plot |
|---|---|
| CZT HV Monitor | 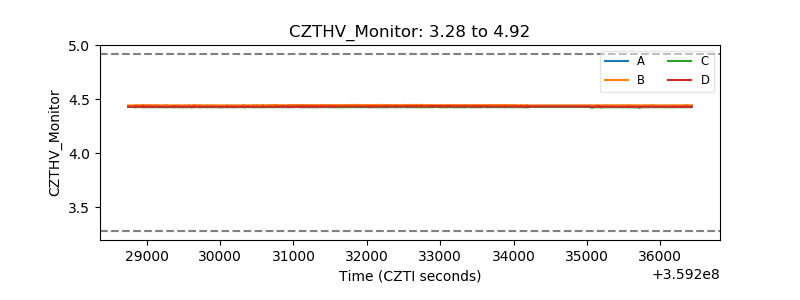 |
| D_VDD |  |
| Temperature 1 | 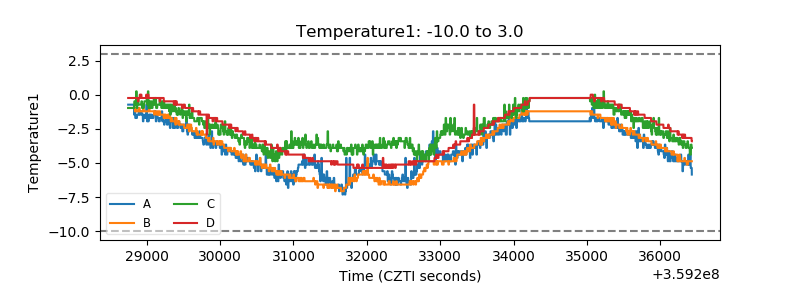 |
| Veto HV Monitor |  |
| Veto LLD | 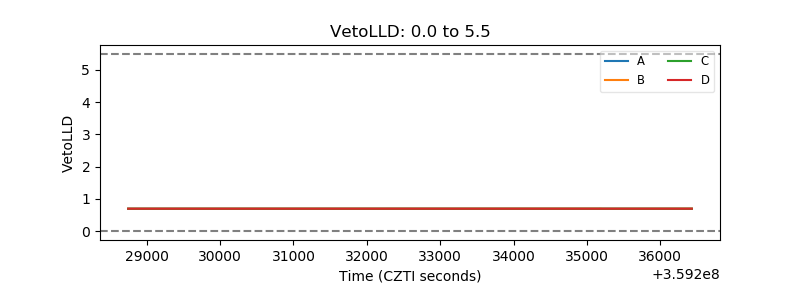 |
| Alpha Counter | 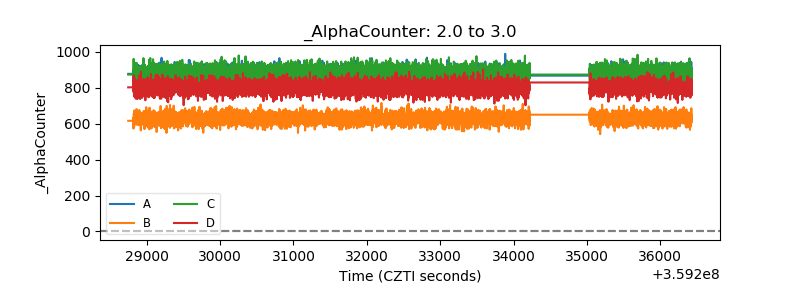 |
| _CPM_Rate | 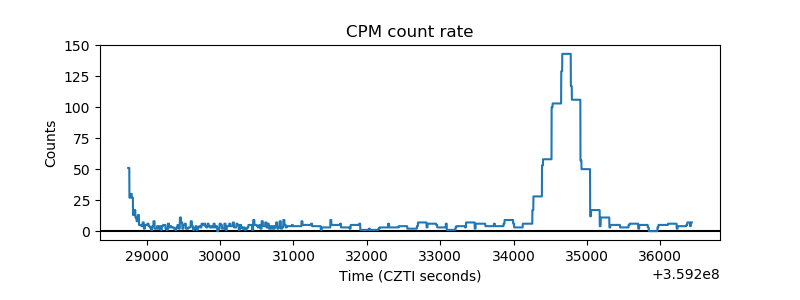 |
| CZT Counter | 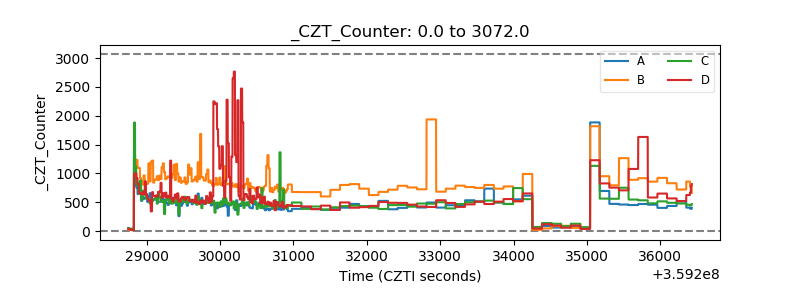 |
| +2.5 Volts monitor |  |
| +5 Volts monitor |  |
| _ROLL_ROT | 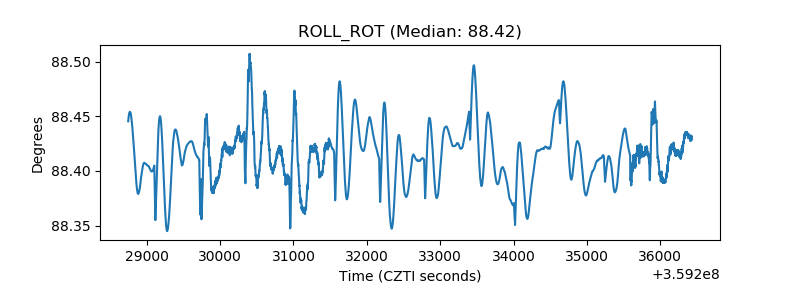 |
| _Roll_DEC | 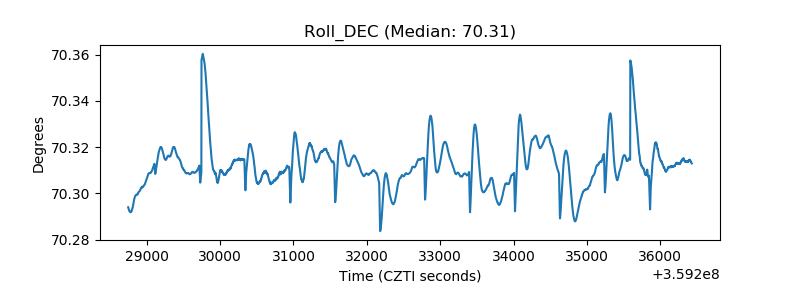 |
| _Roll_RA | 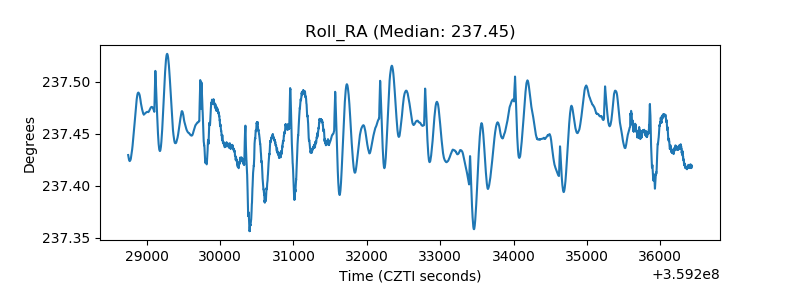 |
| Veto Counter | 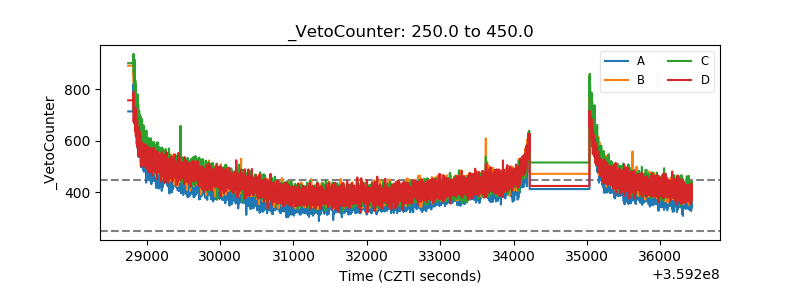 |